
Genomic Prevalence of Heterochromatic H3K9me2 and Transcription Do
Not Discriminate Pluripotent from Terminally Differentiated
Cells
Cellular differentiation entails reprogramming of the transcriptome from a
pluripotent to a unipotent fate. This process was suggested to coincide with a
global increase of repressive heterochromatin, which results in a reduction of
transcriptional plasticity and potential. Here we report the dynamics of the
transcriptome and an abundant heterochromatic histone modification,
dimethylation of histone H3 at lysine 9 (H3K9me2), during neuronal
differentiation of embryonic stem cells. In contrast to the prevailing model, we
find H3K9me2 to occupy over 50% of chromosomal regions already in stem
cells. Marked are most genomic regions that are devoid of transcription and a
subgroup of histone modifications. Importantly, no global increase occurs during
differentiation, but discrete local changes of H3K9me2 particularly at genic
regions can be detected. Mirroring the cell fate change, many genes show altered
expression upon differentiation. Quantitative sequencing of transcripts
demonstrates however that the total number of active genes is equal between stem
cells and several tested differentiated cell types. Together, these findings
reveal high prevalence of a heterochromatic mark in stem cells and challenge the
model of low abundance of epigenetic repression and resulting global basal level
transcription in stem cells. This suggests that cellular differentiation entails
local rather than global changes in epigenetic repression and transcriptional
activity.
Published in the journal:
. PLoS Genet 7(6): e32767. doi:10.1371/journal.pgen.1002090
Category:
Research Article
doi:
https://doi.org/10.1371/journal.pgen.1002090
Summary
Cellular differentiation entails reprogramming of the transcriptome from a
pluripotent to a unipotent fate. This process was suggested to coincide with a
global increase of repressive heterochromatin, which results in a reduction of
transcriptional plasticity and potential. Here we report the dynamics of the
transcriptome and an abundant heterochromatic histone modification,
dimethylation of histone H3 at lysine 9 (H3K9me2), during neuronal
differentiation of embryonic stem cells. In contrast to the prevailing model, we
find H3K9me2 to occupy over 50% of chromosomal regions already in stem
cells. Marked are most genomic regions that are devoid of transcription and a
subgroup of histone modifications. Importantly, no global increase occurs during
differentiation, but discrete local changes of H3K9me2 particularly at genic
regions can be detected. Mirroring the cell fate change, many genes show altered
expression upon differentiation. Quantitative sequencing of transcripts
demonstrates however that the total number of active genes is equal between stem
cells and several tested differentiated cell types. Together, these findings
reveal high prevalence of a heterochromatic mark in stem cells and challenge the
model of low abundance of epigenetic repression and resulting global basal level
transcription in stem cells. This suggests that cellular differentiation entails
local rather than global changes in epigenetic repression and transcriptional
activity.
Introduction
Resetting of the transcriptional program is the key driver for cell type specification during organismal development [1], [2]. While embryonic stem (ES) cells bear the fascinating ability to acquire very diverse fates, derived somatic stages are usually irreversible under physiological conditions. This unidirectionality has been suggested to depend in part on epigenetic repression of lineage unrelated genes [3], [4]. Accordingly, ES cell plasticity was suggested to rely on a low prevalence of heterochromatin and coinciding promiscuous low-level expression of many genes in stem cells [5]–[11]. In line with this model, distinct changes in nuclear staining had previously been observed by electron microscopy during cellular differentiation [12], [13]. Further, a subset of promoters was shown to become DNA methylated [14]–[16] and the repressive histone modifications H3K27me3 and H3K9me3 were reported to locally expand in differentiated cells [9].
Here, we set out to test the model of widespread heterochromatinization via monitoring of the differentiation-coupled dynamics of H3K9me2, a repressive epigenetic modification, which appears to be the most abundant heterochromatic modification and has recently been reported to cover large domains in differentiated cells [17]. Unexpectedly, we found that H3K9me2 is not only highly abundant in terminally differentiated cells, but already occupies large parts of the genome in pluripotent stem cells. In this cellular state, H3K9me2 occupies most genomic regions devoid of transcription and certain histone modifications. While our analysis revealed discrete local changes particularly at gene bodies, we observed little global increase in H3K9me2 during differentiation. This unexpected finding motivated us to revisit the model of promiscuous low-level gene expression in undifferentiated cells by quantitative RNA sequencing. Remarkably, we found the actual number of low-level expressed genes, postulated hallmarks of stem cells to be equal between both developmental states. Together, our findings challenge the model of promiscuous basal gene expression as a distinct property of pluripotency and a widespread increase of heterochromatin during cellular differentiation.
Results
H3K9me2 is nearly invariant and only displays distinct local changes between developmental stages
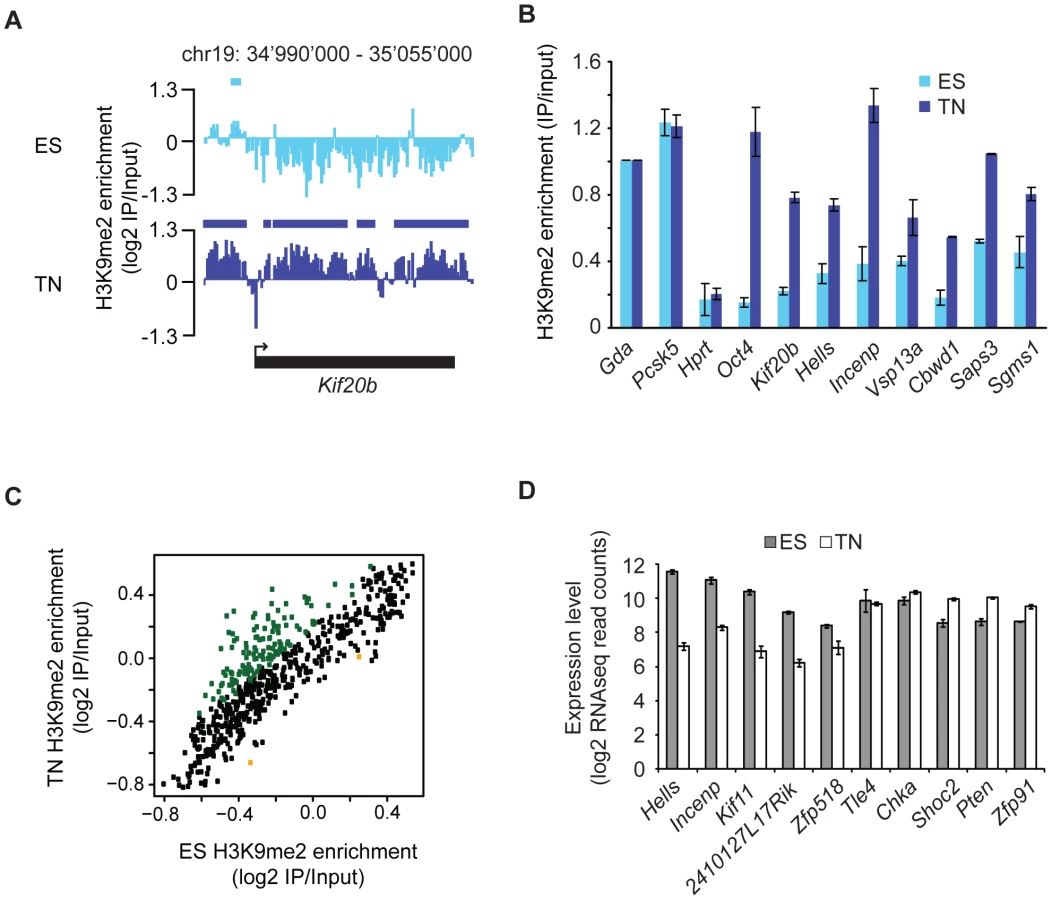
To asses differentiation associated dynamics of the repressive histone modification H3K9me2 we made use of a highly pure and robust murine in vitro neurogenesis model [18], which we previously used to profile histone and DNA methylation [14]. Here, we generated profiles for H3K9me2 in pluripotent embryonic stem cells and derived terminally differentiated pyramidal neurons. We made use of custom tiling arrays covering 10% of the mouse genome including all well-annotated promoters, several large multi-gene loci and the complete chromosome 19 (see Figure S1 and Text S1). The chromosomal profiles for H3K9me2 revealed domains of enrichments that upon visual inspection were highly comparable between stem cells and the neuronal state (Figure 1A), which is further supported by a high overall pair-wise correlation (Figure 1B). Despite this overall similarity we noticed confined regional differences (Figure 1A), a finding which is consistent with the fact that biological replicates of H3K9me2 are more similar than the patterns between cell states (Figure 1B). We also included in our comparison a recently published dataset for H3K9me2 in a distinct ES cell line [17], which shows high correlation to our ES cell datasets despite different experimental conditions (Figure S2). Of note, analysis of the H3K9me2 dataset from Wen et al. [17] revealed that chromosome 19 behaves similar to the other chromosomes (Figure S3), suggesting that our results can be extrapolated to the entire genome. Together this demonstrates that our H3K9me2 data are reproducible and of high resolution, yet overall patterns appear to be highly similar between a pluripotent and a terminally differentiated state. Visual inspection suggests that H3K9me2 covers large domains in both ES cells and neurons (Figure 1A). To quantitatively define the actual location and sizes of domains we applied a Hidden-Markov-Model (HMM) analysis to the microarray data. This unsupervised statistical method is a widely accepted approach for unbiased data segmentation in epigenome analysis [19], [20]. The HMM analysis not only agreed with and statistically corroborated the visual impression of the raw data, but also yielded robust results under variable settings (Figure S4). It revealed that over 50% of chromosome 19 is covered by H3K9me2 in ES cells (Figure 1C). Using the same approach for the H3K9me2 data in the ES cell-derived terminally differentiated neurons, we detected a modest yet reproducible 5% increase of genomic regions covered by H3K9me2 (Figure 1C). We conclude that global coverage and size of H3K9me2 domains is nearly identical between ES cells and derived post-mitotic pyramidal neurons. In line with this finding we do not detect a significant change in global H3K9me2 levels by Western blot detection (Figure 1D). Moreover, H3K9me2 domain features of ES cells and neurons show similar size distribution and median length (Figure S4). Further analysis revealed that changes in H3K9me2 between the two examined cellular states are rare; 88% of H3K9me2 occupied regions in ES cells are also occupied in neurons (Figure 1F). Notably, regions that change in H3K9me2 state tend to be small and are below the average size of invariant domains (Figure S5). Consistent with the overall increase of 5% in H3K9me2 coverage during differentiation, regions which gain H3K9me2 are more frequent and of larger size than regions showing a loss of the mark (Figure S5 and Figure S6). Interestingly, most of the larger regions (>10 kb) that gain H3K9me2 are located within genes, starting downstream of the promoter region (Figure 2A and Figure S5). These global findings are fully reproducible in single gene controls (Figure 2B) and consistent with a focused comparison of only genic regions (Figure 2C). Importantly, this shows that our experimental and data analysis approach is indeed highly sensitive to detect differences if they do occur. Interestingly, many genes that acquire H3K9me2 show slightly reduced expression in many cases, while others increase expression upon gain of the modification (Figure 2D and Figure S5). This suggests that the gain of H3K9me2, while highly selective for gene bodies, cannot simply be explained by the silencing of gene activity.

H3K9me2 and H3K27me3 are mutually exclusive
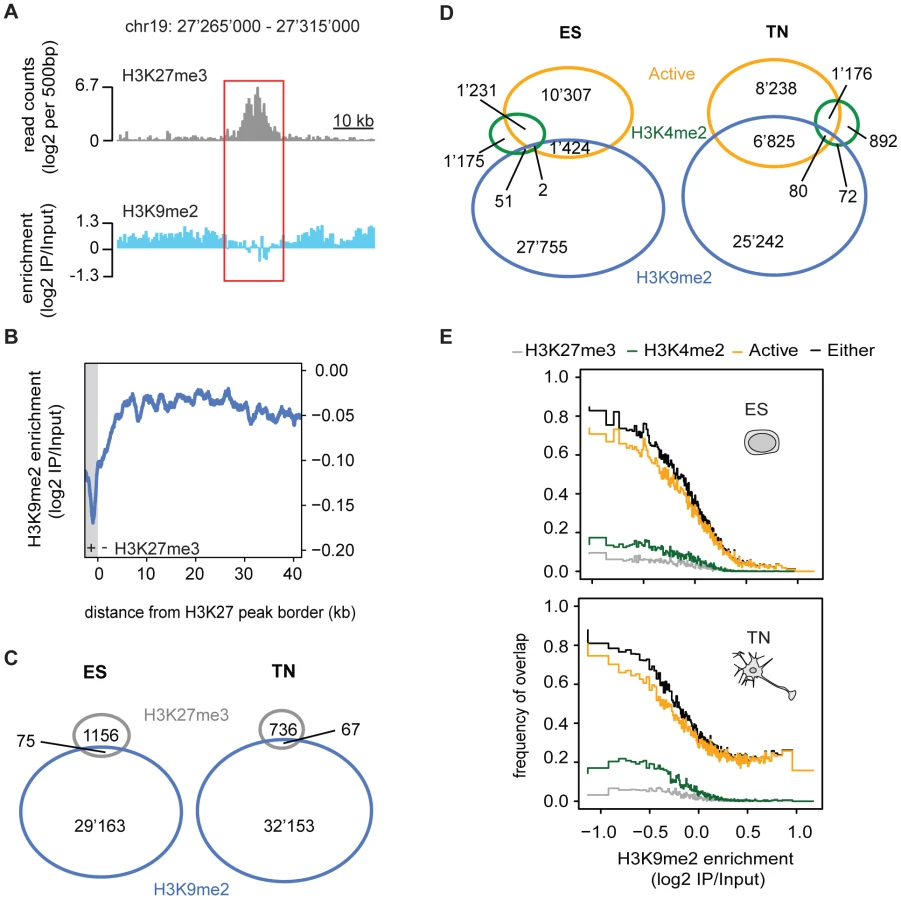
Given the high prevalence of H3K9me2, we next asked how its presence relates to a distinct repressive chromatin modification, namely trimethylation of H3K27 (H3K27me3). This mark is set by the Polycomb pathway and often occurs in domains of several kilobases [9], [21], [22]. We find that both heterochromatic histone modifications occur mutually exclusive even when in direct neighborhood as illustrated by the sharp boundaries of the H3K9me2 signal next to H3K27me3 peaks (Figure 3A, 3B and 3C). This is consistent with a previous study in human embryonal carcinoma cells that was limited to promoters [23].
H3K9me2 is largely exclusive with active chromatin
We further related H3K9me2 occupancy to regions with transcriptional activity or presence of the active modification H3K4me2. Active regions are mutually exclusive with H3K9me2 in ES cells but surprisingly to a lesser extent in neurons (Figure 3D). The compatibility of H3K9me2 and gene expression in neurons is however limited to gene bodies and does not occur in the promoters of expressed genes, consistent with the former regions gaining H3K9me2 during differentiation (Figure 2A and Figure S7). We find the majority of H3K4me2 regions to be mutually exclusive with H3K9me2 in stem cells (Figure 3D). In neurons, a small number of regions become co-occupied, again most of these being within transcribed genes (Figure 3D). Importantly, an HMM independent analysis confirms that regions with high H3K9me2 enrichment do not overlap with transcribed genes in stem cells, yet a subset does in neurons (Figure 3E). We conclude that gain of H3K9me2 during differentiation has only a minor effect on the overall chromosomal coverage of the modification, yet it occurs highly localized and preferentially at genic regions.
Prevalent low-level transcription is not a stem cell–specific feature
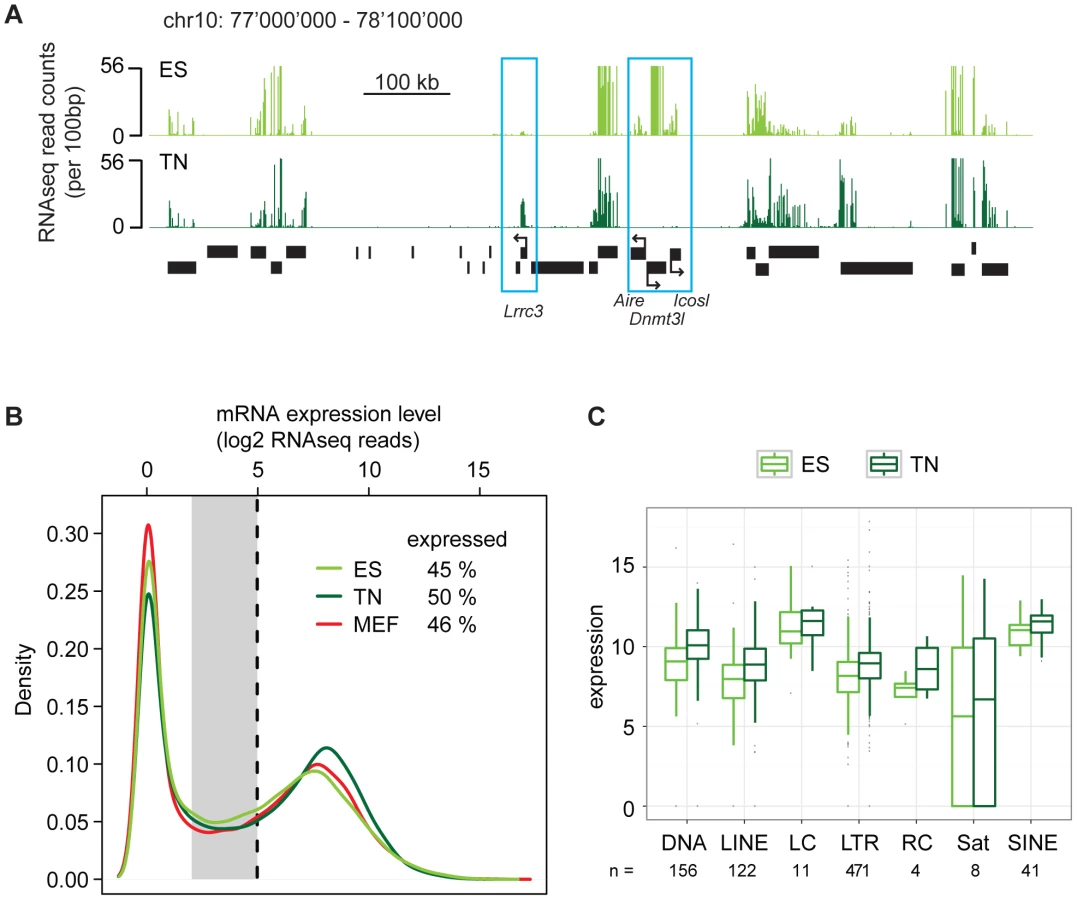
Our finding of surprising conservation of heterochromatin patterns in a refined model of differentiation let us to revisit the transcriptome in a quantitative manner using high throughput RNA sequencing (RNAseq). RNAseq in ES cells and derived neurons revealed the expected down regulation of stem cell specific genes and induction of neuron specific genes (Figure 4A). Further, when counting RNA molecules after gene mapping and normalization, both cell types displayed a characteristic bimodal distribution. This reflects a group of genes that is in a clear off state with no detectable RNA molecules and a second peak of expressed genes (Figure 4B). Separating these two groups of genes by a stringent cutoff revealed that out of 35′606 transcription units, 45% are expressed in ES cells. Interestingly, we identified a slightly higher number (50%) of expressed genes in terminally differentiated neurons, indicating that differentiation of stem cells is not coinciding with a reduced number of highly expressed genes. This agrees with a recent report that suggested that stem cells and somatic cells do mainly differ in the number of low-level expressed genes due to a global reduction of basal gene activity in the course of lineage-commitment and loss of pluripotency [10]. To test this in our in vitro differentiation system, we grouped the genes that could not clearly be assigned to the on or off state, into a separate class of genes expressed at low to background level (Figure 4B). This analysis reveals that in stem cells 16% of all transcription units show a basal expression level. Surprisingly however, the proportion of genes expressed at such low level (14%) is very similar in neurons. This unexpected finding prompted us to conduct an additional RNAseq experiment in a second fully differentiated somatic murine cell type; primary mouse embryonic fibroblasts (MEFs). Interestingly, also fibroblasts display a similar transcriptional landscape as stem cells, with 46% of all transcription units being highly expressed and 13% being expressed at basal levels. Hence, this qualitative similarity of expression patterns is not specific to the neuronal subtype we generated in vitro, but appears to be a more general property of both undifferentiated and differentiated cells. Thus, while transcripts expressed at low levels show little overlap between stem cells and somatic cells (Figure S8), their numbers are remarkably similar. Stem cells do also not show an increased number of highly expressed genes. Based on additional analysis we can exclude that this similarity of the transcriptional landscape is a consequence of insufficient sampling (Figure S9). Moreover, it is not limited to genic regions as the abundance of transcripts generated from diverse classes of endogenous repeat is comparable between stem cells and neurons (Figure 4C).
Discussion
Embryonic stem cells are characterized by their potential to differentiate into any cell type of the three germ layers in the developing embryo, while somatic cells lose this developmental plasticity upon lineage-commitment. Despite its relevance for our understanding of development and disease, the molecular determinants of pluripotency are still not fully understood and the factors responsible for this uniqueness of stem cells are actively debated [24]. Our study of gene expression and an abundant heterochromatin mark reveal surprising conservation of the transcriptome and epigenome landscape between pluripotent and unipotent cells. H3K9me2 is already highly prevalent in ES cells, arguing that the pathways that mediate H3K9me2 are highly active in stem cells, and serve similar functions as in somatic cells, which only show a slight increase of the mark (from 53 to 58%). Interestingly, the observed gain occurs very localized at gene bodies and does not necessarily coincide with lower transcription of the corresponding gene. The analysis of regions that acquire H3K9me2 during differentiation further revealed a differentiation specific coexistence of H3K9me2 and transcriptional activity, which is not detected in the pluripotent state and which could be involved in modulating expression in the differentiated cell. Nevertheless, despite the subtle increase we detected, an involvement of H3K9me2 in globally regulating cell-type specific gene repression appears unlikely. The limited dynamics as compared to massive transcriptome reprogramming and the limited correlation between expression and gain of H3K9me2 at target genes argue against H3K9me2 as being a major player in setting up gene expression programs.
These findings disagree with a recent report that suggested absence of large H3K9me2 domains in ES cells and found a striking increase in differentiated cells [17]. Notably, our ES cell profile for H3K9me2 is similar to the one generated previously (Figure 1B and Figure S2), making data analysis a likely explanation for the discrepancy. We applied an unbiased approach that is insensitive to variations between arrays and which we show to lead to similar results under various parameter settings (Figure 3 and Figure S10). As already discussed by Fillion and van Steensel [25], the previous study relied on defined thresholds, which can be prone to false estimation of differences particular in the absence of biological replicates [25].
Widespread low-level expression in stem cells has previously been reported and interpreted as a sign of pluripotency [5], [6], [10]. It has been speculated that this basal promiscuous activity would poise genes for rapid induction upon receipt of differentiation cues [5], [6], [10]. Using mRNA sequencing in our differentiation paradigm does not confirm this model. We do not find evidence of elevated transcription throughout the genome or on specific chromosome (Figure S8; [10]). A likely explanation for these discrepancies is that microarrays, which were used in the previous studies, overestimate low level signal due to cross-hybridization [26]. In the present study we utilized RNAseq, which permits an actual counting of RNA molecules and thus enables accurate discrimination between very low and no expression. Notably, RNA sequencing experiments have recently put other findings in question that relied on quantifying small transcriptome differences detected by microarrays. For example, recent RNAseq data challenged the presence of pervasive intergenic transcription [26] and the existence of transcriptional dosage compensation of the single male X chromosome [27]. In addition to the increased sensitivity of RNAseq that can explain the differences to previous studies, the presence of a small fraction of differentiated cells in suboptimal conditions of stem cell culture could similarly contribute to an overestimation of the number of genes that are actually expressed in stem cells. Notably, the ES cell differentiation protocol applied by us is optimized to reduce the number of differentiated cells in the culture [18].
In summary, our analysis suggests to revisit the model of massive heterochromatinization during cellular differentiation via a global increase in repressive histone marks [5]–[9], [17] and coinciding repression of basal gene activity [5], [6], [10].
Our data together with previous reports on dynamics of DNA methylation, H3K9me3 and the Polycomb pathway between pluripotent and somatic cells [9], [14], [15], [28]–[31] support a model whereby repressive chromatin is already highly active in stem cells and that epigenome reprogramming entails localized changes of repressive histone modifications and DNA methylation at regulatory regions that specify and stabilize lineage specification and terminal differentiation [32]. It will be interesting to determine if these local differences account for the observed changes in nuclear morphology [33]. Notably, epigenetic repression can be overcome by the local activity of transcription factors upon strong induction cues during normal differentiation or artificially during generation of induced pluripotent stem cells (iPS) [34] and might therefore safeguard rather than actively channel development via direct transcriptome regulation.
Methods
Cell culture
Wild-type embryonic stem cells (129Sv-C57Bl/6) were cultured and differentiated as previously described [14], [35]. Fibroblasts were isolated from wild-type embryos (C57Bl/6).
Western blot and peptide dot blot analysis
Peptide sequences can be found in Table S2. Western blot analysis was performed with acid extracts using 1/1000 dilutions of either anti-H3K9me2 (Abcam no. 1220) or anti-H4 (Upstate, no. 07–108) antibodies. Blots were developed with ECL reagent (GE Healthcare).
Chromatin-IP (ChIP)
ChIP experiments were performed as described before [14], starting with 70 µg of chromatin and 5 µg of the following antibodies: anti-dimethyl-H3K9 (LP Bio, no. AR-0108), anti-dimethyl-H3K9 (Abcam no. 1220), anti-trimethyl-H3K27 (Upstate, no. 07–449), anti-dimethyl-H3K4 (Upstate, no. 07–030). H3K9me2 ChIP samples were amplified using the WGA2 kit (Sigma) and hybridized to a custom tiling microarray (NimbleGen Systems Inc., see below). H3K27me3 and H3K4me2 ChIP libraries for Illumina sequencing were prepared with the Illumina ChIP-Seq DNA Sample Prep Kit (Cat# IP-102-1001) according to Illumina's instructions and sequenced on the Genome Analyzer II following the manufacturer's protocols. ChIP-real time PCR was performed using SYBR Green chemistry (ABI) and 1/40 of ChIP or 20 ng of input chromatin per PCR reaction. Primers are listed in Table S1.
Microarray design
H3K9me2 ChIP samples were hybridized to custom designed microarrays representing all well-annotated promoters, several large multi-gene loci and the complete chromosome 19 with an average probe spacing of 100 bp and a total of 2.1 million features (HD2.1, NimbleGen Systems Inc).
Microarray hybridization and analysis
Sample labeling, hybridization and array scanning were performed by NimbleGen Systems Inc. according to standard procedures. For analysis, raw fluorescent intensity values were used to calculate log2 of the bound/input ratios for each individual oligo. Subsequently, for comparison all arrays were normalized to a median log2 = 0 and scale normalized to have the same median absolute deviation using the “LIMMA” R/Bioconductor package [36], [37].
RNAseq data analysis
RNA from ES cells, neurons and fibroblasts of two independent biological replicates each was used for cDNA preparation using oligo dT primers followed by sequencing on an Illumina GA II analyzer. Reads were mapped to the Mus musculus transcriptome and normalized to transcript length and sequencing library size (for details see Text S1).
Bioinformatics
Unless otherwise stated, H3K9me2 enriched regions were identified by HMM and H3K4me2 and H3K27me3 peaks using MACS peak finder [38]. Active regions were defined as RefSeq transcription units with a normalized RNAseq log2 read count above 5 (for details see Text S1). Microarray design, hybridization and analysis, ChIPseq and RNAseq analysis and additional references are described in Text S1.
Datasets
Microarray and deep sequencing data were deposited at NCBI's Gene Expression Omnibus and are accessible through GEO Series accession number GSE27866 (http://www.ncbi.nlm.nih.gov/geo/query/acc.cgi?acc=GSE27866).
Supporting Information
Zdroje
1. BoyerLAMathurDJaenischR
2006
Molecular control of pluripotency.
Curr Opin Genet Dev
16
455
462
2. EgliDBirkhoffGEgganK
2008
Mediators of reprogramming: transcription factors and transitions
through mitosis.
Nat Rev Mol Cell Biol
9
505
516
3. ReikWDeanWWalterJ
2001
Epigenetic reprogramming in mammalian
development.
Science
293
1089
1093
4. BernsteinBEMeissnerALanderES
2007
The mammalian epigenome.
Cell
128
669
681
5. NiwaH
2007
Open conformation chromatin and pluripotency.
Genes Dev
21
2671
2676
6. MeshorerEMisteliT
2006
Chromatin in pluripotent embryonic stem cells and
differentiation.
Nat Rev Mol Cell Biol
7
540
546
7. Gaspar-MaiaAAlajemAPolessoFSridharanRMasonMJ
2009
Chd1 regulates open chromatin and pluripotency of embryonic stem
cells.
Nature
460
863
868
8. PerssonJEkwallK
2010
Chd1 remodelers maintain open chromatin and regulate the
epigenetics of differentiation.
Exp Cell Res
316
1316
1323
9. HawkinsRDHonGCLeeLKNgoQListerR
2010
Distinct epigenomic landscapes of pluripotent and
lineage-committed human cells.
Cell Stem Cell
6
479
491
10. EfroniSDuttaguptaRChengJDehghaniHHoeppnerDJ
2008
Global transcription in pluripotent embryonic stem
cells.
Cell Stem Cell
2
437
447
11. Gaspar-MaiaAAlajemAMeshorerERamalho-SantosM
2011
Open chromatin in pluripotency and reprogramming.
Nat Rev Mol Cell Biol
12
36
47
12. FrancastelCSchubelerDMartinDIGroudineM
2000
Nuclear compartmentalization and gene activity.
Nat Rev Mol Cell Biol
1
137
143
13. AhmedKDehghaniHRugg-GunnPFussnerERossantJ
2010
Global chromatin architecture reflects pluripotency and lineage
commitment in the early mouse embryo.
PLoS ONE
5
e10531
doi:10.1371/journal.pone.0010531
14. MohnFWeberMRebhanMRoloffTCRichterJ
2008
Lineage-specific polycomb targets and de novo DNA methylation
define restriction and potential of neuronal progenitors.
Mol Cell
30
755
766
15. MeissnerAMikkelsenTSGuHWernigMHannaJ
2008
Genome-scale DNA methylation maps of pluripotent and
differentiated cells.
Nature
454
766
770
16. FarthingCRFiczGNgRKChanCFAndrewsS
2008
Global mapping of DNA methylation in mouse promoters reveals
epigenetic reprogramming of pluripotency genes.
PLoS Genet
4
e1000116
doi:10.1371/journal.pgen.1000116
17. WenBWuHShinkaiYIrizarryRAFeinbergAP
2009
Large histone H3 lysine 9 dimethylated chromatin blocks
distinguish differentiated from embryonic stem cells.
Nat Genet
41
246
250
18. BibelMRichterJSchrenkKTuckerKLStaigerV
2004
Differentiation of mouse embryonic stem cells into a defined
neuronal lineage.
Nat Neurosci
7
1003
1009
19. BirneyEStamatoyannopoulosJADuttaAGuigoRGingerasTR
2007
Identification and analysis of functional elements in 1%
of the human genome by the ENCODE pilot project.
Nature
447
799
816
20. KochCMAndrewsRMFlicekPDillonSCKaraozU
2007
The landscape of histone modifications across 1% of the
human genome in five human cell lines.
Genome Res
17
691
707
21. RingroseLParoR
2007
Polycomb/Trithorax response elements and epigenetic memory of
cell identity.
Development
134
223
232
22. SchwartzYBPirrottaV
2007
Polycomb silencing mechanisms and the management of genomic
programmes.
Nat Rev Genet
8
9
22
23. O'GeenHSquazzoSLIyengarSBlahnikKRinnJL
2007
Genome-wide analysis of KAP1 binding suggests autoregulation of
KRAB-ZNFs.
PLoS Genet
3
e89
doi:10.1371/journal.pgen.0030089
24. HannaJHSahaKJaenischR
2010
Pluripotency and cellular reprogramming: facts, hypotheses,
unresolved issues.
Cell
143
508
525
25. FilionGJvan SteenselB
2010
Reassessing the abundance of H3K9me2 chromatin domains in
embryonic stem cells.
Nat Genet 42 : 4; author reply 5–6
26. van BakelHNislowCBlencoweBJHughesTR
2010
Most "dark matter" transcripts are associated with known
genes.
PLoS Biol
8
e1000371
doi:10.1371/journal.pbio.1000371
27. XiongYYChenXSChenZDWangXZShiSH
2010
RNA sequencing shows no dosage compensation of the active
X-chromosome.
Nature Genetics
42
1043-U1029
28. MikkelsenTSKuMJaffeDBIssacBLiebermanE
2007
Genome-wide maps of chromatin state in pluripotent and
lineage-committed cells.
Nature
448
553
560
29. PasiniDBrackenAPHansenJBCapilloMHelinK
2007
The polycomb group protein Suz12 is required for embryonic stem
cell differentiation.
Mol Cell Biol
27
3769
3779
30. PanGTianSNieJYangCRuottiV
2007
Whole-Genome Analysis of Histone H3 Lysine 4 and Lysine 27
Methylation in Human Embryonic Stem Cells.
Cell Stem Cell
1
299
312
31. ListerRPelizzolaMDowenRHHawkinsRDHonG
2009
Human DNA methylomes at base resolution show widespread
epigenomic differences.
Nature
462
315
322
32. MohnFSchubelerD
2009
Genetics and epigenetics: stability and plasticity during
cellular differentiation.
Trends Genet
25
129
136
33. MeisterPMangoSEGasserSM
2011
Locking the genome: nuclear organization and cell
fate.
Curr Opin Genet Dev. In press
34. TakahashiKYamanakaS
2006
Induction of pluripotent stem cells from mouse embryonic and
adult fibroblast cultures by defined factors.
Cell
126
663
676
35. BibelMRichterJLacroixEBardeYA
2007
Generation of a defined and uniform population of CNS progenitors
and neurons from mouse embryonic stem cells.
Nat Protoc
2
1034
1043
36. SmythGK
2004
Linear models and empirical bayes methods for assessing
differential expression in microarray experiments.
Stat Appl Genet Mol Biol
3
Article3
37. SmythGKSpeedT
2003
Normalization of cDNA microarray data.
Methods
31
265
273
38. ZhangYLiuTMeyerCAEeckhouteJJohnsonDS
2008
Model-based analysis of ChIP-Seq (MACS).
Genome Biol
9
R137
39. FeldmanNGersonAFangJLiEZhangY
2006
G9a-mediated irreversible epigenetic inactivation of Oct-3/4
during early embryogenesis.
Nat Cell Biol
8
188
194
Štítky
Genetika Reprodukční medicínaČlánek vyšel v časopise
PLOS Genetics
2011 Číslo 6
Nejčtenější v tomto čísle
- Recurrent Chromosome 16p13.1 Duplications Are a Risk Factor for Aortic Dissections
- Statistical Inference on the Mechanisms of Genome Evolution
- Genome-Wide Association Study of White Blood Cell Count in 16,388 African Americans: the Continental Origins and Genetic Epidemiology Network (COGENT)
- Chromosomal Macrodomains and Associated Proteins: Implications for DNA Organization and Replication in Gram Negative Bacteria