
Comment on “Genomic Hypomethylation in the Human Germline Associates with Selective Structural Mutability in the Human Genome”
article has not abstract
Published in the journal:
. PLoS Genet 9(2): e32767. doi:10.1371/journal.pgen.1003332
Category:
Viewpoints
doi:
https://doi.org/10.1371/journal.pgen.1003332
Summary
article has not abstract
Copy number variants (CNVs) are a dynamic feature of the human genome that play important roles in human adaptation and susceptibility to both common and rare disease [1]. The distribution of CNVs in mammalian genomes is nonrandom, and several sequence features have been associated with CNV breakpoints and regions of high structural mutability [2]–[8]. Based on an analysis of DNA methylation patterns in human sperm, Li et al. recently reported a significant relationship between CNVs and hypomethylation in the male germline [9], leading to the suggestion that DNA hypomethylation plays a causative role in the generation of structural variation. Given the potentially profound implications of this report for the study of human disease, we read the findings of Li et al. with great interest. However, after systematically reanalyzing the relationship between CNVs and DNA methylation patterns in sperm, we have identified several cryptic confounders in the data that we believe seriously undermine the conclusions of Li et al. We outline and discuss each of these in detail below.
In their analysis, Li et al. first divided the genome into 100 kb windows, with each window being scored for the presence of CNVs ascertained from studies of both normal controls and individuals with a variety of disease states. They then applied two independent methods to estimate germline DNA methylation within each window: (i) directly using published whole genome 15× bisulfite sequencing of sperm DNA [10] and a second low coverage 2.5× dataset, and (ii) indirectly by calculating a Methylation Index (MI) based on the relative occurrence of C>T SNPs defined by the HapMap project [11]. Li et al. then defined windows that showed the lowest mean methylation levels by bisulfite sequencing (either the 1st or 5th percentiles) or had a MI = 0 as “methylation deserts,” and observed an increased prevalence of CNVs in these regions.
We replicated the analysis of Li et al. by dividing the hg18 genome into 100 kb windows and annotating these with several CNV datasets (Table S1) [7], [12]–[14]. We obtained published 15× sperm bisulfite sequencing data [10], which we used for all subsequent analysis of germline methylation levels. Although retained in the analysis of Li et al., we discarded the Y chromosome due to its small size, highly unusual sequence content, and almost complete lack of HapMap SNPs.
We first investigated repeat content within “methylation deserts” identified by Li et al. We observed a strong enrichment for common repeats in windows with the lowest 1% methylation (Figure 1a), with 30% of windows defined as “methylation deserts” containing >99th percentile of total repeat content. In particular, we noted a massive enrichment for satellite repeats within these “methylation deserts.” Satellites comprise 16.6% of sequence in hypomethylated windows, compared to only 0.26% in the rest of the genome, corresponding to a 64-fold enrichment (p = 1.4×10⁻²⁹, Mann-Whitney Rank Sum Test). Importantly, as noted by Molaro et al. [10], the vast majority of pericentromeric satellites and many other subtypes of common repeat are hypomethylated specifically in sperm. Due to their repetitive and nonunique nature, pericentromeres and regions with extreme repeat content are also hotspots for structural variation [15], [16], representing a strong confounder in any analysis of CNVs and hypomethylation. Indeed, after removing all 100 kb windows that contain satellites or contain >99th percentile by LINE, SINE, LTR, or total repeat content, we observed that in every dataset analyzed, enrichments for CNVs in windows with the lowest 1% mean methylation either significantly diminished or disappeared completely (Figure 1b).
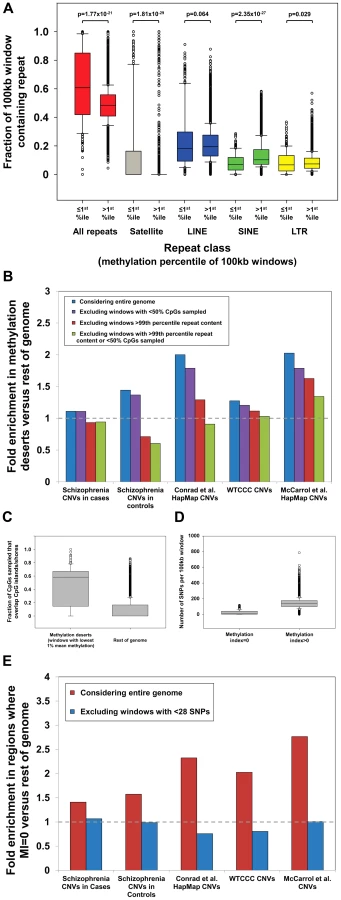
We next considered the influence of problems associated with mapping reduced-complexity bisulfite reads in duplicated regions of the genome. Specifically, we hypothesized that in CNV regions that are often comprised of nonunique sequence, the analysis of Li et al., which only considered uniquely mappable reads, might suffer from significant bias. Consistent with our hypothesis we observed a reduction in the proportion of CpG dinucleotides that had at least one overlapping read in regions defined as “methylation deserts” (Figure S1). As these “methylation deserts” are enriched >2-fold for CpG islands (CGIs) compared to the genome average [9], we measured the distribution of mapped reads across the genome in relation to CGIs and observed a strong tendency for preferential sampling of sites located within CGIs and their flanks (so-called “CpG shores”) in these “methylation deserts” (Figure 1c). Excluding windows containing extreme repeat content, on average 47.5% of CpG dinucleotides sampled by bisulfite sequencing in the remaining “methylation deserts” lie within ±2 kb of CGIs, while in the rest of the genome this figure is only 9.0% (a 5.3-fold enrichment). As the majority of CGIs are unmethylated in sperm [10], [17], any window in which bisulfite reads map preferentially within CGIs will tend to yield artifactual underestimates of the true methylation level in that region.
An illustrative example is shown in Figure S2. This window was classified by Li et al. as a “methylation desert” due to a mean methylation level <1st percentile. However, analysis of the bisulfite sequencing data shows that in fact only 27/355 (8%) of the CpG dinucleotides in this region have been sampled, most of which lie within a CpG island that spans the promoter of RPS17, a gene highly expressed in testes [18]. While methylation levels within this CGI are uniformly low, most CpGs in the rest of the window have high methylation levels (>75%), suggesting that the low mean methylation level in this window is not a true reflection of the wider region, and instead results from heavily biased sampling of sites within the CGI. The low frequency of uniquely mapped bisulfite reads in this region is attributable to the presence of a copy number variable segmental duplication of 99.85% identity.
Overall, 80/285 (28%) of the windows defined by Li et al. as “methylation deserts” were >95th percentile based on the fraction of CpGs sampled that lie within ±2 kb of CGIs. Therefore, preferential sampling of CGIs, regions that tend to be inherently unmethylated in sperm [10], [17], likely underlies a significant fraction of the regions labeled as “methylation deserts.” Crucially, after excluding CpGs lying within 2 kb of CGIs, the mean methylation level for the remainder of these windows is in fact greater than that in the rest of the genome (79.1% versus 77.2%). These same windows that show biased sampling of CGIs are also enriched for CNVs and genes highly expressed in testes (Figure S3), creating a strong confounder in any attempt to associate hypomethylation with structural variation. Indeed, after excluding 100 kb windows showing extreme preferential sampling of CGIs, in every dataset analyzed enrichments for CNVs in “methylation deserts” significantly diminished or disappeared completely (Figure 1b).
In addition to the use of bisulfite sequencing for measuring DNA methylation, Li et al. also calculated a SNP-based methylation index (MI). The MI is based on the notion that methylated cytosines have an increased vulnerability to transition mutation via spontaneous deamination [19]. Thus, by measuring the relative occurrence of C>T SNPs within CpG dinucleotides (termed “mSNPs”), it is possible to draw inferences about the ancestral methylation state of a region [11]. However, SNP-based studies of structural variation are often compromised due to the fact that many CNV regions show significantly reduced SNP density compared to the genome average (median density of HapMap SNPs within HapMap CNVs [7] is 1 per 1,087 bp, compared to 1 per 738 bp genome-wide). This stems largely from the fact that ∼98% of HapMap SNP assays map uniquely within the genome [20], resulting in markedly reduced SNP density in duplicated portions of the genome, precisely those regions that are also enriched for CNVs [2], [3], [7]. As a result, there is a strong confounding relationship between CNV regions and low SNP density that renders the use of a SNP-based MI inherently flawed for studies of structural variation.
This fact is of particular concern as Li et al. calculated their MI using an equation in which the numerator is the number of mSNPs in each region, and claimed that windows with MI = 0 represent “methylation deserts.” In total, analyzing ∼4 million HapMap SNPs, 8.2% of which are mSNPs, they defined ∼1.5% of the genome as MI = 0. However, because of the formula used, if the number of total SNPs per 100 kb window is low, then the probability of observing no mSNPs, and thus the likelihood that the MI will be zero simply due to insufficient SNP sampling, becomes large. Indicative of this bias in their data, we found that windows with MI = 0 contained a median of just 13 SNPs, compared to a median of 137 in the rest of the genome (>10-fold difference, p = 3.2×10⁻⁶, Mann-Whitney Rank Sum Test; Figure 1d).We performed power calculations based on the relative prevalence of mSNPs in the genome, showing that under a random distribution a minimum of 28 SNPs are required per window to provide <10% false discovery rate for regions with MI = 0 (Figure S4). Only 156/443 (35%) of the windows with MI = 0 identified by Li et al. contain ≥28 SNPs, suggesting that the majority of windows with MI = 0 are false positives simply due to insufficient SNP data. In fact, although Li et al. did not consider windows completely lacking SNPs in their analysis, 123/443 (28%) of regions labeled as MI = 0 contain just 1, 2, or 3 SNPs. Given the almost complete absence of data on which to base this conclusion, we suggest that it would be appropriate to remove such regions from analysis rather than concluding these represent “methylation deserts.” Indeed, after removing windows with insufficient SNP density (n<28), we observe that all enrichments for CNVs in regions with MI = 0 vanish (Figure 1e). Li et al. also observed that two-thirds of regions with MI = 0 actually showed high mean methylation levels in sperm by bisulfite sequencing and suggested that this discrepancy might be explained by low methylation specifically in the female germline. Given the problems associated with calculating MI in SNP-poor regions of the genome, we suggest that a more parsimonious explanation would be that many of these regions identified as having MI = 0 are actually false positives resulting from a failure to filter those with low SNP density.
Finally we believe that the approach used by Li et al. in which the genome was first partitioned into 100 kb intervals before associating windows containing CNVs with average methylation levels is poorly suited to address the question in mind, suffering from low resolution and an increased susceptibility to artifacts. Taking a more direct approach, we used published 15× sperm bisulfite sequencing data [10] to calculate mean methylation per base both within and flanking 5,360 nonredundant HapMap CNVs <20 kb in size (mean CNV size 3,789 bp) (Figure 2a) [7]. Although we observed a small decrease in methylation levels within CNVs compared to flanking regions, overall CNV regions have consistently high levels of methylation (mean 69%) that are only slightly lower than the genome average (70%). Furthermore this slight dip in CNV methylation corresponds precisely with an increase in CpG density and an enrichment for CGIs within CNVs (CGIs comprise 1.1% of CNVs compared to 0.75% genome-wide, a 1.4-fold difference; Figure 2b). As most CGIs are unmethylated in sperm [10], [17], this fact alone is likely to account for the small overall reduction in methylation levels associated with CNVs.

In summary, we identify multiple strong confounders in the study of Li et al. that in our opinion cast serious doubt on the notion that germline hypomethylation is causally related to structural mutability. Overall, our analysis shows that 92% of the regions defined as “methylation deserts” by Li et al. are composed of extremely high repeat content or show preferential sampling of unmethylated CpG islands (Figure 2c). After removing these biases we fail to observe any enrichment for CNVs in hypomethylated regions of the genome (Figure 1b). Although the question of whether epigenetic variation plays a role in structural mutability remains open, we caution that in order to maintain robustness any future studies must carefully control for numerous potential confounders associated with CNVs.
Supporting Information
Zdroje
1. SharpAJ, ChengZ, EichlerEE (2006) Structural variation of the human genome. Annu Rev Genomics Hum Genet 7 : 407–442.
2. SharpAJ, LockeDP, McGrathSD, ChengZ, BaileyJA, et al. (2005) Segmental duplications and copy-number variation in the human genome. Am J Hum Genet 77 : 78–88.
3. TuzunE, SharpAJ, BaileyJA, KaulR, MorrisonVA, et al. (2005) Fine-scale structural variation of the human genome. Nat Genet 37 : 727–732.
4. SharpAJ, HansenS, SelzerRR, ChengZ, ReganR, et al. (2006) Discovery of previously unidentified genomic disorders from the duplication architecture of the human genome. Nat Genet 38 : 1038–1042.
5. VissersLE, BhattSS, JanssenIM, XiaZ, LalaniSR, et al. (2009) Rare pathogenic microdeletions and tandem duplications are microhomology-mediated and stimulated by local genomic architecture. Hum Mol Genet 18 : 3579–3593.
6. BénaF, GimelliS, MigliavaccaE, Brun-DrucN, BuitingK, et al. (2010) A recurrent 14q32.2 microdeletion mediated by expanded TGG repeats. Hum Mol Genet 19 : 1967–1973.
7. ConradDF, PintoD, RedonR, FeukL, GokcumenO, et al. (2010) Origins and functional impact of copy number variation in the human genome. Nature 464 : 704–712.
8. ConradDF, BirdC, BlackburneB, LindsayS, MamanovaL, et al. (2010) Mutation spectrum revealed by breakpoint sequencing of human germline CNVs. Nat Genet 42 : 385–391.
9. LiJ, HarrisRA, CheungSW, CoarfaC, JeongM, et al. (2012) Genomic hypomethylation in the human germline associates with selective structural mutability in the human genome. PLoS Genet 8: e1002692 doi:10.1371/journal.pgen.1002692.
10. MolaroA, HodgesE, FangF, SongQ, McCombieWR, et al. (2011) Sperm methylation profiles reveal features of epigenetic inheritance and evolution in primates. Cell 146 : 1029–1041.
11. SigurdssonMI, SmithAV, BjornssonHT, JonssonJJ (2009) HapMap methylation-associated SNPs, markers of germline DNA methylation, positively correlate with regional levels of human meiotic recombination. Genome Res 19 : 581–589.
12. McCarrollSA, KuruvillaFG, KornJM, CawleyS, NemeshJ, et al. (2008) Integrated detection and population-genetic analysis of SNPs and copy number variation. Nat Genet 40 : 1166–1174.
13. The International Schizophrenia Consortium (2008) Rare chromosomal deletions and duplications increase risk of schizophrenia. Nature 455 : 237–241.
14. The Wellcome Trust Case Control Consortium (2010) Genome-wide association study of CNVs in 16,000 cases of eight common diseases and 3,000 shared controls. Nature 464 : 713–720.
15. BaileyJA, BaertschR, KentWJ, HausslerD, EichlerEE (2004) Hotspots of mammalian chromosomal evolution. Genome Biol 5: R23.
16. SheX, HorvathJE, JiangZ, LiuG, FureyTS, et al. (2004) The structure and evolution of centromeric transition regions within the human genome. Nature 430 : 857–864.
17. WeberM, HellmannI, StadlerMB, RamosL, PääboS, et al. (2007) Distribution, silencing potential and evolutionary impact of promoter DNA methylation in the human genome. Nat Genet 39 : 457–466.
18. BrawandD, SoumillonM, NecsuleaA, JulienP, CsárdiG, et al. (2011) The evolution of gene expression levels in mammalian organs. Nature 478 : 343–348.
19. DuncanBK, MillerJH (1980) Mutagenic deamination of cytosine residues in DNA. Nature 287 : 560–561.
20. The International HapMap Consortium (2007) A second generation human haplotype map of over 3.1 million SNPs. Nature 449 : 851–861.
Štítky
Genetika Reprodukční medicínaČlánek vyšel v časopise
PLOS Genetics
2013 Číslo 2
Nejčtenější v tomto čísle
- Complex Inheritance of Melanoma and Pigmentation of Coat and Skin in Grey Horses
- Coordination of Chromatid Separation and Spindle Elongation by Antagonistic Activities of Mitotic and S-Phase CDKs
- Autophagy Induction Is a Tor- and Tp53-Independent Cell Survival Response in a Zebrafish Model of Disrupted Ribosome Biogenesis
- Assembly of the Auditory Circuitry by a Genetic Network in the Mouse Brainstem