
Extensive Divergence of Transcription Factor Binding in Embryos with Highly Conserved Gene Expression
To better characterize how variation in regulatory sequences drives divergence in gene expression, we undertook a systematic study of transcription factor binding and gene expression in blastoderm embryos of four species, which sample much of the diversity in the 40 million-year old genus Drosophila: D. melanogaster, D. yakuba, D. pseudoobscura and D. virilis. We compared gene expression, measured by mRNA-seq, to the genome-wide binding, measured by ChIP-seq, of four transcription factors involved in early anterior-posterior patterning. We found that mRNA levels are much better conserved than individual transcription factor binding events, and that changes in a gene's expression were poorly explained by changes in adjacent transcription factor binding. However, highly bound sites, sites in regions bound by multiple factors and sites near genes are conserved more frequently than other binding, suggesting that a considerable amount of transcription factor binding is weakly or non-functional and not subject to purifying selection.
Published in the journal:
. PLoS Genet 9(9): e32767. doi:10.1371/journal.pgen.1003748
Category:
Research Article
doi:
https://doi.org/10.1371/journal.pgen.1003748
Summary
To better characterize how variation in regulatory sequences drives divergence in gene expression, we undertook a systematic study of transcription factor binding and gene expression in blastoderm embryos of four species, which sample much of the diversity in the 40 million-year old genus Drosophila: D. melanogaster, D. yakuba, D. pseudoobscura and D. virilis. We compared gene expression, measured by mRNA-seq, to the genome-wide binding, measured by ChIP-seq, of four transcription factors involved in early anterior-posterior patterning. We found that mRNA levels are much better conserved than individual transcription factor binding events, and that changes in a gene's expression were poorly explained by changes in adjacent transcription factor binding. However, highly bound sites, sites in regions bound by multiple factors and sites near genes are conserved more frequently than other binding, suggesting that a considerable amount of transcription factor binding is weakly or non-functional and not subject to purifying selection.
Introduction
In the pursuit of the genetic basis of phenotypic evolution, researchers have favored divergence of gene expression as a major source of diversity [1], [2]. Changes in gene expression during animal development can have many origins, but it is widely assumed that the divergence of the enhancer sequences that drive complex spatial and temporal patterns of gene expression during development will play an important role in the evolution of morphology.
Enhancer sequences often undergo rapid changes during evolution [3]–[6], and the binding of transcription factors (TFs) to these and other sequences has been shown to be highly divergent in related species, where, based on functional conservation, little divergence was expected [7]–[14]. While many studies have compared gene expression between species at the genomic scale and reported various degrees of divergence (e.g. [15]–[17]), the downstream effects of TF binding divergence on gene expression has received relatively little attention [18].
One limitation of many of these studies is that significant changes in DNA sequence are often accompanied by extensive changes in morphology or physiology, complicating direct comparison of molecular phenotypes like transcription factor binding and gene expression. This is not, however, the case in Drosophila embryogenesis, which is highly conserved across the 40 million-year old Drosophila genus despite accumulating sequence changes equivalent to those separating different classes of amniotes [19].
To take advantage of this morphological conservation, we measured gene expression and the genome-wide binding of four TFs, namely Bicoid (BCD), Giant (GT), Hunchback (HB) and Krüppel (KR), involved in anterior-posterior (A-P) patterning in blastoderm embryos of four fully-sequenced species - D. melanogaster, D. yakuba, D. pseudoobscura and D. virilis – that span the genus, with divergence times between 5 and 40 million years ago [20] (Figure 1).

Results
Chromatin immunoprecipitation (ChIP) from divergent Drosophila species
We established large populations of D. melanogaster (Oregon R), D. pseudoobscura (MV2-25) and D. virilis (V46) for embryo collections. In our studies of transcription factor binding in D. melanogaster we generally use embryos from one hour collections aged for an additional two hours to target the cellular blastoderm stage [13], [21], [22], during which many key events in patterning occur. Because developmental timing varies between species, we optimized collection conditions for each species to obtain similar stage distributions (Table S1).
We fixed embryos in 1% formaldehyde to cross-link proteins to DNA, and purified chromatin. We immunoprecipitated cross-linked chromatin from all three species using rabbit polyclonal antibodies raised against D. melanogaster Bicoid (BCD), Hunchback (HB), Giant (GT) and Krüppel (KR) [3]–[6], [22]. For each factor, we performed parallel ChIP using antibodies that were purified against recombinant versions of the corresponding D. melanogaster or D. virilis proteins (we were unable to affinity purify GT antisera against D. virilis GT). We used D. virilis proteins to avoid biases due to the recognition of a greater number of epitopes in D. melanogaster than in the more distantly related D. pseudoobscura and D. virilis. Following immunoprecipitation (IP), we sequenced the recovered DNA as well as input controls.
We generated a total of 20 ChIP datasets to which we added eight datasets from our previously published comparison of the binding of these factors in D. melanogaster and the closely related D. yakuba ([13], see Figure S1). We mapped reads to the corresponding genome sequences with Bowtie [23] (mapping statistics given in Table S2), and identified genomic regions significantly bound by each factor in any of the four species using two peak callers, Grizzly Peak [24], [25] and MACS [26]. Roughly similar numbers of peaks were found in each ChIP (Table S3).
To minimize the effect of sample handling variation on the data, several of our ChIPs were carried out on pooled samples containing chromatin from multiple species, so that the IP was carried out in identical conditions. We could unambiguously assign more than 99% of reads to a species after sequencing, and verified that the small fraction of reads that we could not assign with confidence to a specific genome had almost no effect on peak height measurements (Figure S2). Replicates showed good reproducibility, especially for GT and HB IPs (Figure S3). For downstream analyses, we used log-transformed peak height values.
Extensive divergence of transcription factor binding
To compare binding across species, we first aligned the genomes of all four species using Mercator [27] and Pecan [28] and identified orthologous regions present in all four genomes. We then projected the normalized binding intensities of bound regions from all IPs onto the coordinates of the whole-genome alignment and compared occupancy, as illustrated for the even-skipped locus (Figure 2). We obtained 2061 sets of orthologous regions bound by BCD, 4191 by GT, 4986 by HB and 5309 by KR. We also collapsed the 16,547 regions identified as bound by individual transcription factors, and merged them into a common set of 10,137 merged regions, bound by at least one factor in at least one species (see Figure 2). We then computed the occupancy of every factor in each species along each of these regions and compared values between species. Pairwise comparisons showed that binding intensity varies extensively between species (Figure 3A and Figure S4). As expected, the extent of conservation of sites for each factor decreased with increasing phylogenetic distance between species (Figure 3B). Relatively few regions were bound by any factor in all four species (Figure 3C). Overall both quantitative and qualitative comparisons led us to conclude that transcription factor binding has diverged considerably within the Drosophila genus.


Differences of TF-binding motif content partly explain binding divergence
We next compared sequence divergence to binding divergence. We first mapped binding divergence along the six branches of the Drosophila tree (Figure 1), by modeling binding evolution according to a Brownian motion model [29]–[31]. This model is commonly used in evolutionary studies involving continuous quantitative traits [32]–[34] and is based on the hypothesis that a continuous trait (here TF binding) evolves neutrally and follows a Brownian motion from the ancestor to the daughter leaves. This model improves upon pairwise comparisons by taking into account the inherent phylogenetic inertia in our dataset (it corrects for the non-independence of traits due to phylogeny, [30]). We imputed binding values at the three internal nodes on the tree (Figure 1), including the root, and computed changes in binding along each of the six branches of the tree as the difference of binding values between parent and daughter nodes. We then compared these estimates of TF binding divergence to sequence divergence, modeled by the total number of nucleotide substitutions in the sequence of the corresponding bound regions along the tree. We only found a small correlation between binding divergence and overall sequence divergence (Figures 4A and S5).
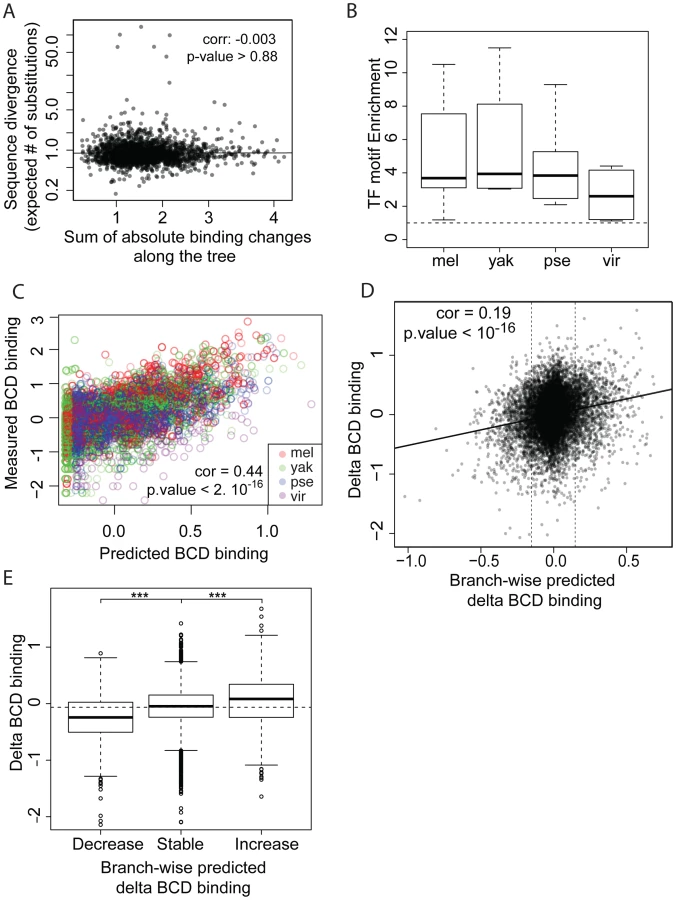
We asked to what extent changes in the motif content of bound regions might account for the observed binding divergence. We first verified whether the TFs exhibited similar DNA binding properties in the different species (Figures 4B–C, S6 and S7), so that we could use the same motif (the known D. melanogaster motif, as established by [22]) to predict TF binding in all bound regions. The different orthologous TFs showed similar DNA affinities, although subtle differences in DNA binding properties could not be ruled out (Figure S6). Binding intensity in the sets of bound regions was then predicted, based solely on motif content and using our previously published thermodynamic model of protein-DNA interactions [35]. Binding predicted from motif content was imputed at the three internal nodes of the tree using the four species-specific binding predictions and a Brownian motion model. We found that changes in predicted binding, based on motif content, were correlated with TF binding changes branch-wise, both quantitatively (Pearson correlation from 0.16 to 0.24, p-value<2.10−16, Figures 4D and S8A–D) and qualitatively (Figures 4E and S8E–H). Overall, these results suggest that changes in binding of BCD, GT, HB and KR are caused in part by changes in the distribution of TF-specific binding sites across the genome.
Binding divergence is correlated between factors and associated with the transcription factor Zelda
We previously observed that the occupancy of the four factors (and others) is highly correlated in D. melanogaster [22], [36], and D. yakuba [13]. We analyzed correlations amongst the binding of all four factors in each species independently or in all species using a principal components analysis of binding for all factors considered together. The first principal component (PC1), that explains the most variation in the data, affected all TFs in the same way in all species as well as in the dataset comprised of the binding data from all species (Figure 5B and S12). In other words the same correlation is present in each species, including in D. pseudoobscura and D. virilis, as well as in the combined dataset from the four species. In D. melanogaster, this axis is highly correlated with the DNA-binding levels of the protein Zelda (Zld) [37] (Figures 5C and S13), in agreement with previous studies showing that the correlation among the binding of different factors is driven by the early binding and chromatin-shaping activities of Zld [1], [2], [22], [25]. Zld is present in the genome of all Drosophila species, its CAGGTAG binding site is enriched in regions bound by A-P factors in all species (Figure 5A), and the distribution of CAGGTAG motifs in bound regions predicts PC1 in all four species (Figure S13B). Overall these different elements suggest that Zld effect on chromatin and transcription factor binding is conserved among Drosophila species.

In addition to correlations in binding of different factors within a single species, we had previously found that changes in the binding of these AP factors were correlated between D. melanogaster and the closely related D. yakuba, and that this correlated divergence was driven by changes in Zld binding sites [1]–[6], [13]. We repeated this analysis on the four species dataset and found that these relationships extend to the entire tree (Figure 5D–E). Although the effect is weaker, it remains significant.
Regions likely to be functional enhancers are more likely to be conserved
We next examined the relationship between peak conservation and three additional factors that are all characteristics of known functional regulatory regions: peak height, location of peak relative to genes, and binding of other factors to the same region [7]–[14], [22], [36], [38]. All three were correlated with peak conservation, as measured by the number of species in which binding was detected (Figures 6A, 6C, 6D), or the variance of binding estimated from the Brownian motion model (Figure 6B). High peaks, located outside coding regions and clustered among several TFs were much better conserved than small, isolated peaks located within coding regions. Of note, these covariates were not independent of each other – higher peaks are more likely to be clustered with peaks for other factors in non-coding regions. This result is independent of the thresholds used for identifying sets of bound regions (Figures S10 and S11). In addition, we found that binding in a set of active regions that function as A-P enhancers was significantly better conserved than in the rest of the genome (Figure S9). These “A-P” regions were composed of known A-P enhancers as well as sequences driving expression along the A-P axis (RedFly database [39]) and some of the sequences highly bound by many early embryonic factors [36] (subsequently dubbed Highly Occupied Target - or HOT - regions by [40]), which function as A-P enhancers in blastoderm embryos [38], [41].

Higher proportion of binding variation explained within species than between species
We applied a simple multiple linear regression model to all of the parameters described above (TF-specific and Zelda motif enrichments, proximity to genes, number of other TFs binding the same locus) and found that, while these factors explain about 29–36% of the variance in binding within each species (Pearson correlations ∼0.6, p-value<2.10−16, Figure S14 A–D), they only explain 3–7% of the variance in TF binding divergence between species (7–21% if phylogenetic inertia is not taken into account, Figure S14 E–L).
mRNA levels are better conserved than TF binding
To investigate how the level of divergence of transcription factor binding affects gene expression, we sequenced mRNA from embryos from each species harvested at the end of cellularization using high-throughput mRNA sequencing (mRNA-seq). The reference annotations (Flybase) in non-D. melanogaster species are of lower quality (e.g. the annotated D. yakuba, D. pseudoobscura and D. virilis transcriptomes cover ∼22.7, 23.5 and 21.8 millions nucleotides, respectively, compared to 31 millions for D. melanogaster when similar sizes are expected). As this quality difference may induce biases in our analyses, we first refined the reference annotations for the non-melanogaster species. For this, we used the RABT program from cufflinks (option –g, [42]) and mRNA-seq data from pools of ∼50 embryos spanning the same stages used in the ChIP experiments. This method builds on an existing annotation and mRNA-seq data to discover novel transcripts. The number of genomic nucleotides covered by the annotations, increased by 17%, 19% and 24% for D. yakuba, D. pseudoobscura and D. virilis, respectively, and are more similar to D. melanogaster values (Table S4). We used these new annotations plus the D. melanogaster reference annotation for subsequent experiments.
We conducted mRNA-seq experiments on several individuals from each species and restricted our analyses to the 8,555 protein-coding genes for which we could identify orthologs present exactly once in all four species using our genome alignment. As for ChIP experiments, log-transformed values were normalized so that median was null before further comparisons of levels of gene expression. We found that mRNA levels are highly correlated between species (Figure 7A), with the correlation decaying with phylogenetic distance (Figure 7B). In addition, overall divergence of mRNA levels was significantly lower than divergence of any TF's binding, as measured by the variance of normalized data along the Drosophila tree (Figure 7C).

The magnitude of this difference should be interpreted with some caution, however, as ChIP is intrinsically noisier than mRNA-seq (correlations of ChIP replicates ranging from 0.45 to 0.91 with a median at 0.81 vs correlation of mRNA-seq replicates ranging from 0.95 to 0.98 with a median at 0.97) and involves using reagents, such as anti-TF antisera, that could have subtle differences in activity among divergent fruit fly species, which may introduce some additional variance relative to actual differences in binding.
TF binding divergence is poorly correlated with divergence of mRNA levels
To compare variation in transcription factor binding to variation in gene expression on a gene-by-gene basis, we matched each gene to the closest region bound by the highest number of different TFs (one of the 10,137 merged regions), recognizing that some of these associations were likely to be incorrect. We focused on the 4,846 genes that were annotated in all four species and expressed in at least one of them. Of these, 3,024 could be associated with nearby binding of at least one transcription factor in one species. We partitioned genes depending on whether transcripts in D. melanogaster blastoderm embryos were deposited by the mother into the egg, or were a product of zygotic transcription, as defined by [43]: 2,056 genes were categorized as “maternal”, 388 as “zygotic” and 394 as “both maternal and zygotic” as they are both deposited by the mother and transcribed by the zygote; the 186 remaining genes were not categorized.
We analyzed for each gene the relationship between mRNA levels and nearby TF binding. TF binding, and especially strong and clustered binding, was preferentially localized near zygotic genes (Figure 7D). We found a positive correlation between measured mRNA levels of zygotic genes and mRNA levels predicted solely by a multiple linear regression of associated nearby TF binding (Pearson correlations within each species ranged from 0.42 to 0.5. Using combined data from all species, correlation is 0.46, p-values<10−16, Figure 7E). Within a species, 17% to 23% of the variance in mRNA levels could be attributed, by multiple linear regression, to variance in levels of associated TF binding. Association between mRNA levels and nearby TF binding for maternally deposited genes was comparatively much weaker and intermediate for “maternal/zygotic” genes (Figure S15). This result is coherent with the known role of TFs as transcriptional regulators of zygotic gene expression but not of maternal gene expression.
Despite this relatively good relationship between TF binding and gene expression within a species, we found a weak relationship between variation in TF binding and gene expression along the tree (Figure 7F). Using multiple linear regression we found that trans-species variation of mRNA levels is positively correlated with trans-species variation in associated TF binding (Pearson correlation ∼0.16, p-value<10−16), but only ∼2% of variance in mRNA levels could be attributed to variation in TF binding for zygotic genes (3% if phylogenetic inertia is not taken into account, Figure S16). In contrast, divergence of mRNA levels for maternal genes was not correlated with changes of associated TF binding, suggesting that the effect seen for zygotic genes, although weak, is of biological significance. Accordingly, binding of A-P factors near zygotic genes is better conserved than near maternal genes (Figure S17). We finally compared the expression pattern for three genes displaying exhaustive changes in associated TF binding. We selected zygotic genes displaying a known A-P pattern and high levels of associated TF binding in D. melanogaster but comparatively much lower levels of binding in at least another species. For two out of three cases, we found changes of expression along the A-P axis correlated with binding changes (Figures S18, S19, S20).
Discussion
This study addresses both the genomic causes and the consequences on gene expression of TF binding divergence. We found that the genomic binding of A-P factors has changed extensively along the Drosophila tree with little effect on downstream gene expression. We identified two potential genetic sources of binding divergence. First, we found that alterations of BCD, HB, GT and KR-specific motifs drive a portion of the binding divergence. This was previously found for other TFs [7], [10], [12], [13], [44], [45], though our study is among the first to quantify this effect. We found that the A-P factors are undergoing correlated evolution among themselves (Figures 5D and 6D) and potentially with the protein Zelda (Figure 5E), pointing to the importance of cis-acting sites beyond target sites for the factors themselves in binding divergence.
Given the high degree of morphological stability amongst these four species, we predicted and observed highly conserved embryonic gene expression – for both maternal and zygotic genes. Yet, conservation of gene expression was not coupled with conservation of genome-wide transcription factor binding.
One relatively simple explanation is that our measurements of transcription factor binding are more subject to systematic biases and noise, since ChIP experiments are generally less robust than mRNA-seq and involve species-specific reagents. The inherent experimental noise of ChIP experiments will thus lead to overestimating binding divergence, although it is difficult to quantify its contribution. This said, we believe our conclusions are robust to ChIP noise, if only because the same conclusions were drawn from ChIPs of different qualities (GT and HB ChIPs were the best datasets whereas BCD and KR ChIPs showed lower enrichment and reproducibility, Figure S3). It is also possible that, even though we carefully optimized embryo collections to account for the different development times of the species, we may not have perfectly matched stage sampling between species. However, the divergence of TF binding we observe is in line with most genome-wide comparisons of TF binding, including in Drosophila [7]–[10], [12], [14], [46], although these studies also face the same limitations that ours does. Our recovery of motif signals for BCD, GT, HB and KR in their bound regions, and ZLD in all of them, argues against extreme levels of noise in the data. Overall some of the difference in divergence (Figure 7C) undoubtedly originates from both the different nature and means of measurement of TF binding and gene expression.
Our interpretation of extensive binding divergence of A-P factors contrasts somewhat with a recent comparison of the binding of the dorsal-ventral patterning factor Twist [47]. He et al. found that 34% of the regions bound by Twist in D. melanogaster are also bound in five species ranging from the closely related D. simulans to the more distant D. pseudoobscura, leading the authors to claim that Twist binding was highly conserved. In comparison, we find that 28%, 38%, 23% and 15%, of BCD, GT, HB and KR regions bound in D. melanogaster are also bound in D. yakuba and D. pseudoobscura, which correspond to roughly similar levels of binding conservation. Thus we differ primarily in whether the finding that only one of three bound regions found in D. melanogaster are conserved constitutes a high degree of conservation. More interestingly, the Twist study confirmed our results that functional binding is more constrained than seemingly non functional binding since clustered Twist binding and binding near target genes were better conserved [47].
Perhaps the strongest argument that the overall low levels of conservation we observe is real is that we observe strong conservation for the subset of bound regions that are most likely to be functional. This suggests, unsurprisingly, that there is strong purifying selection to maintain binding in functional regions. But it also demonstrates that we can detect strong conservation when it is there, with the corollary that the regions we observe to be divergent are likely to really be divergent. That two thirds of the regions bound by any of the four TFs we examined are poorly conserved and thus are probably under weak or no purifying selection supports the emerging view that a large fraction of measureable biochemical events are not functional (in contrast to claims made by ENCODE [48]). We note, however, that strong selection to maintain binding does not require conservation of individual binding sites [45], [49]–[53] There is also evidence that even within highly conserved regulatory networks, differences in embryo size and other factors necessitate constant tuning of enhancer activities, with corresponding adjustments in the strength and organization of TF binding sites [54]. Unfortunately, the ChIP data we report here lacks sufficient resolution to see the turnover of individual binding events. New techniques like ChIP-exo [55] enable much higher resolution moving forwards, and the growing repertoire of sequenced and experimentally tractable Drosophila species should allow us to study turnover at both the sequence and binding level with much more precision.
Methods
Antibodies used for ChIP
We used rabbit polyclonal antibodies raised against the D.melanogaster versions of the key A-P regulators Bicoid (BCD), Hunchback (HB), Giant (GT) and Krüppel (KR) that had been produced in a previous study [22]. They were affinity purified either against the D.melanogaster version of the proteins (recognizing the largest set of epitopes), or against the most distantly related version from D.virilis (recognizing the most highly conserved epitopes). The different proteins are high
ly conserved throughout the Drosophila gender (69%, 87%, 76% and 70% aminoacid identity between D.melanogaster and D.virilis BCD, HB, GT and KR epitopes, respectively), allowing an excellent cross-reactivity of the serum against proteins from all species.
Embryo collections for ChIP
We collected embryos spanning early cellularization process (end of stage 4 to mid stage 5), during which the regulatory events that initiate segmentation along the A-P axis take place. Because the developmental speeds and optimal growth temperatures vary between species, the collection conditions were optimized for each species (Table S1). Embryos from all species were processed either for mRNA-seq, as described below, or for ChIP-seq (except D.yakuba), according to the protocol described below. In addition, we collected single embryos for each species, at the end of cellularization, just prior to gastrulation, based on morphological criteria, homogenized the embryos in TRIzol (Life Technologies) and processed the samples for DNA and total RNA extraction, as described below.
In Vivo formaldehyde cross-linking of D.melanogaster, D.pseudoobscura and D.virilis embryos, followed by chromatin immunoprecipitation
Embryos were collected as described above and fixed with formaldehyde. The chromatin was isolated through CsCl gradient ultracentrifugation as previously described [22].
The chromatin used for immunoprecipitation was fragmented through sonication using a Bioruptor to an average fragment size of 180 bp. After sonication ChIP was carried out using affinity purified rabbit polyclonal antibodies directed against large parts of BCD, HB, GT or KR, and prepared as described above: antibodies affinity-purified against the D.melanogaster epitope [22] or against the D.virilis orthologous parts of the D.melanogaster epitopes (for BCD, HB and KR). Both sets of antibodies essentially give similar results (GT and HB giving the most reproducible results), although the D.virilis-specific antibodies were less efficient, as expected since they recognize the smaller set of conserved epitopes compared to the other ones (lower signal over noise ratio) (see Figure S3 for qualitative and quantitative comparison of replicates). Some samples from D.melanogaster, D.pseudoobscura and D.virilis (labeled with an asterisk in Figure S1) were pooled prior to immunoprecipitation, in order to minimize variation due to sample handling and protocol adherence.
The DNA libraries for sequencing were prepared from the ChIP reaction and from Input DNA following the Illumina protocol for preparing samples for ChIP sequencing of DNA. All library amplifications were carried out by 15 cycles of PCR. After the amplification step, we size-selected DNA fragments of 190–290 bp. Library quality, fragment size, and concentration were measured as described for mRNA-seq. Libraries were sequenced on a GAIIx or HiSeq 2000 Illumina sequencer.
mRNA-seq library preparation
Individual embryos from late stage 5 were chosen for RNA extraction based on morphology (having completed cellularization), which allows for sampling of homologous stages across species. Embryo sampling was performed as described in [43]. Libraries were then made from total RNA of 6 individuals of each species, for a total of 24 libraries, using the mRNA TruSeq kit from Illumina, following the manufacturer's instructions. Size distribution of the library fragments was checked on a Bioanalyzer (Agilent) using the high sensitivity kit, and library concentration was measured by QPCR using Kapa Biosystems PCR kits for Illumina sequencing libraries, according to the manufacturer's instruction. Libraries were sequenced in 2 lanes (12 libraries per lane) using an Illumina HiSeq sequencer. mRNA levels were later averaged over the 6 individuals from the same species.
In parallel, pools of embryos spanning the end of stage 4 to mid stage 5 were collected (see Table S1). After RNA extraction, samples were processed for library preparation, as described above and paired-end libraries were sequenced on an Illumina GaIIx. These samples were only used for modifications of annotations (see below and Table S4).
Genome versions and mapping sequenced tags to genomes
We used the Apr. 2006 assembly (Flybase Release 5) of the D. melanogaster genome, the February 2006 assembly (Flybase release 2) of the D.pseudoobscura genome and the February 2006 assembly (Flybase release 1) of the D.virilis genome.
The D.yakuba data as well as some of the D.melanogaster dataset were previously published [13].
We trimmed all sequenced tags so that their average quality was above 30 and mapped the tags to the genomes using Bowtie v0.12.7 [23] with command-line options ‘-v 1 -m 1’ for small reads (length below 35 bp) and ‘-v 1 –m 3 for long reads (length above 70 bp), thereby keeping only tags that mapped uniquely to the genome with at most one or three mismatch. For ChIP-seq experiments using chromatin pooled from several species, we used only reads that could be unambiguously assigned to a single species. To this end, reads were separately mapped to each genome sequence and the reads that mapped to several genomes were discarded. Reads that mapped better to a genome sequence in particular (with at least 2 mismatch differences), were recovered in a second time. More than 99% of the reads could unambiguously mapped to a genome sequence. Overall pooling had very limited effect on downstream read mapping because these species are distantly related, and only a handful of regions were affected by pooling (Figure S2).
Peak calling
ChIP data was parsed independently for each experiment using two separate peak callers. First, we used MACS (version 1.4) [26], with the following parameter “-g dm –off-auto –nomodel –pvalue = 1e-2” and “–shiftsize = 110 –mfold = 10,10000 –slocal = 2000 –llocal = 20000” or “ –shiftsize = 60 –mfold = 4,10000” depending on the length distribution for DNA fragment sizes prior to sequencing. We also called peaks using Grizzly Peak fitting program [24], [25] with estimated DNA fragment length of 150 or 250.
We then intersected the two sets of peaks, and filtered out all peaks not supported by both methods. To account for low complexity peaks and possible PCR artifacts, we further removed peaks with negative correlation (<−0.1) among the Forward and Reverse reads, peaks where 60% of the reads mapped to less than 1% of the positions, and peaks whose height was less than three times the height of Input reads in the same locus.
We took as an initial dataset the union of all bound regions in the different replicates. Roughly similar numbers of peaks were identified in each species (Table S3), except in the case of D.pseudoobscura that displayed less BCD, GT and KR peaks, potentially partly due to coverage differences on the Müller element E, fused to the X chromosome in the Pseudoobscura group [5], [56].
Whole-genome alignment and orthology comparisons
To produce the 4-species whole genome alignment, we followed the general guide-line described in [57]. We used a large-scale orthology mapping created by Mercator [27] with the option to identify syntenic regions of the genomes. Each region was then aligned with Pecan [28] with the default options.
Establishing the set of bound regions from a 4-way genome alignment
Bound regions were considered orthologous according to the following pair-wise rule: bound regions in two different species are considered orthologous if they share a non-null intersection on the alignment (see Figure 2). Regions were removed from the analysis based on quality check: (i) Clusters that displayed a genomic length variability above five fold between any two species were considered to have an unreliable alignment, (ii) clusters for which less than 80% of genomic length from any species could be unambiguously mapped on the sequence were considered to have too ambiguous occupancy values and (iii) sets of orthologous peaks comprised of a small peak (normalized value below 0.7) in only one of the seven replicates were considered to be too uncertain.
For each region, TF occupancy was obtained as the mean maximum occupancy (at the log-scale) between replicates in each species-specific ChIP. Datasets were then centered so that median was null.
We adopted a conservative approach when comparing binding between species: we used 2 different thresholds for calling a region “bound” and a peak “not conserved”. We used a relatively high threshold for calling a set of orthologous bound regions (ie to look at the region) and we used a lower threshold to call peaks in this region so that a high peak and a low peak are more likely to be both called and thus considered conserved. This method allows us to minimize false-positive peak calling (that is likely to be divergent), and maximize conservation call. Our results were independent from the high threshold: we also repeated some of our analyses using different thresholds for calling sets (but keeping the same low threshold for determining binding conservation), with similar results (Figures S10 and S11).
Inference of sequence divergence under bound regions
Alignments of the sequences corresponding to the sets of 2061, 4191, 4986 and 5309 orthologous regions bound by BCD, GT, HB and KR in at least one species were retrieved from the four species genome alignment. A phylogenetic tree was built per set using PhyML [58] with the parameters -m gtr -v e -t e -c 4 -a e -f m -d nt -o lr –quiet and the input topology (mel:0.119585, yak:0.13237, (pse:0.53, vir:1.0325):0.71552); obtained from the Drosophila genome project. Sequence divergence was measured as the total number of substitutions, and given by the total length of each output phylogenetic tree.
Clustering of bound regions
The peaks called for every ChIP were further clustered, based on their mapping to the four-way alignment of the genomes. Overlapping peaks for the same TF over two or more species were merged.
Motif enrichment analyses
To support the binding data, we analyzed the sequences of bound regions, and calculated the enrichment of each factor's motif. For every ChIP experiment (namely, every species/TF), we analyzed the bound regions using our previously published thermodynamic model of protein-DNA interactions [35]. For simplicity, we used fixed PWMs of BCD, GT, HB, KR and Zld from D. melanogaster for all four species [25], [35] (BCD, GT, HB and KR motifs are displayed on top of Figure S6). Similar results and PWMs, were obtained when allowing for species-specific or experiment-specific optimization of PWM for each AP factor.
Average motif enrichments displayed on Figures 4B and 5A were measured on the top 250 peaks. Motif enrichment displayed in Figure S6 was measured as follows: for every bound region, we estimated the sequence-based probability of binding along every position. We then aligned these 500 top regions for each experiment based on the strongest site, and calculated the average predictions over surrounding windows of −500 to +500. As control, we repeated this analysis over the same loci, but used shuffled versions of the PWMs. Specifically, we first shuffled the positions of each PWM, then shuffled the nucleotides per position.
Reference annotation based transcript assembly and estimation of mRNA levels using D.melanogaster, D.yakuba, D.pseudoobscura and D.virilis mRNAseq data
Reads were mapped to the genomes using tophat [59]. Refined annotations of D. yakuba, D. pseudoobscura and D. virilis were based on the reference annotations (Flybase releases 1.3, 2.22 and 1.2 respectively) and mRNA-seq data obtained from pools of embryos. The reference annotations and mapped reads were given as inputs to cufflinks (version 1.0.3) [42] with the options –g and ‘–3-overhang-tolerance 300’. Statistics on the new annotations are given in Table S4.
mRNA measurements were obtained as follows: reads from single-embryo mRNA-seq were mapped to the genome sequence using tophat and mRNA levels were estimated using cufflinks [60] and the above refined annotations (except D. melanogaster samples for which the reference annotation was used).
Orthology assignment between genes of different species
Orthology assignment between genes was established based on the whole-genome alignment: genes were considered orthologous if the coordinates of their exons intersect more than 40% of their total length and if their orientation is the same (or unknown). Because this method is genome-alignment based, it takes into account both sequence similarity and synteny, thus favoring ortholog over paralog association. We removed from the analysis genes that showed orthology inconsistencies (e.g. genes with different orthologs in different species).
Association between genes and regions bound by TFs
We associated TF binding and genes according to the following rule: we associated with each gene one of the 10,137 the merged regions (defined as the union of regions bound by any of the 4 TFs) located within 10,000 bp from the gene and bound by the biggest number of TF over all four species. So a gene is always associated with a nearby region bound by 0 (if no TF bound within 10,000 bp from the gene) to all four TFs in any species.
Reconstruction of ancestral values of TF binding and mRNA levels
Ancestral values were reconstructed according to a Brownian motion model [29] using the R package ape (function “ace”). Under a Brownian motion model, continuous characters evolve randomly following a random walk. The values at the three internal nodes, including the root, as well as values of binding variance were obtained for each cluster.
Quantitative divergence along the tree was estimated from the changes occurring along the six branches of the tree. It was calculated as the differences between the seven nodes of the tree (four leaves and three internal nodes). This estimation explicitly takes phylogenetic inertia into account. We also made six simpler pairwise comparisons between the four leaves, which do not take phylogenetic inertia into account, and thus do not make any assertion about phylogenetic processes.
Before comparing the variance of TF binding and mRNA levels according to a Brownian motion model (Figure 7C only), we scaled the normalized values with their standard deviation. We then used these scaled normalized values to reestimate maximum likelihood parameters of the model.
Principal component analyses
The Principal component analyses were conducted on the concatenate of TF occupancies in the 4 species, so that the results from the different components would be comparable between species. Note that no axis seemed to be correlated with species-specific differences. As a control, we also performed a PCA on species-specific data and axes were very similar to the axes from the trans-species PCA, especially for the first axis. Correlation between TF occupancy values projected on PC1 from the global PCA and from species specific PCAs were above 0.99 for each species and were above 0.77 for the 3 other axes. The measurements of the contribution of each of the PC axes to within or between species TF variation were obtained from a multiple linear regression of TF binding on the different axes of the PCA.
Linear regressions to predict TF binding and mRNA levels
We used multiple linear regression to model TF binding and TF binding divergence from associated factors such as TF-specific and Zelda motif enrichments, proximity to genes and the number of TFs bound to a locus. mRNA levels were modeled from associated BCD, GT, HB and KR binding.
To obtain the variance of TF binding explained by motif content, we fitted a linear regression of motif content for any TFi at any locus j in species s, using the R [61] function “lm” (default “stats” package) and the formula:

We also predicted binding using more parameters (Figure S14A–D) including motif content. We fitted a multiple linear regression of these parameters for any TFi using the formula:

Similarly, to obtain the variance of mRNA levels explained by the variance of TF binding intensity at the region associated with each gene, we fitted a multiple linear model of TF binding to mRNA levels using the function “lm” and the formula:

Establishment of the list of A-P enhancers
We built the set of A-P enhancers used in Figure S9 from three sources: we included known A-P enhancers (as defined by [13]) and we screened by eye and included the regions from the RedFly database and the HOT regions [38] that drive the expression of a reporter gene along the A-P axis. The list of included regions is included as Table S5. Note that many regions overlap on the genome because the difference databases are redundant.
Embryo collection and fixation for in situ hybridizations
Collection, fixation and prehybridization were performed as described in [62]. D. melanogaster, D. yakuba, D. pseudoobscura and D. virilis embryos were raised at 25°C for all species but D. virilis for which embryos were raised at 20°C. Embryos were collected for 1 h30, 2 h, 2 h30 and 4 h and then aged for 1 h30, 1 h30, 2 h and 4 h, respectively. Embryos were then dechorionated in 50% bleach for 2 minutes, washed with milliQ water, and fixed for 25 minutes in a fixation solution (50% heptane, 4% formaldehyde, 0.5× PBS, 25 mM EGTA pH 8) with vigorous shaking. Embryos were devitellized by vigorously shaking in 1∶1 heptane/cold methanol solution for 1 minute, and then rinsed three times with methanol and stored at −20°C.
Probe synthesis and in situ hybridizations
Species-specific probes were designed to match the same gene part in each species. Otd probe was ∼1000 nt long and matched the 5′UTR part of the gene. l(3)83Fd probe was ∼1200 nt long and matched the last four exons of the gene. Finally CG13894 RNA probe was ∼1500 nt long and matched the full-length gene.
RNA probes were synthesized as previously described with a few differences [63]. Probes were cloned by PCR amplification using cDNA prepared from mRNA extracted as described above. PCR products were closed into TOPO II and sequence verified. Probes were carbonate-treated. Primers used for cloning are listed in Table S6.
Before in situ hybridization, embryos were dehydrated in an ethanol series and soaked for one hour in xylene before three additional ethanol washes. Embryos were then post-fixed in three methanol washes and processed and mounted as described in [62]. Embryos were imaged and photographed using a Nikon Eclipse 80i microscope, with a Nikon DS-UI camera, and the NIS Elements F 2.20 software.
Data availability
All reads will be made available at the NCBI GEO at the time of publication. Accession numbers and additional files are available at www.eisenlab.org/mparis. We thank Mark D. Biggin and Robert K. Bradley for their help in the initial phase of the project, as well as members of the Eisen lab for fruitful discussions and suggestions. We also thank the reviewers and the editor for their useful comments.
Supporting Information
Zdroje
1. KingMC, WilsonAC (1975) Evolution at two levels in humans and chimpanzees. Science 188 : 107–116.
2. CarrollSB (2008) Evo-devo and an expanding evolutionary synthesis: a genetic theory of morphological evolution. Cell 134 : 25–36 doi:10.1016/j.cell.2008.06.030
3. LudwigMZ, KreitmanM (1995) Evolutionary dynamics of the enhancer region of even-skipped in Drosophila. Mol Biol Evol 12 : 1002–1011.
4. MosesAM, PollardDA, NixDA, IyerVN, LiX-Y, et al. (2006) Large-scale turnover of functional transcription factor binding sites in Drosophila. PLoS Comput Biol 2: e130 doi:10.1371/journal.pcbi.0020130
5. RichardsS, LiuY, BettencourtBR, HradeckyP, LetovskyS, et al. (2005) Comparative genome sequencing of Drosophila pseudoobscura: chromosomal, gene, and cis-element evolution. Genome research 15 : 1–18 doi:10.1101/gr.3059305
6. BalhoffJP, WrayGA (2005) Evolutionary analysis of the well characterized endo16 promoter reveals substantial variation within functional sites. Proc Natl Acad Sci USA 102 : 8591–8596 doi:10.1073/pnas.0409638102
7. SchmidtD, WilsonMD, BallesterB, SchwaliePC, BrownGD, et al. (2010) Five-vertebrate ChIP-seq reveals the evolutionary dynamics of transcription factor binding. Science 328 : 1036–1040 doi:10.1126/science.1186176
8. OdomDT, DowellRD, JacobsenES, GordonW, DanfordTW, et al. (2007) Tissue-specific transcriptional regulation has diverged significantly between human and mouse. Nat Genet 39 : 730–732 doi:10.1038/ng2047
9. BornemanAR, GianoulisTA, ZhangZD, YuH, RozowskyJ, et al. (2007) Divergence of transcription factor binding sites across related yeast species. Science 317 : 815–819 doi:10.1126/science.1140748
10. NiX, ZhangYE, NègreN, ChenS, LongM, et al. (2012) Adaptive evolution and the birth of CTCF binding sites in the Drosophila genome. PLoS Biol 10: e1001420 doi:10.1371/journal.pbio.1001420
11. ZhengW, ZhaoH, ManceraE, SteinmetzLM, SnyderM (2010) Genetic analysis of variation in transcription factor binding in yeast. Nature 464 : 1187–1191 doi:10.1038/nature08934
12. KasowskiM, GrubertF, HeffelfingerC, HariharanM, AsabereA, et al. (2010) Variation in transcription factor binding among humans. Science 328 : 232–235 doi:10.1126/science.1183621
13. BradleyRK, LiX-Y, TrapnellC, DavidsonS, PachterL, et al. (2010) Binding Site Turnover Produces Pervasive Quantitative Changes in Transcription Factor Binding between Closely Related Drosophila Species. PLoS Biol 8: e1000343 doi:10.1371/journal.pbio.1000343
14. WilsonMD, Barbosa-MoraisNL, SchmidtD, ConboyCM, VanesL, et al. (2008) Species-specific transcription in mice carrying human chromosome 21. Science 322 : 434–438 doi:10.1126/science.1160930
15. McmanusCJ, CoolonJD, DuffMO, Eipper-MainsJ, GraveleyBR, et al. (2010) Regulatory divergence in Drosophila revealed by mRNA-seq. Genome research 20 : 816–825 doi:10.1101/gr.102491.109
16. BrawandD, SoumillonM, NecsuleaA, JulienP, CsárdiG, et al. (2011) The evolution of gene expression levels in mammalian organs. Nature 478 : 343–348 doi:10.1038/nature10532
17. KalinkaAT, VargaKM, GerrardDT, PreibischS, CorcoranDL, et al. (2010) Gene expression divergence recapitulates the developmental hourglass model. Nature 468 : 811–814 doi:10.1038/nature09634
18. TiroshI, WeinbergerA, BezalelD, KaganovichM, BarkaiN (2008) On the relation between promoter divergence and gene expression evolution. Mol Syst Biol 4 : 159 doi:10.1038/msb4100198
19. LinMF, DeorasAN, RasmussenMD, KellisM (2008) Performance and scalability of discriminative metrics for comparative gene identification in 12 Drosophila genomes. PLoS Comput Biol 4: e1000067 doi:10.1371/journal.pcbi.1000067
20. RussoCA, TakezakiN, NeiM (1995) Molecular phylogeny and divergence times of drosophilid species. Mol Biol Evol 12 : 391–404.
21. LiX-Y, ThomasS, SaboPJ, EisenMB, StamatoyannopoulosJA, et al. (2011) The role of chromatin accessibility in directing the widespread, overlapping patterns of Drosophila transcription factor binding. Genome Biol 12: R34 doi:10.1186/gb-2011-12-4-r34
22. LiX-Y, MacArthurS, BourgonR, NixD, PollardDA, et al. (2008) Transcription factors bind thousands of active and inactive regions in the Drosophila blastoderm. PLoS Biol 6: e27 doi:10.1371/journal.pbio.0060027
23. LangmeadB, TrapnellC, PopM, SalzbergSL (2009) Ultrafast and memory-efficient alignment of short DNA sequences to the human genome. Genome Biol 10: R25 doi:10.1186/gb-2009-10-3-r25
24. CapaldiAP, KaplanT, LiuY, HabibN, RegevA, et al. (2008) Structure and function of a transcriptional network activated by the MAPK Hog1. Nat Genet 40 : 1300–1306 doi:10.1038/ng.235
25. HarrisonMM, LiX-Y, KaplanT, BotchanMR, EisenMB (2011) Zelda binding in the early Drosophila melanogaster embryo marks regions subsequently activated at the maternal-to-zygotic transition. PLoS Genet 7: e1002266 doi:10.1371/journal.pgen.1002266
26. ZhangY, LiuT, MeyerCA, EeckhouteJ, JohnsonDS, et al. (2008) Model-based analysis of ChIP-Seq (MACS). Genome Biol 9: R137 doi:10.1186/gb-2008-9-9-r137
27. Dewey CN (2006) Whole-genome alignments and polytopes for comparative genomics. GRADUATE DIVISION of the UNIVERSITY OF CALIFORNIA, BERKELEY.
28. PatenB, HerreroJ, BealK, FitzgeraldS, BirneyE (2008) Enredo and Pecan: genome-wide mammalian consistency-based multiple alignment with paralogs. Genome research 18 : 1814–1828 doi:10.1101/gr.076554.108
29. FelsensteinJ (1973) Maximum-likelihood estimation of evolutionary trees from continuous characters. Am J Hum Genet 25 : 471–492.
30. FelsensteinJ (1985) Phylogenies and the comparative method. American Naturalist 125 : 1–15.
31. MartinsEP, GarlandTJr (1991) Phylogenetic analyses of the correlated evolution of continuous characters: a simulation study. Evolution 45 : 534–557.
32. MattilaTM, BokmaF (2008) Extant mammal body masses suggest punctuated equilibrium. Proc Biol Sci 275 : 2195–2199 doi:10.1098/rspb.2008.0354
33. ChaixR, SomelM, KreilDP, KhaitovichP, LunterGA (2008) Evolution of primate gene expression: drift and corrective sweeps? Genetics 180 : 1379–1389 doi:10.1534/genetics.108.089623
34. BedfordT, HartlDL (2009) Optimization of gene expression by natural selection. Proc Natl Acad Sci USA 106 : 1133–1138 doi:10.1073/pnas.0812009106
35. KaplanT, LiX-Y, SaboPJ, ThomasS, StamatoyannopoulosJA, et al. (2011) Quantitative models of the mechanisms that control genome-wide patterns of transcription factor binding during early Drosophila development. PLoS Genet 7: e1001290 doi:10.1371/journal.pgen.1001290
36. MacArthurS, LiX-Y, LiJ, BrownJB, ChuHC, et al. (2009) Developmental roles of 21 Drosophila transcription factors are determined by quantitative differences in binding to an overlapping set of thousands of genomic regions. Genome Biol 10: R80 doi:10.1186/gb-2009-10-7-r80
37. HarrisonPW, WrightAE, MankJE (2012) The evolution of gene expression and the transcriptome-phenotype relationship. Semin Cell Dev Biol 23 : 222–229 doi:10.1016/j.semcdb.2011.12.004
38. KvonEZ, StampfelG, Yáñez-CunaJO, DicksonBJ, StarkA (2012) HOT regions function as patterned developmental enhancers and have a distinct cis-regulatory signature. Genes Dev 26 : 908–913 doi:10.1101/gad.188052.112
39. GalloSM, GerrardDT, MinerD, SimichM, Soye DesB, et al. (2011) REDfly v3.0: toward a comprehensive database of transcriptional regulatory elements in Drosophila. Nucleic Acids Res 39: D118–D123 doi:10.1093/nar/gkq999
40. modENCODE Consortium (2010) RoyS, ErnstJ, KharchenkoPV, KheradpourP, et al. (2010) Identification of functional elements and regulatory circuits by Drosophila modENCODE. Science 330 : 1787–1797 doi:10.1126/science.1198374
41. FisherWW, LiJJ, HammondsAS, BrownJB, PfeifferBD, et al. (2012) DNA regions bound at low occupancy by transcription factors do not drive patterned reporter gene expression in Drosophila. Proc Natl Acad Sci USA 109 : 21330–21335 doi:10.1073/pnas.1209589110
42. RobertsA, PimentelH, TrapnellC, PachterL (2011) Identification of novel transcripts in annotated genomes using RNA-Seq. Bioinformatics 27 : 2325–9 doi:10.1093/bioinformatics/btr355
43. LottSE, villaltaJE, SchrothGP, LuoS, TonkinLA, et al. (2011) Noncanonical Compensation of Zygotic X Transcription in Early Drosophila melanogaster Development Revealed through Single-Embryo RNA-Seq. PLoS Biol 9: e1000590 doi:10.1371/journal.pbio.1000590
44. HeQ, BardetAF, PattonB, PurvisJ, JohnstonJ, et al. (2011) High conservation of transcription factor binding and evidence for combinatorial regulation across six Drosophila species. Nat Genet 43 : 414–420 doi:doi:10.1038/ng.808
45. SpivakovM, AkhtarJ, KheradpourP, BealK, GirardotC, et al. (2012) Analysis of variation at transcription factor binding sites in Drosophila and humans. Genome Biol 13: R49 doi:10.1186/gb-2012-13-9-r49
46. ConboyCM, SpyrouC, ThorneNP, WadeEJ, Barbosa-MoraisNL, et al. (2007) Cell cycle genes are the evolutionarily conserved targets of the E2F4 transcription factor. PLoS ONE 2: e1061 doi:10.1371/journal.pone.0001061
47. HeQ, BardetAF, PattonB, PurvisJ, JohnstonJ, et al. (2011) High conservation of transcription factor binding and evidence for combinatorial regulation across six Drosophila species. Nat Genet 43 : 414–420 doi:10.1038/ng.808
48. HarrowJ, FrankishA, GonzalezJM, TapanariE, DiekhansM, et al. (2012) GENCODE: the reference human genome annotation for The ENCODE Project. Genome research 22 : 1760–1774 doi:10.1101/gr.135350.111
49. LudwigMZ, PatelNH, KreitmanM (1998) Functional analysis of eve stripe 2 enhancer evolution in Drosophila: rules governing conservation and change. Development 125 : 949–958.
50. LudwigMZ, PalssonA, AlekseevaE, BergmanCM, NathanJ, et al. (2005) Functional evolution of a cis-regulatory module. PLoS Biol 3: e93 doi:10.1371/journal.pbio.0030093
51. LudwigMZ, BergmanC, PatelNH, KreitmanM (2000) Evidence for stabilizing selection in a eukaryotic enhancer element. Nature 403 : 564–567 doi:10.1038/35000615
52. SwansonCI, SchwimmerDB, BaroloS (2011) Rapid evolutionary rewiring of a structurally constrained eye enhancer. Curr Biol 21 : 1186–1196 doi:10.1016/j.cub.2011.05.056
53. HareEE, PetersonBK, IyerVN, MeierR, EisenMB (2008) Sepsid even-skipped enhancers are functionally conserved in Drosophila despite lack of sequence conservation. PLoS Genet 4: e1000106 doi:10.1371/journal.pgen.1000106
54. CrockerJ, TamoriY, ErivesA (2008) Evolution acts on enhancer organization to fine-tune gradient threshold readouts. PLoS Biol 6: e263 doi:10.1371/journal.pbio.0060263
55. RheeHS, PughBF (2011) Comprehensive genome-wide protein-DNA interactions detected at single-nucleotide resolution. Cell 147 : 1408–1419 doi:10.1016/j.cell.2011.11.013
56. SchaefferSW, BhutkarA, McAllisterBF, MatsudaM, MatzkinLM, et al. (2008) Polytene chromosomal maps of 11 Drosophila species: the order of genomic scaffolds inferred from genetic and physical maps. Genetics 179 : 1601–1655 doi:10.1534/genetics.107.086074
57. DeweyCN (2012) Whole-genome alignment. Methods Mol Biol 855 : 237–257 doi:_10.1007/978-1-61779-582-4_8
58. GuindonS, GascuelO (2003) A simple, fast, and accurate algorithm to estimate large phylogenies by maximum likelihood. Syst Biol 52 : 696–704.
59. TrapnellC, PachterL, SalzbergSL (2009) TopHat: discovering splice junctions with RNA-Seq. Bioinformatics 25 : 1105–1111 doi:10.1093/bioinformatics/btp120
60. TrapnellC, WilliamsBA, PerteaG, MortazaviA, KwanG, et al. (2010) Transcript assembly and quantification by RNA-Seq reveals unannotated transcripts and isoform switching during cell differentiation. Nat Biotechnol 28 : 511–515 doi:10.1038/nbt.1621
61. Team RC (n.d.) R: A Language and Environment for Statistical Computing. Available: http://www.R-project.org/.
62. Luengo HendriksCL, KeränenSVE, FowlkesCC, SimirenkoL, WeberGH, et al. (2006) Three-dimensional morphology and gene expression in the Drosophila blastoderm at cellular resolution I: data acquisition pipeline. Genome Biol 7: R123 doi:10.1186/gb-2006-7-12-r123
63. FowlkesCC, EckenrodeKB, BragdonMD, MeyerM, WunderlichZ, et al. (2011) A conserved developmental patterning network produces quantitatively different output in multiple species of Drosophila. PLoS Genet 7: e1002346 doi:10.1371/journal.pgen.1002346
Štítky
Genetika Reprodukční medicínaČlánek vyšel v časopise
PLOS Genetics
2013 Číslo 9
Nejčtenější v tomto čísle
- A Genome-Wide Systematic Analysis Reveals Different and Predictive Proliferation Expression Signatures of Cancerous vs. Non-Cancerous Cells
- Recent Acquisition of by Baka Pygmies
- The Condition-Dependent Transcriptional Landscape of
- Histone Chaperone NAP1 Mediates Sister Chromatid Resolution by Counteracting Protein Phosphatase 2A