
Genotype-Environment Interactions Reveal Causal Pathways That Mediate Genetic Effects on Phenotype
Unraveling the molecular processes that lead from genotype to phenotype is crucial for the understanding and effective treatment of genetic diseases. Knowledge of the causative genetic defect most often does not enable treatment; therefore, causal intermediates between genotype and phenotype constitute valuable candidates for molecular intervention points that can be therapeutically targeted. Mapping genetic determinants of gene expression levels (also known as expression quantitative trait loci or eQTL studies) is frequently used for this purpose, yet distinguishing causation from correlation remains a significant challenge. Here, we address this challenge using extensive, multi-environment gene expression and fitness profiling of hundreds of genetically diverse yeast strains, in order to identify truly causal intermediate genes that condition fitness in a given environment. Using functional genomics assays, we show that the predictive power of eQTL studies for inferring causal intermediate genes is poor unless performed across multiple environments. Surprisingly, although the effects of genotype on fitness depended strongly on environment, causal intermediates could be most reliably predicted from genetic effects on expression present in all environments. Our results indicate a mechanism explaining this apparent paradox, whereby immediate molecular consequences of genetic variation are shared across environments, and environment-dependent phenotypic effects result from downstream integration of environmental signals. We developed a statistical model to predict causal intermediates that leverages this insight, yielding over 400 transcripts, for the majority of which we experimentally validated their role in conditioning fitness. Our findings have implications for the design and analysis of clinical omics studies aimed at discovering personalized targets for molecular intervention, suggesting that inferring causation in a single cellular context can benefit from molecular profiling in multiple contexts.
Published in the journal:
. PLoS Genet 9(9): e32767. doi:10.1371/journal.pgen.1003803
Category:
Research Article
doi:
https://doi.org/10.1371/journal.pgen.1003803
Summary
Unraveling the molecular processes that lead from genotype to phenotype is crucial for the understanding and effective treatment of genetic diseases. Knowledge of the causative genetic defect most often does not enable treatment; therefore, causal intermediates between genotype and phenotype constitute valuable candidates for molecular intervention points that can be therapeutically targeted. Mapping genetic determinants of gene expression levels (also known as expression quantitative trait loci or eQTL studies) is frequently used for this purpose, yet distinguishing causation from correlation remains a significant challenge. Here, we address this challenge using extensive, multi-environment gene expression and fitness profiling of hundreds of genetically diverse yeast strains, in order to identify truly causal intermediate genes that condition fitness in a given environment. Using functional genomics assays, we show that the predictive power of eQTL studies for inferring causal intermediate genes is poor unless performed across multiple environments. Surprisingly, although the effects of genotype on fitness depended strongly on environment, causal intermediates could be most reliably predicted from genetic effects on expression present in all environments. Our results indicate a mechanism explaining this apparent paradox, whereby immediate molecular consequences of genetic variation are shared across environments, and environment-dependent phenotypic effects result from downstream integration of environmental signals. We developed a statistical model to predict causal intermediates that leverages this insight, yielding over 400 transcripts, for the majority of which we experimentally validated their role in conditioning fitness. Our findings have implications for the design and analysis of clinical omics studies aimed at discovering personalized targets for molecular intervention, suggesting that inferring causation in a single cellular context can benefit from molecular profiling in multiple contexts.
Introduction
Genome-wide association studies have identified hundreds of genetic variants that increase susceptibility to diseases [1]. However, knowledge of the causal genetic variant, frequently occurring in genomic regions with little or no functional annotation, rarely yields opportunities for treatment. This may be because either the affected gene is not known, the affected gene is not druggable, or the pathway mediating the genetic effect on the physiological phenotype has not been elucidated. Therefore, the identification of the full intermediate pathways, including the causal intermediate molecules through which genetic variants affect physiological phenotypes (Fig. 1, nodes A and B), will greatly expand the set of possible targets for molecular intervention.
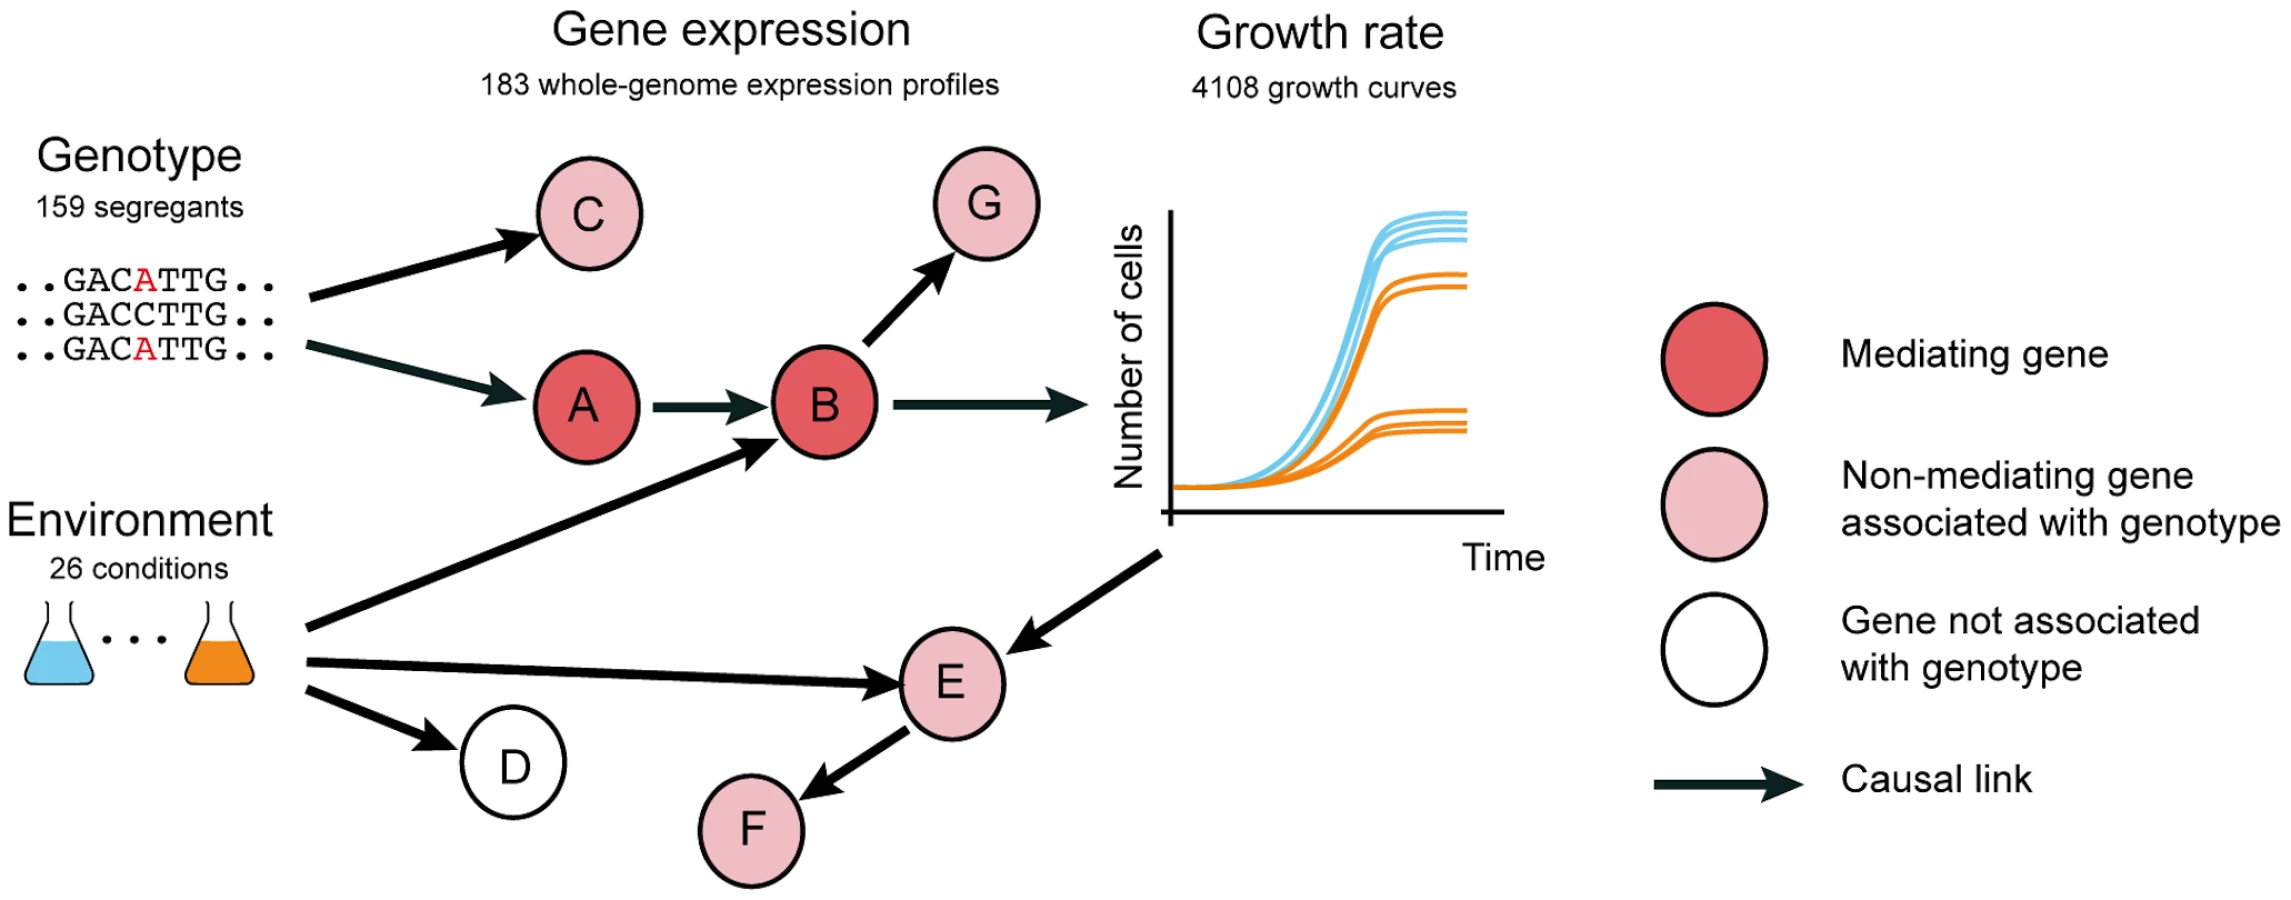
Transcription profiling has been utilized to narrow down the causal intermediate pathways and molecules between genotype and phenotypes of interest, by identifying genes whose expression levels are associated with genetic variants that also affect phenotype ([2], [3], [4] and reviewed in [5]). Using quantitative trait loci mapping, an abundance of genetic variants have been associated with gene expression levels (expression quantitative trait loci or eQTLs). In human, most eQTLs have been detected in the genomic vicinity of the associated gene, indicating a likely cis mechanism. However, as sample sizes increase, eQTLs that are located further away from the associated gene, presumably acting via a trans mechanism, are increasingly being detected [5]. Genes whose expression is associated with disease QTLs have been considered to be putative causal intermediates between genotype and the disease [5] (Fig. 1 node A, B). However, these genetic associations can also be the result of linkage (whereby the effect on gene expression is caused by a linked polymorphism, Fig. 1 node C) or reflect responses to the physiological phenotype (Fig. 1 nodes E, F). Hence, eQTL associations with genetic variants that also underlie phenotypes are merely correlative evidence, and alone do not confirm that the expression of these genes plays a causal role in phenotype. Thus far, a systematic evaluation to understand whether and under which circumstances eQTL association is predictive of causal intermediates has not been conducted.
It has long been known that genetic effects on physiological phenotypes often depend on the cellular and environmental context, such as culture media, cell type, or tissue. This dependency on cellular context, or genotype-environment interactions if the context is an external condition, has also been reported for genetic effects on gene expression, ranging from yeast to human [6], [7], [8]. Akin to the increased statistical power of multi-trait QTL mapping [9], detection of eQTLs is improved by mapping across multiple tissues [10]. However, the relevance of eQTLs detected in tissues that are not affected by the disease of interest for identifying causal intermediates remains unclear. Such investigations will be necessary to understand the utility of eQTL studies performed in proxy tissues [11].
Here we hypothesized that distinguishing causal intermediates from correlative associations can be facilitated by applying environmental changes, since these induce additional perturbations of gene regulatory networks independently of genetic variants (Fig. 1). Using functional genomics assays in yeast, we confirm that profiling expression in multiple environments is informative in identifying causal intermediates. We anticipate that our observations will facilitate the use of molecular profiling studies to identify causal intermediates that can also serve as intervention points to modulate the effects of genotype on phenotype (Fig. 1).
Results
To discover causal intermediates for fitness in yeast, we carried out extensive growth and transcriptome profiling of a panel of genetically diverse yeast strains (Table S1). In particular, we monitored the growth of 159 meiotic segregant strains obtained from a cross between a laboratory strain (S96) and a clinical isolate (YJM789) of Saccharomyces cerevisiae [12] in 26 diverse environmental conditions (Table S2). We mapped the genetic determinants of growth rate in these environments using genome-wide single marker analysis, which yielded 27 distinct genetic regions (growth quantitative trait loci, QTLs) significantly associated with growth rate in at least one environment (False Discovery Rate, FDR<0.05, Methods, Table S3 and Fig. 2A). Notably, genotype-environment interactions were prevalent, which was reflected in the limited number of growth QTLs that were shared between any pair of environments (15%+/−0.6% standard error of the mean, s.e.m.). Moreover, even shared QTLs varied in the magnitude and, in two instances, in the direction of effects (i.e., which parental allele was associated with faster growth; Fig. 2A): 1) the clinical isolate allele of MKT1 was detrimental for growth in rapamycin but beneficial in ethanol, glucose and maltose; and 2) the laboratory strain allele of HAP1 was detrimental in glucose but beneficial in media depleted of nitrogen sources (at FDR<0.1). Together, the prevalence of genotype-environment interactions observed here is in agreement with previous reports ranging from yeast [13] to human [8], demonstrating that genetic effects on phenotype depend heavily on environmental context.

To identify causal intermediates between genotype and growth, we performed transcription profiling in 5 environmental conditions (glucose, low iron, rapamycin, ethanol, maltose; Fig. S1), exceeding the scale of previous studies [6], [8]. These environments were selected from those for which we generated growth profiles, in order to cover all types of genotype-environment interactions encountered in our growth data (including isolated and opposing effects, highlighted in Fig. 2A). We employed a checkered experimental design, whereby random subsets of approximately 35 strains per environment were selected for expression profiling (Fig. S1). This approach offers the advantage that, at a moderate cost, a large proportion of the genetic variation in the entire population is covered. Transcriptome annotation across the 183 tiling microarrays analyzed yielded 8,382 transcribed regions (hereafter called genes, which include coding and non-coding genes; Table S4, Methods). The expression of between 22% (low iron) and 50% (maltose) of these genes was associated with at least one genomic locus (expression quantitative trait locus, eQTL; FDR<0.05; Fig. 2B, Fig. S2). The fraction of shared eQTLs for individual genes between any pair of environments was highly variable (Fig. S3), suggesting that genetic regulation of gene expression can vary in its sensitivity to environmental changes depending on the gene.
Across these 5 environments, the genetic effects on growth rate were captured by 6 major growth QTLs (Fig. 2B: AMN1, CHRV, MAL13, CHRX, HAP1, MKT1; determined by multi-environment growth genetic model, Methods). The phenotypic variance explained by this model differed across environments, ranging from 31% in glucose to 52% in maltose (Fig. S4). Each growth QTL was also associated with the expression of a large number of genes in the same environment (i.e., with eQTLs within 50 kb of the growth QTL: Fig. 2B, ranging from 76 genes (0.9%) for AMN1 in low iron to 2,894 genes (35%) for MAL13 in maltose). Notably, some of these loci were also associated with gene expression in environments where they were not associated with growth. For example, expression levels of 111 genes were associated with the MKT1 locus in low iron (within 50 kb, Fig. 2B), although MKT1 was not associated with growth in that condition. To characterize how environment modulates the effect of growth QTLs on gene expression, we modeled expression levels as the sum of 1) a genetic effect that persists in direction and amplitude across environments (hereafter ‘persistent’), and 2) an environment-dependent effect. This showed that the number and proportion of persistent genes varied greatly across individual growth QTLs and environments (ranging from 0% for MAL13 in maltose to 86% for AMN1 in glucose; FDR<0.05; Fig. S5). Thus, transcriptome profiling across 5 environments revealed that growth QTLs affected gene expression in two manners: persistent and, akin to their effects on growth, environment-dependent.
Both persistent and environment-dependent genes are candidate causal intermediates. To test which candidates indeed play a causal role in growth in the environments of interest, we performed parallel growth assays of a genome-wide deletion collection that covers 4,498 distinct non-essential genes [14] (Methods). As observed in previous studies [15], the phenotypic effects of individual deletions varied across environments, yielding between 938 (glucose) and 1,524 (rapamycin) genes whose deletion was either detrimental or beneficial for growth (FDR<0.05; Fig. S6, Methods). The top-ranking environment-dependent candidates at each growth QTL did not significantly affect growth in that environment when deleted (Fig. 3A; 0.80±0.07 fold enrichment compared to genome-wide background, jackknife resampling, Methods). In contrast, persistent candidates were much more likely to be validated by the deletion assay (Fig. 3A; 2.15±0.18 fold enrichment). This enrichment was robust with respect to choices of cutoffs, and also held for the vast majority of individual growth QTLs and environments (see ‘Benchmarking’ in Methods; Figs. S7, S8). Similar results were obtained when environment-persistent eQTLs were defined from a down-sampled dataset (in which the number of data points matched the average number of measurements in any specific environment), ruling out possible biases due to larger statistical power for detecting persistent vs. environment-dependent associations (Fig. S7 and Text S1). Furthermore, the difference in validation rate did not depend on the effect size of either the eQTLs (Fig. S9) or the growth QTLs (Fig. S10). Finally, the number of persistent eQTLs detected appeared to be independent of the effect size of the corresponding growth QTL (Fig. S11). Hence, the robustness with respect to effect sizes suggests that this finding is likely to translate to growth QTLs with smaller genetic effects, which will become detectable in larger populations [16]. Altogether, these findings indicate that persistent eQTLs are more likely to play causal roles in phenotype than environment-dependent eQTLs.

We then sought to develop a statistical model that leverages this insight to predict causal intermediates. The high validation rate of persistent candidates suggests a regulatory model where QTLs control expression of causal genes, which in turn have environment-dependent effects on phenotype (Fig. 1, node A). Former studies in single environments have shown that joint modeling of genotype, gene expression and physiological phenotype can assist in identifying causal intermediates among eQTLs [17], [18], [19]. These approaches exploit the fact that, in contrast to other genes associated with the QTL, variation in expression of causal intermediates entails variation in the physiological phenotype. We thus extended these principles to multiple environments. For each growth QTL and for each gene, we used Bayesian network modeling to estimate the probability that the expression of that gene causally mediates the environment-dependent genetic effect on growth (Bayesian network, Methods). The Bayesian network models the expression level of candidate causal intermediates as a function of a persistent genetic effect, and the growth rate as a function of the expression of the candidate gene in an environment-dependent fashion. The fit of the data to this model is assessed against a null model, in which the gene is not related to the QTL. This model comparison identifies genes whose expression is both associated with the locus of interest across all environments (i.e., persistent eQTLs) and correlated with growth in the environment of interest (indicating that variation in its expression entails variation in growth rate in this environment). For example, Fig. 3B depicts the expression and growth pattern for a high-ranking gene predicted as a causal intermediate for the effect of the MKT1 genotype on growth in ethanol: MRP51 shows persistent eQTL association (segregation of high and low expression levels in each environment, x-axis) and correlation between its expression and growth rate in ethanol (quantitative correlation between expression and growth rate in ethanol; a more detailed visualization of these panels is shown in Fig. S12). Because this particular gene fulfills both of these association patterns with genotype and phenotype, it was among the top ranked candidates. Our deletion assay validated the causative role of MRP51 expression in conditioning growth in ethanol.
To evaluate the performance of the Bayesian network genome-wide, we compared its predictions to our deletion validations. The deletion screen supported 50% of the top 422 predictions across all growth QTLs. Furthermore, the Bayesian network (Fig. 3C, purple) that combines genotype, gene expression, and growth rate was consistently more accurate than predictions based on persistent expression associations alone that do not consider growth (Fig. 3C, orange). To compare our approach with previous attempts to infer causal relationships in genetic networks that analyzed only one environment [17], [18], [20], we constructed an analogous Bayesian network that restricts the analysis to the specific environment with a growth QTL. These single-environment approaches, either by basic eQTL association or by Bayesian network modeling, did not yield meaningful accuracy (Fig. 3C, blue and pink), underscoring the value of integrated analysis across multiple environments for predicting causal intermediates.
Functional annotations of the predicted causal intermediate genes were enriched in molecular pathways related to the environment of interest and the underlying genetic variant for most growth QTLs (Table S4 and Methods). For the MAL13 growth QTL, which encodes a regulator of the maltose pathway [21] and whose genetic influence on growth in maltose we validated by reciprocal hemizygosity analysis (Methods and Fig. S13), our model predicted two genes (MAL31, and a non-coding RNA SUT145). In support of this prediction, overexpression of MAL31 has been shown to rescue growth in maltose for the laboratory strain [22]. The functional specificity of this prediction, identifying just two genes, is in stark contrast to the 2,894 genes whose expression level was associated with the MAL13 genotype in maltose (FDR<0.05, within 50 kb; Fig. 2B). Since the majority of these 2,894 genes were not functionally validated by our deletion assay (12.0% validation rate vs. 11.2% genome-wide), most of them may well be consequences of the pronounced variation in growth rates (e.g., Figure 1, nodes E, F). Altogether, these data show that regulatory effects on whole pathways can occur persistently across multiple environments, even though their functional impact on growth is apparent only in specific environments. Therefore, the integration of multiple environmental conditions improves the prediction of causal intermediates that transmit genetic effects to phenotype.
Predictions from our model provided a mechanistic explanation for the opposing effects associated with the MKT1 locus. The clinical isolate allele resulted in increased fitness in several environments, most pronounced in ethanol, but decreased fitness in rapamycin (Fig. 4A). In contrast, MKT1 genetic effects on gene expression levels in these environments tended to be consistent in direction and amplitude, indicating that the genetic variant affects the same network of genes irrespective of the environment (Fig. 4B; positive correlation, Wilcoxon rank-sum test P<2.2×10⁻¹⁶). Likewise, the majority of the candidate causal intermediates predicted in ethanol and rapamycin were shared (89 of the top 100 in each environment). These genes have been implicated in mitochondrial function (Table S5) and higher expression levels were typically associated with the clinical isolate allele in both environments (Fig. 4B, top-right quadrant). Deletion of these predicted causal genes typically resulted in impaired growth in ethanol and improved growth in rapamycin (Fig. 4C, top-left quadrant). These findings are consistent with (i) regulation of mitochondria-localized genes by MKT1 [23], (ii) the well-characterized role of mitochondria in growth on non-fermentable media such as ethanol, and (iii) a previous report of nine mitochondrial genes as being detrimental to survival in rapamycin [24]. Altogether, these results explain the molecular basis of the opposing effects of MKT1 on growth rate in different environments (Fig. 4D). They also confirm that genetic effects on causative molecular pathways can occur in multiple environments, yet the functional impact of these pathways on phenotype may still be environment-dependent.

Discussion
Our results demonstrate that the integration of genetic and environmental variation into molecular profiling efforts improves the identification of causal intermediates. Why is this improvement so pronounced? Environmental cues trigger molecular processes that perturb the chain of molecular events linking genotype to phenotype. Our findings indicate that the immediate molecular consequences of DNA variation, lying furthest upstream in this cascade, are less likely to depend on environment (Fig. 1 nodes A, C). In contrast, the events furthest downstream of genotype, including side effects and consequences of phenotypic changes, are most often environment-dependent (Fig. 1a, nodes B, E, F, G). Our data show that causal intermediates can be effectively identified among the most upstream molecular players, such as genes whose expression is persistently associated with genetic variants across multiple environments.
The systematic deletion assay was instrumental for validating strategies to predict causal intermediates. The limitations of this approach are that it does not detect combinatorial effects and may miss complex genetic dependencies since the deletions are made in only one parental background. Additional functional assays, for example from double-knockout experiments, could be used to refine the validation information by tackling combinatorial effects. Nevertheless, we were able to identify a large number of genes within causal intermediate pathways for each growth QTL. Our dataset thus constitutes a useful reference for developments of novel causal inference methods.
Analogous to growth in yeast, genetic predisposition to disease is mediated by gene expression and depends on cellular context, including environment, tissue, and cell type. We observed that both persistent and context-dependent eQTLs are common and frequently occur at genetic loci that affect physiological phenotypes, consistent with previous reports from yeast [6] to human [8]. Moreover, most of our validated causal intermediates were not located in the vicinity of the growth QTL (203 of the 211 validated candidates at 50% precision cutoff were on another chromosome), verifying that our approach captures more than the direct cis-regulatory consequences of genetic variants. The identification of trans acting intervention points is important, as it yields larger sets of possible intervention points and allows for addressing QTLs located within gene deserts, like those frequently reported in genome-wide association studies. With larger sample sizes, trans associations are also increasingly being detected in human [4], although with weaker effect sizes. We have confirmed that the basic principles we discovered in yeast are robust with respect to the effect size of the association with phenotype and the genetic effect on gene expression. Hence, although the experimental design of a cross is specific to model organisms, our reported results and conclusions should also hold in higher eukaryotes.
In particular, our findings have implications for the experimental design of omics profiling of large clinical cohorts. Previous studies have suggested that disease-afflicted tissues are most informative in molecular profiling efforts, since they should more comprehensively capture the molecular consequences of genetic defects [11]. Our results suggest otherwise: it may be more difficult to distinguish causal regulatory changes from their consequences in affected tissues, perhaps because consequences of phenotypes will be more prevalent in these tissues. To disentangle causes and consequences, therefore, our findings attest to the utility of molecular profiling in diverse contexts, even if the overall number of profiling experiments is not increased. This includes longitudinal studies of individuals that carry a genetic defect before complex symptoms arise, and the profiling of matched control samples of the same tissue type that are not affected by the disease. Our results obtained with a checkered random design suggest that incomplete data, as commonly encountered in clinical settings, can be effectively analyzed to yield genuinely causal insights.
Such experimental designs in conjunction with causal inference algorithms as developed here can help to reveal key associations that indicate pathways with a causal role in the progression of genetic disease. Exploring strategies to leverage these mechanistic insights to develop treatments will be an important direction for systems medicine research.
Materials and Methods
Data availability
The data reported in this paper have been deposited in the ArrayExpress repository (http://www.ebi.ac.uk/arrayexpress/) under accession number E-MTAB-1398.
Strains, media, and primers
The segregants consist of 159 of the 184 segregants previously derived from a cross of S. cerevisiae strains S96 (MATa ho:: lys5 gal2) and YJM789 (MATα ho::hisG lys2 gal2) (see [12] and Table S1). Further strains were generated to confirm the MAL13 growth QTL (SI Methods). The complete list of growth media is given in Table S2. Primers are listed in Table S6.
Growth profiling
Strains were grown and their optical densities were tracked in a TECAN GENios multiwell plate reader. For the five environments of focus, measurements were repeated in triplicates and alternative layouts were compared. Growth rates were estimates using the R/Bioconductor cellGrowth package (SI Methods).
Transcription profiling and annotation
The segregants were grown at 30°C to mid-exponential phase. Tiling-array based transcription profiling was done as previously described [25] and applied to a random subset of strains in all environments, resulting in 184 arrays overall. Normalization included variance stabilization and an additional quantile normalization step (Text S1). Gene expression levels were estimated from a robust average across probes, accounting for overlapping genes. Transcriptome annotation was carried out jointly across all environments (Text S1).
Deletion collection profiling
Aliquots of the deletion collection were obtained from Robert St. Onge (Stanford Genome Technology Center, Palo Alto, CA). After overnight growth at 30°C, triplicates comparing relative abundances for barcoded deletion strains at generation 5 and generation 0 were profiled(Text S1). For each strain, the selection coefficient (or relative growth rate) was estimated using a linear model of log hybridization intensity and its significance assessed with a moderated t-test (Text S1).
Correction for multiple testing
False Discovery Rates were estimated according to the Storey and Tibshirani procedure [26].
eQTL mapping
Standard single-marker analysis was used, testing individual genetic variants for association with expression or growth phenotypes in a specific environment. To account for non-i.i.d. sample structure caused by the checkered experimental design, all association analyses were done using a linear mixed model, similar to EMMA [27] with a random effect that corrects for genotype structure (Text S1). Environment-dependent versus persistent eQTLs were classified by joint analysis across all environments, considering a shared main effect and interaction term in a particular environment. The joint growth genetic model was derived by means of stepwise regression (Text S1).
Bayesian network
To predict causal intermediate genes, we first fit a joint genetic growth model (Text S1). Next, we considered each gene-environment interaction term in this growth genetic model and tested each gene for mediating its effect [17], [18], [19]. This test was carried out by comparing two Bayesian networks that assume a mediating role (causal intermediate gene) versus no mediation. Let g be the vector of the growth rates in all samples, t the vector of gene expression of the gene of interest, s the genotype indicator matrix and E the environment indicator matrix. The two models compared by our approach can be specified as follows. In Model 1 (causal intermediate gene), growth rate and genotype at the interaction marker are assumed to be independent conditioned on gene expression. Furthermore, the gene is under environmentally persistent regulation of the corresponding marker. For a particular interaction term (ni, ei,), the joint distribution encoding these statistical dependencies is:


Deletion benchmarking
eQTL mapping and predictions from the Bayesian network were assessed in terms of their ability to predict genes with a functional effect on growth in the relevant environments as identified from the deletion collection profiling data. All assessments were done on the subset of 4,498 non-essential genes. The direction of the effect (beneficial or detrimental for growth) was deduced from the correlation between gene expression and growth and included in the evaluation (Text S1).
Full methods, including a more detailed description of the statistical analyses, are provided in Supplementary Information (Text S1).
Supporting Information
Zdroje
1. VisscherPM, BrownMA, McCarthyMI, YangJ (2012) Five years of GWAS discovery. Am J Hum Genet 90 : 7–24.
2. WheelerHE, MetterEJ, TanakaT, AbsherD, HigginsJ, et al. (2009) Sequential use of transcriptional profiling, expression quantitative trait mapping, and gene association implicates MMP20 in human kidney aging. PLoS Genet 5: e1000685.
3. DuboisPC, TrynkaG, FrankeL, HuntKA, RomanosJ, et al. (2010) Multiple common variants for celiac disease influencing immune gene expression. Nat Genet 42 : 295–302.
4. FehrmannRS, JansenRC, VeldinkJH, WestraHJ, ArendsD, et al. (2011) Trans-eQTLs reveal that independent genetic variants associated with a complex phenotype converge on intermediate genes, with a major role for the HLA. PLoS Genet 7: e1002197.
5. MontgomerySB, DermitzakisET (2011) From expression QTLs to personalized transcriptomics. Nat Rev Genet 12 : 277–282.
6. SmithEN, KruglyakL (2008) Gene-environment interaction in yeast gene expression. PLoS Biol 6: e83.
7. GerritsA, LiY, TessonBM, BystrykhLV, WeersingE, et al. (2009) Expression quantitative trait loci are highly sensitive to cellular differentiation state. PLoS Genet 5: e1000692.
8. GrundbergE, SmallKS, HedmanAK, NicaAC, BuilA, et al. (2012) Mapping cis - and trans-regulatory effects across multiple tissues in twins. Nat Genet 44 : 1084–1089.
9. KorolAB, PreigelIA, BocharnikovaNI (1987) Linkage between quantitative and marker loci. V. Joint analysis of various marker and quantitative traits. Genetika 23 : 1421–1131.
10. FlutreT, WenX, PritchardJ, StephensM (2013) A Statistical Framework for Joint eQTL Analysis in Multiple Tissues. PLoS Genet 9: e1003486.
11. GoringHH, CurranJE, JohnsonMP, DyerTD, CharlesworthJ, et al. (2007) Discovery of expression QTLs using large-scale transcriptional profiling in human lymphocytes. Nat Genet 39 : 1208–1216.
12. ManceraE, BourgonR, BrozziA, HuberW, SteinmetzLM (2008) High-resolution mapping of meiotic crossovers and non-crossovers in yeast. Nature 454 : 479–485.
13. CubillosFA, BilliE, ZorgoE, PartsL, FargierP, et al. (2011) Assessing the complex architecture of polygenic traits in diverged yeast populations. Mol Ecol 20 : 1401–1413.
14. PierceSE, DavisRW, NislowC, GiaeverG (2007) Genome-wide analysis of barcoded Saccharomyces cerevisiae gene-deletion mutants in pooled cultures. Nat Protoc 2 : 2958–2974.
15. HillenmeyerME, FungE, WildenhainJ, PierceSE, HoonS, et al. (2008) The chemical genomic portrait of yeast: uncovering a phenotype for all genes. Science 320 : 362–365.
16. BloomJS, EhrenreichIM, LooWT, LiteTL, KruglyakL (2013) Finding the sources of missing heritability in a yeast cross. Nature 494 : 234–237.
17. SchadtEE, LambJ, YangX, ZhuJ, EdwardsS, et al. (2005) An integrative genomics approach to infer causal associations between gene expression and disease. Nat Genet 37 : 710–717.
18. ChenLS, Emmert-StreibF, StoreyJD (2007) Harnessing naturally randomized transcription to infer regulatory relationships among genes. Genome Biol 8: R219.
19. ChenBJ, CaustonHC, MancenidoD, GoddardNL, PerlsteinEO, et al. (2009) Harnessing gene expression to identify the genetic basis of drug resistance. Molecular systems biology 5 : 310.
20. ZhuJ, SovaP, XuQ, DombekKM, XuEY, et al. (2012) Stitching together multiple data dimensions reveals interacting metabolomic and transcriptomic networks that modulate cell regulation. PLoS Biol 10: e1001301.
21. CharronMJ, DubinRA, MichelsCA (1986) Structural and functional analysis of the MAL1 locus of Saccharomyces cerevisiae. Molecular and cellular biology 6 : 3891–3899.
22. BrownCA, MurrayAW, VerstrepenKJ (2010) Rapid expansion and functional divergence of subtelomeric gene families in yeasts. Curr Biol 20 : 895–903.
23. LeeSI, DudleyAM, DrubinD, SilverPA, KroganNJ, et al. (2009) Learning a prior on regulatory potential from eQTL data. PLoS Genet 5: e1000358.
24. XieMW, JinF, HwangH, HwangS, AnandV, et al. (2005) Insights into TOR function and rapamycin response: chemical genomic profiling by using a high-density cell array method. Proceedings of the National Academy of Sciences of the United States of America 102 : 7215–7220.
25. XuZ, WeiW, GagneurJ, Clauder-MunsterS, SmolikM, et al. (2011) Antisense expression increases gene expression variability and locus interdependency. Molecular systems biology 7 : 468.
26. StoreyJD, TibshiraniR (2003) Statistical significance for genomewide studies. Proceedings of the National Academy of Sciences of the United States of America 100 : 9440–9445.
27. KangHM, ZaitlenNA, WadeCM, KirbyA, HeckermanD, et al. (2008) Efficient control of population structure in model organism association mapping. Genetics 178 : 1709–1723.
Štítky
Genetika Reprodukční medicínaČlánek vyšel v časopise
PLOS Genetics
2013 Číslo 9
Nejčtenější v tomto čísle
- A Genome-Wide Systematic Analysis Reveals Different and Predictive Proliferation Expression Signatures of Cancerous vs. Non-Cancerous Cells
- Recent Acquisition of by Baka Pygmies
- The Condition-Dependent Transcriptional Landscape of
- Histone Chaperone NAP1 Mediates Sister Chromatid Resolution by Counteracting Protein Phosphatase 2A