
Meta-Analysis of Genome-Wide Association Studies Identifies Six New Loci for Serum Calcium Concentrations
Calcium is vital to the normal functioning of multiple organ systems and its serum concentration is tightly regulated. Apart from CASR, the genes associated with serum calcium are largely unknown. We conducted a genome-wide association meta-analysis of 39,400 individuals from 17 population-based cohorts and investigated the 14 most strongly associated loci in ≤21,679 additional individuals. Seven loci (six new regions) in association with serum calcium were identified and replicated. Rs1570669 near CYP24A1 (P = 9.1E-12), rs10491003 upstream of GATA3 (P = 4.8E-09) and rs7481584 in CARS (P = 1.2E-10) implicate regions involved in Mendelian calcemic disorders: Rs1550532 in DGKD (P = 8.2E-11), also associated with bone density, and rs7336933 near DGKH/KIAA0564 (P = 9.1E-10) are near genes that encode distinct isoforms of diacylglycerol kinase. Rs780094 is in GCKR. We characterized the expression of these genes in gut, kidney, and bone, and demonstrate modulation of gene expression in bone in response to dietary calcium in mice. Our results shed new light on the genetics of calcium homeostasis.
Published in the journal:
. PLoS Genet 9(9): e32767. doi:10.1371/journal.pgen.1003796
Category:
Research Article
doi:
https://doi.org/10.1371/journal.pgen.1003796
Summary
Calcium is vital to the normal functioning of multiple organ systems and its serum concentration is tightly regulated. Apart from CASR, the genes associated with serum calcium are largely unknown. We conducted a genome-wide association meta-analysis of 39,400 individuals from 17 population-based cohorts and investigated the 14 most strongly associated loci in ≤21,679 additional individuals. Seven loci (six new regions) in association with serum calcium were identified and replicated. Rs1570669 near CYP24A1 (P = 9.1E-12), rs10491003 upstream of GATA3 (P = 4.8E-09) and rs7481584 in CARS (P = 1.2E-10) implicate regions involved in Mendelian calcemic disorders: Rs1550532 in DGKD (P = 8.2E-11), also associated with bone density, and rs7336933 near DGKH/KIAA0564 (P = 9.1E-10) are near genes that encode distinct isoforms of diacylglycerol kinase. Rs780094 is in GCKR. We characterized the expression of these genes in gut, kidney, and bone, and demonstrate modulation of gene expression in bone in response to dietary calcium in mice. Our results shed new light on the genetics of calcium homeostasis.
Introduction
Normal calcium homeostasis is regulated by three major hormones acting on their corresponding receptors in gut, kidney, and bone: parathyroid hormone (PTH) release governed by the calcium-sensing receptor (CASR), calcitonin, and the active metabolite of vitamin D, 1,25(OH)2-D. Despite heritability estimates of 33–78%, the genetic determinants of serum calcium are poorly understood [1], [2], [3]. We have previously reported a variant in CASR associated with calcium concentrations in European-ancestry individuals [4], [5]. To detect additional loci, we conducted a two-stage genome-wide association meta-analysis of serum calcium and studied expression of identified genes in key calcium homeostatic organs in the mouse under various calcium diets.
Results
Genome-wide association meta-analysis in Europeans
The discovery analysis consisted of 39,400 individuals from 17 population-based cohorts of European descent (Table 1 and Table S1). There was little evidence for population stratification at study level (median genomic inflation factor, λ = 1.006) or meta-analysis level (λ = 1.03), and we detected an excess of association signals beyond those expected by chance (Figure S1).

The CASR locus, previously identified in Europeans, was confirmed in our meta-analysis (P = 6.5E-59, Figure S2) [4], [5]. In addition, SNPs from five independent regions reached genome-wide significance (P<5E-08) in the overall discovery meta-analysis (Figure 1, Table 1, Table S2): rs1550532 (in DGKD, P = 4.60E-08), rs780094 (in GCKR; P = 3.69E-11), rs17711722 (near VKORC1L1, P = 2.78E-11), rs7481584 (in CARS, P = 9.21E-10) and rs1570669 (near CYP24A1; P = 3.98E-08).

Fourteen SNPs from Stage 1 were sent for Stage 2 validation in ≤21,679 additional Europeans: the twelve independent (≥1 Mb apart) SNPs with lowest P values (6.5E-59 to 8.1E-06) in Europeans and two additional genome-wide significant loci (rs9447004 and rs10491003) from a combined sample including 8318 Indian-Asians (Table 1). Of the fourteen SNPs, seven were considered successfully replicated (i.e. were in the same direction of effect as the discovery meta-analysis, had a one-side replication P<0.05 and were genome-wide significant (P<5E-8) in combined meta-analysis of discovery and replication sets). These were rs1801725 in CASR, rs1550532 in DGKD, rs780094 in GCKR, rs7336933 near KIAA0564 and DGKH, rs10491003 (closest gene GATA3), rs7481584 in CARS and rs1570669 near CYP24A1 (Table 1). Regional association plots are presented in Figure S3. Details on the seven SNPs that did not replicate are presented in Table S2. Association results for serum calcium in Caucasians for all SNPs with P value<5*E-5 are listed in Table S3. In a secondary analysis, all SNPs identified in the primary analysis showed consistent and significant association with serum calcium adjusted for serum albumin (Table S4, Figure S4), as well as an excess of association signals beyond those expected by chance (Figure S5); no additional locus was identified using albumin-corrected serum calcium (Table S5).
Copy number variations (CNVs) and eQTL analyses
We found no significant association of the 7 replicated SNPs known to provide reliable tags for copy number variations (CNVs) in people of European-descent from the Hypergene dataset. For all the SNPs, the calculated correlation was below 0.002. We also explored a list of SNPs tagging CNVs from the GIANT consortium. Out the 7 SNPs tested, only the rs1570669 was in slight linkage disequilibrium (r2 = 0.54) with one SNP of the WTCCC2 list (rs927651). The corresponding SNP tags the CNVR7875.1 CNV located 455b from the SNP of interest.
For each of the 7 replicated SNPs, we identified all proxy SNPs with r2>0.8 in HapMap CEU (releases 21, 22, and HapMap 3 version 2) using the online SNAP database (http://www.broadinstitute.org/mpg/snap/). This led to the identification of 40 SNPs. We then queried each of these SNPs in the eQTL database of the University of Chicago (http://eqtl.uchicago.edu/cgi-bin/gbrowse/eqtl/). Three of the seven SNPs are in strong linkage disequilibrium with an eQTL, as illustrated in Table S6.
Information on genes mapping into the replicated genomic regions
Proposed functions of the genes mapping into the associated intervals (±250 kb) are in Box 1 and in Table S7 for the gene-rich GCKR region. We report in Table S8 the mechanism and/or location of all available biological processes, cellular components and molecular functions related to the genes mapping into the associated intervals from the AmiGo 1.8 gene ontology database. We also queried the OMIM database for each genes located within ±250 kb of the replicated loci (Table S9)
Box 1. Genes Located within Replicated Loci for Serum Calcium
We here summarize the information on genes located within ±250 kb from the top SNP at each locus. Because it is a gene dense region, details of genes located in the GCKR genomic region are presented in Table S4.
Chromosome 2, locus rs1550532
DGKD rs1550532 is an intronic SNP located near the 5′UTR region of DGKD. DGKD encodes diacylglycerol kinase delta, a member of the diacylglycerol kinase (DGK) enzyme family. Alternative splicing of the DGKD gene results in two isoforms, which differ in their expression profiles and regulatory mechanisms [24]. DGKs play an important role in signal transduction by modulating the balance between the diacylglycerol (DAG) and phosphatidic acid (PA), important second messengers in signaling cascades. Recent findings suggest that DAG is involved in calcium signaling in parathyroid cells [25]. CASR signaling influences intracellular DAG levels in cardiomyocytes [26].
SAG encodes S-antigen (also called arrestin), a soluble photoreceptor protein expressed in the retina and pineal gland. Mutations in this gene are associated with Oguchi disease (OMIM#258100), a rare autosomal recessive form of night blindness. Arrestin is a calcium-binding protein that plays an important role in phototransduction.
ATG16L1 encodes autophagy related 16-like 1 protein, part of a complex involved in autophagia. Mutations in this gene are responsible for inflammatory bowel disease 10 (OMIM # 611081). There is no known direct link with calcium signaling.
SCARNA5 and SCARNA6 encode small Cajal body-specific RNAs 5 and 6, which are small nuclear RNAs, belonging to non-coding RNAs involved in the RNA-processing machinery. There is no known direct link with calcium signaling.
USP40 encodes ubiquitin specific peptidase 40. USP40 functions as a deubiquinating enzyme involved in the degradation of unwanted intracellular proteins in eukaryocytic cells. There is no known direct link with calcium signaling.
INPP5D encode inositol polyphosphate-5-phosphatase, expressed in hematopoietic cells. This protein regulates myeloid cell proliferation. The presence of a recombination peak between this gene and rs1550532 makes it an unlikely candidate for this signal.
Chromosome 10, locus rs10491003
rs10491003, located within a long non-coding RNA with GATA3 as its nearest gene may influence the expression of GATA3 [27].
GATA3: GATA3 encodes a GATA transcription factor involved in T cell lymphopoiesis [28], renal and vestibular morphogenesis [29], [30], and parathyroid gland development [31]. GATA3 haploinsufficiency causes hypoparathyroidism and hypocalcemia in the autosomal dominant HDR syndrome (hypoparathyroidism, sensorineural deafness and renal dysplasia) (OMIM#146255) [32], [33]. Although GATA3 is the closest gene to rs10491003, this variant lies 1.2 Mbp downstream from that gene. However, GATA3 has a very large flanking regulatory region - greater than 450 kbp - [34] and mammalian enhancers may lie more than 1 Mbp away from the gene they regulate [35]. GATA3 may play a role in preserving high degree of differentiation of parathyroid gland and of calcium transporting epithelia [36].
Chromosome 11, locus rs7481584
This region is located in the imprinted gene domain of 11p15.5, an important tumor suppressor gene region [37].
CARS: rs7481584 is an intronic SNP of CARS. CARS encodes a cysteinyl-tRNA synthetase and is located within the imprinted gene domain of 11p15.5. This region is linked to Beckwith-Wiedemann syndrome, which is associated with hypocalcemia and hypercalciuria.
NAP1L4 encodes nucleosome assembly protein 1-like 4, a member of the nucleosome assembly protein, potentially involved in histone chaperoning and ubiquitously expressed. NAP1L1 and NAP1L4 have been recently identified as being involved in the regulation of DGKH nucleocytoplasmic shuttling [38]. A link with calcium homeostasis could be possible via the DGKs pathway.
PHLDA2 encodes pleckstrin homology-like domain, family A, member 2. This gene has been recently highlighted as potentially relevant for osteoporosis on the basis of a bioinformatics pathway analysis approach [39]. Imprinting of this gene appears to play a role in fetal growth, including fetal bone growth, birth weight and bone mass in childhood.[40], [41], [42], [43] In cancer, PHLDA2 is activated by parathyroid hormone-like hormone (PTHLH) [44]. PTHLH is associated with malignancy-related hypercalcemia [45], lactation [46], the expression of PHLDA2 is upregulated in osteosarcoma progression [47].
OSBPL5 encodes oxysterol binding protein-like 5, an intracellular lipid receptor involved in cholesterol balance. There is no known direct link with calcium homeostasis.
MRGPRE and MRGPRG encode MAS-related G-protein-coupled receptors, member E and G. This family of receptors is expressed in nociceptive sensory neurons. There is no known direct link with calcium homeostasis.
C11orf36 encodes MRGPRG antisense RNA 1. Little is known about this gene.
SNORA54 encodes small nucleolar RNA, H/ACA box. The gene product belongs to non-coding RNAs involved in the RNA-processing machinery. There is no known direct link with calcium homeostasis.
SLC22A18 and SLC22A18AS encode solute carrier family 22, member 1 and solute carrier family 22, member 1 antisense. SLC22A18 is an organic cation transporter. Mutations in SLC22A18 have been found in several cancers. There is no known direct link with calcium homeostasis.
CDKN1C encodes cyclin-dependent kinase inhibitor 1C (p57, Kip2), a protein involved in cell-cycle progression. This imprinted gene is responsible for the IMAGe syndrome (OMIM#300290) characterized by intrauterine growth restriction, metaphyseal dysplasia, delayed bone aging, adrenal hypoplasia congenital, genital anomalies, and sometimes hypercalciuria [48].
KCNQ1 encode potassium voltage-gated channel, KQT-like subfamily, member 1. KCNQ1OT1 represents KCNQ1 opposite strand transcript 1 and is an unspliced long non-coding RNA, which regulates the transcription of many target genes. Mutations in KCNQ1 are associated with hereditary long and short QT syndromes (OMIM#192500 & 609621), Jervell and Lange-Nielsen syndrome (OMIM#220400), familial atrial fibrillation (OMIM#607554), type 2 diabetes. KCNQ1 is also imprinted in a tissue-specific manner. There is no known direct link with calcium homeostasis.
Chromosome 13, locus rs7336933
DGKH encodes diacylglycerol kinase eta, a member of the diacylglycerol kinase (DGK) enzyme family. See DGKD (above) for discussion.
KIAA0564: this gene encodes a large uncharacterized protein containing a putative ATP-ase domain. The sequence of this gene is conserved across a large array of organisms, from humans to mouse, zebrafish and to C. elegans, which suggests an important biological function. Yet, little is known on the nature of the function of this gene so far.
Chromosome 20, locus rs1570669
CYP24A1: rs1570669 is an intronic SNP of CYP24A1. CYP24A1 encodes a cytochrome P450 enzyme that hydroxylates 1,25-(OH)2D, into metabolites targeted for degradation and appears to be one of the central regulator of 1,25-(OH)2-D metabolism. CYP24A1 is highly regulated by its own substrate 1,25(OH)2-D, as well as by PTH [49], [50], serum phosphate and fibroblast growth factor-23 (FGF-23) [51], [52], [53]. Sequence variants of CYP24A1 impacting on 1,25(OH)2-D metabolism have been described recently and explain the strong heritability of 1,25(OH)2-D concentrations.
BCAS1 encodes breast carcinoma amplified sequence 1, considered as an oncogene. BCAS1 is highly differentially expressed in some cancers. However, there is no direct link with calcium homeostasis.
PFDN4 encodes prefoldin subunit4. Prefoldin is a chaperone complex involved in polypeptide folding. There is no known link of this gene with calcium homeostasis.
Validation across ethnicities
In Indian-Asians, all 7 replicated SNPs had beta-coefficients that were direction-consistent with the primary analysis and 3 were statistically significant (P<0.05): rs1801725 (CASR, P = 1.4E-31), rs1550532 (DGKD, P = 0.002) and rs10491003 (GATA3, P = 0.009) (Table S10). In Japanese, 3 SNPs had betas that were direction-consistent with the primary analysis, but only rs1801725 (CASR) was associated with serum calcium (P = 0.001) (Table S10).
Associations with related phenotypic traits
We conducted analyses of related bone mineral and endocrine phenotypic traits for the 7 replicated loci (Table 2). Several SNPs were associated (P<0.05) with bone mineral density (BMD) in the GEFOS consortium [6]: rs1801725 at CASR (P = 0.025; previously reported [4], [5]) and rs780094 (GCKR) at the lumbar spine (P = 0.006), rs1570669 at CYP24A1 at the femoral neck (P = 0.04), and rs1550532 at DGKD at both the lumbar spine (P = 0.003) and the femoral neck (P = 0.003). For endocrine phenotypes, rs1570669 at CYP24A1 was associated with higher PTH concentrations (P = 0.0005) and rs1801725 at CASR with higher serum PTH concentrations (P = 0.028) and lower serum phosphate concentrations, as previously reported [4], [5]. No SNP was associated significantly with circulating 25-OH vitamin D concentrations (all P>0.05) in the SUNLIGHT consortium [7].
![Look-ups of serum calcium loci with related phenotypes: bone mineral density in the GEFOS dataset <em class="ref">[6]</em> and endocrine phenotypes from the SHIP, SHIP Trend and SUNLIGHT <em class="ref">[7]</em> datasets.](https://pl-master.mdcdn.cz/media/cache/media_object_image_large/media/image/9b31c4b3d5d4d4f406d099679320fe57.png)
Animal studies
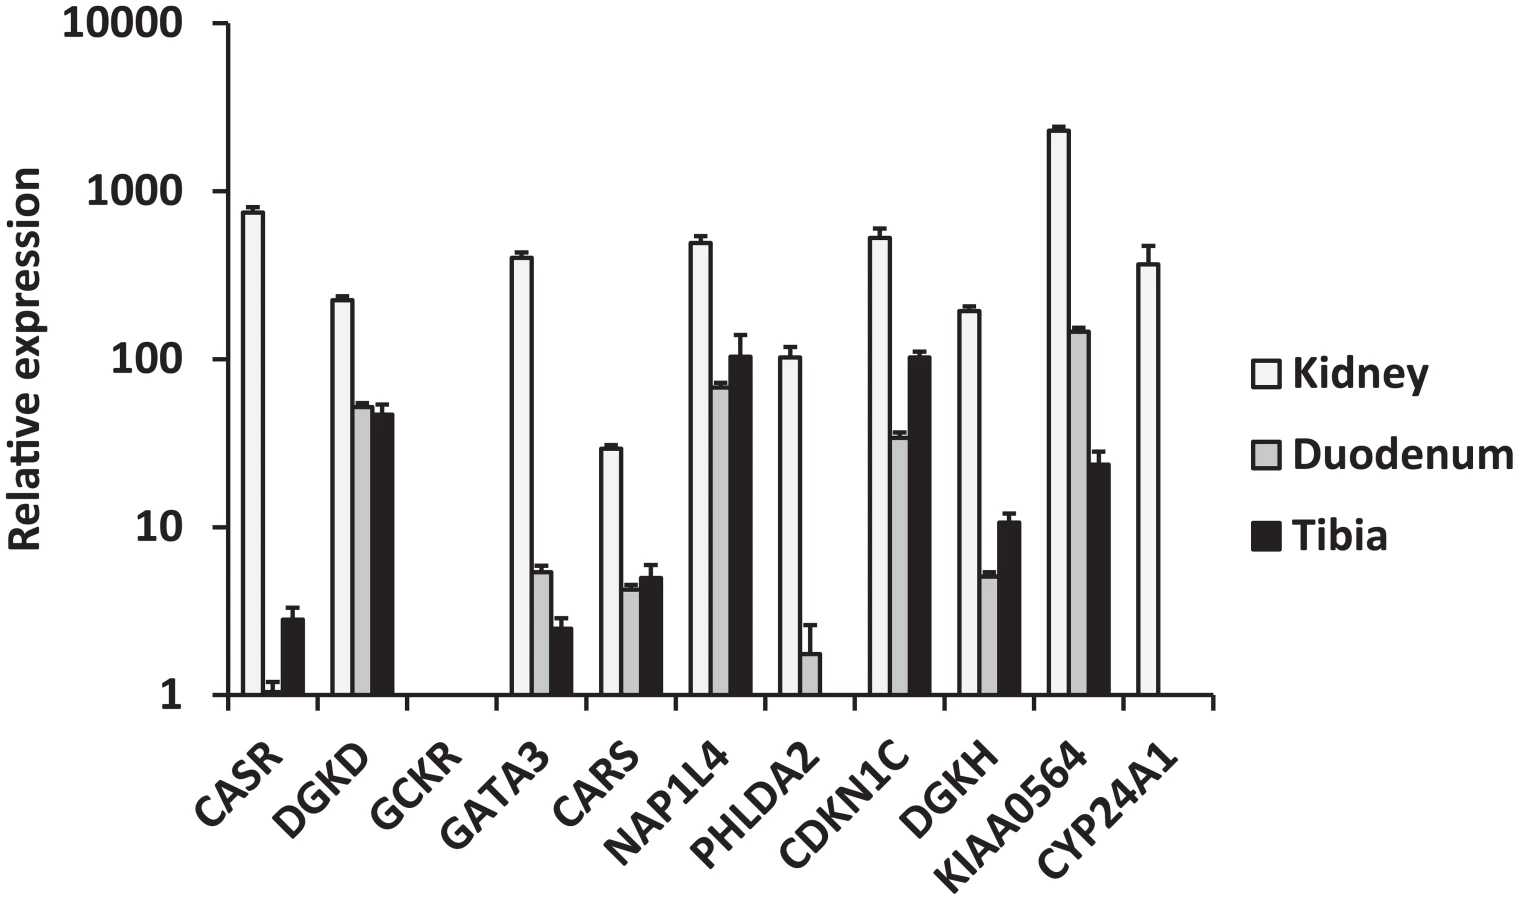
We selected biologically plausible gene(s) at each locus for in vivo studies in a mouse model as described in Methods' section. We first analyzed gene expression in the three primary calcium-handling organs: duodenum, kidney and bone (tibia). CASR for the rs1801725 locus, DGKD for the rs1550532 locus, GATA3 for the rs10491003 locus, CARS, NAP1L4 and CDKN1C for the rs7481584 locus, DGKH and KIAA0564 for the rs7336933 locus, were expressed in all organs, whereas CYP24A1 (rs1570669 locus) was solely, and PHLDA2 (rs7481584 locus) mainly, expressed in the kidney (Figure 2). No significant expression of GCKR (rs780094 locus) was observed in any organ tested, which is of interest considering the strong attenuation of the association of rs780094 with serum calcium after adjustment for albumin (Table S4). In micro-dissection of nephron segments [8], [9], DGKD, DGKH, CARS, KIAA0564 and CYP24A1 were primarily transcribed in the proximal tubule, CASR in the thick ascending limb, and GATA3 predominantly in the distal nephron and collecting duct (Figure 3).

In order to determine regulation of gene expression by calcium intake, we measured gene expression levels in mice fed low and high calcium diets (0.17% vs. 1.69% calcium) for one week, with normal diet as control (0.82%) (Figure 4 and Table S11). In the kidney, both DGKD and DGKH were upregulated in response to low calcium diet (P≤0.05; Figure 4). In the tibia, CASR was markedly upregulated in response to low calcium diet (2.5-fold increased expression), as were GATA3, KIAA0564 and CARS (P≤0.05 for all; Figure 4), findings that suggest regulation by 1,25(OH)2-D. DGKD and DGKH were upregulated in the tibia in response to high and low calcium diet (P≤0.05 for all; Figure 4). The expression in duodenum of the majority of genes was not modified by dietary calcium, with the exception of NAP1L4 and CDKN1C.

Discussion
We have identified and replicated one known and six new loci for serum calcium near genes linked to bone metabolism and endocrine control of calcium. Of these, 4 loci (DGKD, GCKR, CASR, and CYP24A1) were nominally associated with BMD in the general population. In supporting mouse studies, we demonstrate expression of several of these genes in tibia, and show regulation of gene expression in response to dietary calcium intake. We also demonstrate expression in nephron segments known to regulate calcium homeostasis. Taken together, these results shed new light on the genetics of calcium balance.
The vast majority of total body calcium is bound in the skeleton as hydroxyapatite and other calcium-phosphate complexes [10]. Apart from providing skeletal strength, bone serves as a calcium reservoir to maintain tightly controlled circulating concentrations vital to cellular signaling, muscle contraction and coagulation [10]. However, the genetic basis of the dynamic cross talk that occurs between these compartments is poorly understood. Our results advance our understanding in this area. Eight genes identified in the GWAS are constitutively expressed in bone and are regulated in response to dietary calcium, in particular low calcium diet, whereas no clear change was observed in kidney or duodenum. This bone reactivity in response to dietary calcium intake is consistent with what was recently reported for CASR [11]. Further, of the eight genes expressed in bone and regulated in response to dietary calcium, we show that rs1550532 (DGKD) and rs1801725 (CASR) are associated with BMD in humans, the primary determinant of fracture risk.
The A allele of rs1570669 (CYP24A1 locus) was associated with reduced BMD at the femoral neck although CYP24A1 was not found to be expressed in bone in mice experiment, which suggests an indirect role in bone mineralization. This may occur via its documented role in vitamin D metabolism, discussed below, and/or its association with higher PTH concentrations identified in the present analysis.
We observed specific expression patterns of several genes in the mouse nephron: DGKD, DGKH, CARS, KIAA0564 and CYP24A1 were primarily transcribed in the proximal tubule, CASR expression was mostly localized to the thick ascending limb, whereas GATA3 was predominantly found in the distal part of the nephron and the collecting duct. This pattern of expression in segments known to be involved in calcium reabsorption suggests a role in renal calcium handling and is consistent with previous exploratory transcriptome analyses in humans and mice [12], [13]. Both DGKD and DGKH were significantly upregulated in the kidney in response to low calcium diet, suggesting specific involvement of these genes in renal calcium handling.
Several of the newly identified loci harbor genes linked to the hormonal control of serum calcium. First, the association of CASR with PTH concentrations is consistent with its known role in PTH signaling. Second, several lines of evidence implicate rs1570669 (CYP24A1) in the vitamin D pathway: its association with serum calcium and PTH concentrations, its selective expression in the proximal tubule where 1,25(OH)2-D metabolism occurs, and that loss-of-function CYP24A1 mutations cause vitamin D-induced hypercalcemia in children (idiopathic infantile hypercalcemia). Third, we identified variants linked to 2 chromosomally distinct isoforms of diacylglycerol kinase, part of the phosphoinositol second messenger system, that may interact with each other at the protein level [14], [15].
Strengths of this study are the large sample size and consistent mouse studies to support the statistical associations and advance our knowledge of the biology at these loci. Human and mice largely share physiological processes linked to calcium metabolism, including tissue-specific gene expression. Limitations include the lack of a direct marker of bone remodeling and the potential for bias in gene selection for experimental follow-up. Mice may display subtle differences in the regulation of the genes tested compared to humans.
We have identified and replicated one known and six new loci for serum calcium near genes linked to bone metabolism and endocrine control of serum calcium. Supporting experimental mouse studies suggest a role for dietary calcium in bone-specific gene expression. Further work is needed to identify the causal variants and to understand how they influence calcium homeostasis.
Materials and Methods
Ethics statement
In each human study, the local institutional review board approved the study and participants signed written informed consent, including for DNA analyses. The experimental protocol in mice was approved by the local veterinarian authorities and fulfilled Swiss federal regulations for experiences with animals.
Participating studies (human data)
Discovery and replication cohorts
A list of all discovery and replication studies, their sample size, mean serum calcium levels, age and serum albumin as well as proportion of women can be found in Table S1. We replicated findings using de novo genotyping in the Bus Santé Study and in silico data in all other cohorts. In most studies, serum calcium was measured using a colorimetric assay. The size of discovery tables varied from 488 to 9,049 for a total of 39,400 participants. A detailed description of the characteristics of discovery and replication cohorts, including laboratory method for serum calcium measurement, can be found in Table S12.
Genotyping
Detailed information on the genotyping plateforms and data cleaning procedures for each discovery and replication cohort can be found in Table S13. De novo replication genotyping was perfomed in 4670 participants to the Bus Santé Study using KASPar v4.0 after whole genome amplification by primer extension pre-amplification (PEP) using thermostable DNA polymerases.
Statistical analyses for the genome-wide association meta-analysis
In each discovery study, genotyping was performed using a genome-wide chip and nearly 2.5 million SNPs were genotyped or imputed using the HapMap CEU panels release 22 or 21 as the reference. Each study applied quality control before imputation. Detailed imputation information is provided in Table S13. Each SNP was modeled using an additive genetic effect (allele dosage for imputed SNPs), including age and sex as covariates in the model as well as study-specific covariates if needed (e.g. principal components, study center). The primary dependent variable in each discovery study was untransformed and uncorrected serum calcium expressed in mg/dL. Beta regression coefficients and standard errors were used with at least 5 decimal places. For secondary analyses, albumin-corrected serum calcium was computed using the following formula: ([4-plasma albumin in g/dL]×0.8+serum calcium in mg/dL) and the same model as for the primary analyses was used. Each file of genome-wide summary statistics underwent extensive quality control prior to meta-analysis both for primary and secondary analyses, including (1) boxplots of all beta coefficients, as well as all standard errors multiplied by the square-root of the sample size, for each study separately; (2) the range of P values, MAF, imputation qualities, call rates and Hardy-Weinberg equilibrium P values and (3) QQ plots. In addition, we checked the direction and magnitude of effect at the previously reported rs1801725 CASR variant. Genome-wide meta-analyses were conducted in duplicate by two independent analysts. For each SNP, we used a fixed effect meta-analysis using inverse-variance weights as implemented in the meta-analysis utility Metal [16]. Results were confirmed by a z-score based meta-analysis. Data were available for 2,612,817 genotyped or imputed autosomal SNPs for the primary and secondary analyses. After the meta-analysis, genomic control correction was applied (λGC was 1.03 for both uncorrected and corrected serum calcium). Our pre-specified criterion to declare genome-wide significance was P value<5E-8 to account for 1 million independent tests according to the Bonferroni correction. We choose to move forward for replication all SNPs with discovery P value<1E-7 in the European sample or genome-wide significant SNP in the overall sample that included Indian Asians. To choose a single SNP per genome-wide associated region for replication, we merged all SNPs within 1 Mb region and selected the lowest P value for each region. Altogether, fourteen SNPs were moved forward for replication. Up to 17,205 participants contributed information to the replication analyses in silico and 4,670 participants provided data for de novo genotyping. We used fixed-effects inverse-variance weighted meta-analysis to combine discovery and replication meta-analysis results. Replication was considered as present whenever a combined P value<5E-8 together with an effect-concordant one-sided replication P value<0.05 were obtained.
Data for look-ups of serum calcium loci with related phenotypes
We conducted look-ups for femoral and lumbar bone density in the GEnetic Factors of OSteoporosis (GEFOS) dataset [17]. Bone mineral density (BMD) is used in clinical practice for the diagnosis of osteoporosis and bone density at different skeletal sites is predictive of fracture risk. BMD was measured in all cohorts at the lumbar spine (either at L1–L4 or L2–L4) and femoral neck using dual-energy X-ray absorptiometry following standard manufacturer protocols [17]. Serum phosphorus was looked up from a previously published GWAS meta-analysis, including 16,264 participants of European ancestry [18]. Serum phosphorus concentrations were quantified using an automated platform in which inorganic phosphorus reacts with ammonium molybdate in an acidic solution to form a colored phosphomolybdate complex [18]. The 25-hydroxyvitamin D was looked-up in the SUNLIGHT consortium [7], which includes data from 33,996 individuals of European descent from 15 cohorts. 25-hydroxyvitamin D concentrations were measured by radioimmunoassay, chemiluminescent assay, ELISA, or mass spectrometry [7]. PTH was looked-up in the SHIP and SHIP-Trend studies. The serum parathyroid hormone concentration was measured on the IDS-iSYS Multi-Discipline Automated Analyser with the IDS-iSYS Intact PTH assay (Immunodiagnostic Systems Limited, Frankfurt am Main, Germany) according to the instructions for use. This chemiluminescence immunoassay detects the full-length parathyroid hormone (amino acids 1–84) and the large parathyroid hormone fragment (amino acids 7–84). The measurement range of the assay was 5–5000 pg/mL. The limits of blank, detection and quantitation were 1.3 pg/mL, 1.4 pg/mL, and 3.6 pg/mL, respectively. As recommended by the manufacturer, three levels of control material were measured in order to verify a decent working mode. During the course of the study, the coefficients of variation were 14.02% at low, 6.64% at medium, and 6.84% at high serum parathyroid hormone concentrations in the control material in SHIP and the corresponding percentages were 16.8% at low, 10.7% at medium, and 9.0% at high serum parathyroid hormone concentrations in the control material in SHIP-Trend.
Copy Number Variation (CNV) analysis
The Hypergene dataset (a 4206 samples case-control study concerning hypertension genotyped using the Illumina 1M chip) has been used to call CNVs and to check their correlation with the SNPs of interest. The CNVs calls have been done using pennCNV software [19]. A SNP by sample matrix with the copy number status was created. Then the square correlation (Pearson correlation) between value of each SNP of interest and the SNPs copy number status in a +/−2 Mb region was calculated. The SNPs of interest for which no correspondence has been found in the Hypergene dataset have been replaced by the closest SNPs in high linkage disequilibrium (LD) and present in the Hypergene dataset. LD between the SNPs of interest and a list of SNPs tagging CNVs from the GIANT consortium has also been calculated. The SNPs from the GIANT list are in LD higher than 0.8 with their corresponding CNV.
Gene ontology classification analysis
We queried the AmiGo 1.8 gene ontology database for each gene located within ±250 kb of the seven replicated SNPs, including rs1801725 (CASR). (http://amigo.geneontology.org/cgi-bin/amigo/go.cgi, last accessed November 6, 2012). We used Homo sapiens as a filter for species.
Expression quantitative trait locus (eQTL) Analyses
For each of the 7 replicated SNPs, we identified all proxy SNPs with r2>0.8 in HapMap CEU (releases 21, 22, and HapMap 3 vers. 2) using the online SNAP database (http://www.broadinstitute.org/mpg/snap/). We then queried each of these 40 SNPs in the eQTL database of the University of Chicago (http://eqtl.uchicago.edu/cgi-bin/gbrowse/eqtl/).
Rationale for gene selection for experimental analyses in mouse
The rs1801725 SNP encodes a missense variant in exon 7 of the CASR gene leading to an alanine to serine substitution (A986S). Given the key physiological role of CASR in calcium homeostasis (monogenic disorders of calcium balance), this gene was the logical candidate for analysis in mouse at this previously identified locus.
For the 6 newly identified loci, the precise rationale for gene selection varied from one locus to the other, but the main criteria was to focus on the most biologically relevant gene. Rs1550532 on chromosome 2 is an intronic SNP of DGKD, which was the most likely biological candidate for this locus and was therefore selected for analysis in mouse. None of the other genes located in this region (±250 Kb) has a known link with calcium homeostasis (Box 1) and rs1550532 is not in strong linkage disequilibrium with an eQTL (Table S6). We also took into account the fact that another member of the DGK family, namely DGKH was located near one of the other replicated loci, on chromosome 13.
Rs780094, on chromosome 2, is located in intro 16 of GCKR and is in strong linkage disequilibrium (r2 = 0.93) in Caucasians [20], with a common non-synonymous SNP (P446L, rs1260326) associated with glucokinase activity in vitro [20], [21]. This SNP has been associated with multiple other phenotypes in previous GWAS and it is in strong linkage disequilibrium with an eQTL (Table S6). Previous fine mapping analysis of this locus has attributed the signal from rs780094 to the functional rs1260326 variant [20]. The GCKR locus may indirectly influence calcium concentrations via its association with albumin levels [22]. In line with this, we observed an attenuation of the association of rs780094 with albumin-corrected serum calcium compared to the association with uncorrected serum calcium and we found GCKR not to be expressed in any of the key organs involved in calcium homeostasis that we tested in mice. We selected GCKR for analysis in mouse at this locus.
Rs10491003 on chromosome 10 is located within a long non-coding RNA. For this locus, we selected GATA3, the nearest and only gene located within this region, for analysis in mouse. GATA3 is implicated in monogenic disorders of calcium balance.
Rs7481584 is located within CARS (intronic SNP) in an imprinted region known to play a role in multiple cancers, which makes this locus a plausible candidate for malignancy-related hypercalcemia. Other plausible biological candidates in this locus are NAP1L4, PHLDA2 and CKDN1C (Box 1). Rs7481584 is in strong LD with 2 eQTLs, one associated with the expression of NAP1L4 (rs2583435) and the other one associated with the expressions of SLC22A18 and SLC22A18AS. We selected CARS, NAP1L4, PHLDA2 and CKDN1C for analyses in mouse.
For rs7336933, we selected the two only genes (DGKH and KIAA0564) located under this association peak on chromosome 13 for analyses in mouse.
Finally, rs1570669 is an intronic SNP of CYP24A1, a strong biological candidate implicated in monogenic disorders of calcium balance. The two other genes of this region (BCAS1 and PFDN4) have no known link with calcium homeostasis. Furthermore, rs1570669 and PFDN4 are separated by a recombination hot spot. We selected CYP24A1 for analysis in mouse.
As animal experiments started while the replication process was underway, we had also initially selected the following genes for analysis in mouse: RSG14 and SLC34A1 at locus rs4074995 (discovery P value = 2.4E-07), VKORC1L1 at locus rs17711722 (discovery P value = 2.8E-11), PYGB at locus rs2281558 (discovery P value = 6.4E-07), CD109 at locus rs9447004 (discovery P value = 8.1E-06). No gene was selected for the rs2885836 and rs11967485 and rs12150338 loci in the absence of obvious candidate. Results for these unreplicated loci can be found in Figures S6, S7 and S8. We present these results for quality control purposes: SLC34A1 (also known as NAPI-3 or NPT2), which encodes solute carrier family 34 (sodium phosphate), member 1, was expressed in the kidney, but neither in duodenum nor in bone, as expected based on current knowledge on this phosphate transporter. In the kidney SLC34A1 was mainly expressed proximally and SLC34A1 expression was upregulated under low calcium diet, which is in line with the known function of this gene.
Mouse experiments
Five C57bl/6 mice (Janvier) per group were fed, for one week, three different diets in which the percentage of calcium were 0.17% (low calcium diet), 0.82% (normal calcium diet) and 1.69% (high calcium diet) and had free access to water. 12∶12 hours light/dark alternance was imposed. At the end of the week of the specific diet, spot urine were collected and mice were anesthetized. Blood was collected by retro-orbital puncture. Organs were immediately harvested and snap frozen. RNA was extracted using Trizol (Invitrogen) and reversed transcribed with PrimeScriptTM RT reagent Kit (Takara Bio Inc). Calcium, sodium, phosphate and creatinine in plasma and urine were analyzed at the central lab of the Lausanne University hospital using a Cobas-Mira analyzer (Roche).
Microdissection
A separate set of three mice was kept under normal calcium diet. Proximal Tubule (Prox), thick ascending limb of the loop of Henle (TAL), distal convoluted tubule and connecting tubule (DCT-CNT) and cortical collecting duct (CCD) were isolated by microdissection of the left kidney after the mice were perfused with Liberase TM (Roche Diagnostics) [23]. RNA was extracted from the above mentioned tubules following TRI Reagent Solution protocol (Applied Biosystems) and purified with RNeasy Micro Kit (Qiagen). Reversed transcription was performed with PrimeScriptTM RT reagent Kit (Takara Bio Inc). Quantitative PCRs were performed (7500 Software v 2.0.4.) using TaqMan gene expression assays for the different genes (Applied Biosystems) and comparative CT method was applied. Expression levels were normalised to beta actin as endogenous reference gene.
Statistics
Comparison of groups was performed using unpaired Student's t-test.
Supporting Information
Zdroje
1. WhitfieldJB, MartinNG (1984) The effects of inheritance on constituents of plasma: a twin study on some biochemical variables. Ann Clin Biochem 21 ((Pt 3)) 176–183.
2. WilliamsPD, PuddeyIB, MartinNG, BeilinLJ (1992) Platelet cytosolic free calcium concentration, total plasma calcium concentration and blood pressure in human twins: a genetic analysis. Clin Sci (Lond) 82 : 493–504.
3. HunterDJ, LangeM, SniederH, MacGregorAJ, SwaminathanR, et al. (2002) Genetic contribution to renal function and electrolyte balance: a twin study. Clin Sci (Lond) 103 : 259–265.
4. O'SeaghdhaCM, YangQ, GlazerNL, LeakTS, DehghanA, et al. (2010) Common variants in the calcium-sensing receptor gene are associated with total serum calcium levels. Human Molecular Genetics 19 : 4296–4303.
5. KapurK, JohnsonT, BeckmannND, SehmiJ, TanakaT, et al. (2010) Genome-wide meta-analysis for serum calcium identifies significantly associated SNPs near the calcium-sensing receptor (CASR) gene. PLoS Genet 6: e1001035.
6. EstradaK, StyrkarsdottirU, EvangelouE, HsuYH, DuncanEL, et al. (2012) Genome-wide meta-analysis identifies 56 bone mineral density loci and reveals 14 loci associated with risk of fracture. Nat Genet 44 : 491–501.
7. WangTJ, ZhangF, RichardsJB, KestenbaumB, van MeursJB, et al. (2010) Common genetic determinants of vitamin D insufficiency: a genome-wide association study. Lancet 376 : 180–188.
8. BibertS, HessSK, FirsovD, ThorensB, GeeringK, et al. (2009) Mouse GLUT9: evidences for a urate uniporter. Am J Physiol Renal Physiol 297: F612–619.
9. ZuberAM, CentenoG, PradervandS, NikolaevaS, MaquelinL, et al. (2009) Molecular clock is involved in predictive circadian adjustment of renal function. Proc Natl Acad Sci U S A 106 : 16523–16528.
10. PeacockM (2010) Calcium metabolism in health and disease. Clinical journal of the American Society of Nephrology : CJASN 5 Suppl 1: S23–30.
11. ShuL, JiJ, ZhuQ, CaoG, KaraplisA, et al. (2011) The calcium-sensing receptor mediates bone turnover induced by dietary calcium and parathyroid hormone in neonates. J Bone Miner Res 26 : 1057–1071.
12. ChevalL, PierratF, DossatC, GeneteM, Imbert-TeboulM, et al. (2011) Atlas of gene expression in the mouse kidney: new features of glomerular parietal cells. Physiol Genomics 43 : 161–173.
13. Chabardes-GaronneD, MejeanA, AudeJC, ChevalL, Di StefanoA, et al. (2003) A panoramic view of gene expression in the human kidney. Proc Natl Acad Sci U S A 100 : 13710–13715.
14. MurakamiT, SakaneF, ImaiS, HoukinK, KanohH (2003) Identification and characterization of two splice variants of human diacylglycerol kinase eta. J Biol Chem 278 : 34364–34372.
15. ShulgaYV, TophamMK, EpandRM (2011) Regulation and functions of diacylglycerol kinases. Chem Rev 111 : 6186–6208.
16. WillerCJ, LiY, AbecasisGR (2010) METAL: fast and efficient meta-analysis of genomewide association scans. Bioinformatics 26 : 2190–2191.
17. EstradaK, StyrkarsdottirU, EvangelouE, HsuYH, DuncanEL, et al. (2012) Genome-wide meta-analysis identifies 56 bone mineral density loci and reveals 14 loci associated with risk of fracture. Nature genetics 44 : 491–501.
18. KestenbaumB, GlazerNL, KottgenA, FelixJF, HwangSJ, et al. (2010) Common genetic variants associate with serum phosphorus concentration. J Am Soc Nephrol 21 : 1223–1232.
19. WangK, LiM, HadleyD, LiuR, GlessnerJ, et al. (2007) PennCNV: an integrated hidden Markov model designed for high-resolution copy number variation detection in whole-genome SNP genotyping data. Genome research 17 : 1665–1674.
20. Orho-MelanderM, MelanderO, GuiducciC, Perez-MartinezP, CorellaD, et al. (2008) Common missense variant in the glucokinase regulatory protein gene is associated with increased plasma triglyceride and C-reactive protein but lower fasting glucose concentrations. Diabetes 57 : 3112–3121.
21. BeerNL, TribbleND, McCullochLJ, RoosC, JohnsonPR, et al. (2009) The P446L variant in GCKR associated with fasting plasma glucose and triglyceride levels exerts its effect through increased glucokinase activity in liver. Human molecular genetics 18 : 4081–4088.
22. FranceschiniN, van RooijFJ, PrinsBP, FeitosaMF, KarakasM, et al. (2012) Discovery and Fine Mapping of Serum Protein Loci through Transethnic Meta-analysis. American journal of human genetics 91 : 744–753.
23. ZuberAM, CentenoG, PradervandS, NikolaevaS, MaquelinL, et al. (2009) Molecular clock is involved in predictive circadian adjustment of renal function. Proceedings of the National Academy of Sciences of the United States of America 106 : 16523–16528.
24. SakaneF, ImaiS, YamadaK, MurakamiT, TsushimaS, et al. (2002) Alternative splicing of the human diacylglycerol kinase delta gene generates two isoforms differing in their expression patterns and in regulatory functions. J Biol Chem 277 : 43519–43526.
25. OkadaY, ImendraKG, MiyazakiT, HotokezakaH, FujiyamaR, et al. (2011) High extracellular Ca2+ stimulates Ca2+-activated Cl - currents in frog parathyroid cells through the mediation of arachidonic acid cascade. PLoS One 6: e19158.
26. ZhengH, LiuJ, LiuC, LuF, ZhaoY, et al. (2011) Calcium-sensing receptor activating phosphorylation of PKCdelta translocation on mitochondria to induce cardiomyocyte apoptosis during ischemia/reperfusion. Mol Cell Biochem 358 : 335–343.
27. DjebaliS, DavisCA, MerkelA, DobinA, LassmannT, et al. (2012) Landscape of transcription in human cells. Nature 489 : 101–108.
28. HosoyaT, MaillardI, EngelJD (2010) From the cradle to the grave: activities of GATA-3 throughout T-cell development and differentiation. Immunol Rev 238 : 110–125.
29. GroteD, SouabniA, BusslingerM, BouchardM (2006) Pax 2/8-regulated Gata 3 expression is necessary for morphogenesis and guidance of the nephric duct in the developing kidney. Development 133 : 53–61.
30. HaugasM, LillevaliK, SalminenM (2012) Defects in sensory organ morphogenesis and generation of cochlear hair cells in Gata3-deficient mouse embryos. Hear Res 283 : 151–161.
31. GrigorievaIV, ThakkerRV (2011) Transcription factors in parathyroid development: lessons from hypoparathyroid disorders. Ann N Y Acad Sci 1237 : 24–38.
32. Van EschH, GroenenP, NesbitMA, SchuffenhauerS, LichtnerP, et al. (2000) GATA3 haplo-insufficiency causes human HDR syndrome. Nature 406 : 419–422.
33. BilousRW, MurtyG, ParkinsonDB, ThakkerRV, CoulthardMG, et al. (1992) Brief report: autosomal dominant familial hypoparathyroidism, sensorineural deafness, and renal dysplasia. N Engl J Med 327 : 1069–1074.
34. LakshmananG, LieuwKH, LimKC, GuY, GrosveldF, et al. (1999) Localization of distant urogenital system-, central nervous system-, and endocardium-specific transcriptional regulatory elements in the GATA-3 locus. Mol Cell Biol 19 : 1558–1568.
35. KhandekarM, SuzukiN, LewtonJ, YamamotoM, EngelJD (2004) Multiple, distant Gata2 enhancers specify temporally and tissue-specific patterning in the developing urogenital system. Mol Cell Biol 24 : 10263–10276.
36. Kouros-MehrH, SlorachEM, SternlichtMD, WerbZ (2006) GATA-3 maintains the differentiation of the luminal cell fate in the mammary gland. Cell 127 : 1041–1055.
37. LiS, LiJ, TianJ, DongR, WeiJ, et al. (2012) Characterization, tissue expression, and imprinting analysis of the porcine CDKN1C and NAP1L4 genes. J Biomed Biotechnol 2012 : 946527.
38. OkadaM, HozumiY, IchimuraT, TanakaT, HasegawaH, et al. (2011) Interaction of nucleosome assembly proteins abolishes nuclear localization of DGKzeta by attenuating its association with importins. Exp Cell Res 317 : 2853–2863.
39. XiaoH, ShanL, ZhuH, XueF (2012) Detection of significant pathways in osteoporosis based on graph clustering. Mol Med Report 6 : 1325–1332.
40. LimAL, NgS, LeowSC, ChooR, ItoM, et al. (2012) Epigenetic state and expression of imprinted genes in umbilical cord correlates with growth parameters in human pregnancy. J Med Genet
41. ApostolidouS, Abu-AmeroS, O'DonoghueK, FrostJ, OlafsdottirO, et al. (2007) Elevated placental expression of the imprinted PHLDA2 gene is associated with low birth weight. J Mol Med (Berl) 85 : 379–387.
42. IshidaM, MonkD, DuncanAJ, Abu-AmeroS, ChongJ, et al. (2012) Maternal inheritance of a promoter variant in the imprinted PHLDA2 gene significantly increases birth weight. Am J Hum Genet 90 : 715–719.
43. LewisRM, ClealJK, NtaniG, CrozierSR, MahonPA, et al. (2012) Relationship between placental expression of the imprinted PHLDA2 gene, intrauterine skeletal growth and childhood bone mass. Bone 50 : 337–342.
44. HuangJ, WangL, JiangM, LinH, QiL, et al. (2012) PTHLH coupling upstream negative regulation of fatty acid biosynthesis and Wnt receptor signal to downstream peptidase activity-induced apoptosis network in human hepatocellular carcinoma by systems-theoretical analysis. J Recept Signal Transduct Res 32 : 250–256.
45. MiraliakbariBA, AsaSL, BoudreauSF (1992) Parathyroid hormone-like peptide in pancreatic endocrine carcinoma and adenocarcinoma associated with hypercalcemia. Hum Pathol 23 : 884–887.
46. VanHoutenJ, DannP, McGeochG, BrownEM, KrapchoK, et al. (2004) The calcium-sensing receptor regulates mammary gland parathyroid hormone-related protein production and calcium transport. J Clin Invest 113 : 598–608.
47. LiY, MengG, GuoQN (2008) Changes in genomic imprinting and gene expression associated with transformation in a model of human osteosarcoma. Exp Mol Pathol 84 : 234–239.
48. ArboledaVA, LeeH, ParnaikR, FlemingA, BanerjeeA, et al. (2012) Mutations in the PCNA-binding domain of CDKN1C cause IMAGe syndrome. Nat Genet 44 : 788–792.
49. ZieroldC, ReinholzGG, MingsJA, PrahlJM, DeLucaHF (2000) Regulation of the procine 1,25-dihydroxyvitamin D3–24-hydroxylase (CYP24) by 1,25-dihydroxyvitamin D3 and parathyroid hormone in AOK-B50 cells. Arch Biochem Biophys 381 : 323–327.
50. ShinkiT, JinCH, NishimuraA, NagaiY, OhyamaY, et al. (1992) Parathyroid hormone inhibits 25-hydroxyvitamin D3–24-hydroxylase mRNA expression stimulated by 1 alpha,25-dihydroxyvitamin D3 in rat kidney but not in intestine. J Biol Chem 267 : 13757–13762.
51. ShimadaT, HasegawaH, YamazakiY, MutoT, HinoR, et al. (2004) FGF-23 is a potent regulator of vitamin D metabolism and phosphate homeostasis. J Bone Miner Res 19 : 429–435.
52. WohrleS, BonnyO, BeluchN, GaulisS, StammC, et al. (2011) FGF receptors control vitamin D and phosphate homeostasis by mediating renal FGF-23 signaling and regulating FGF-23 expression in bone. J Bone Miner Res 26 : 2486–2497.
53. PerwadF, ZhangMY, TenenhouseHS, PortaleAA (2007) Fibroblast growth factor 23 impairs phosphorus and vitamin D metabolism in vivo and suppresses 25-hydroxyvitamin D-1alpha-hydroxylase expression in vitro. Am J Physiol Renal Physiol 293: F1577–1583.
Štítky
Genetika Reprodukční medicínaČlánek vyšel v časopise
PLOS Genetics
2013 Číslo 9
Nejčtenější v tomto čísle
- A Genome-Wide Systematic Analysis Reveals Different and Predictive Proliferation Expression Signatures of Cancerous vs. Non-Cancerous Cells
- Recent Acquisition of by Baka Pygmies
- The Condition-Dependent Transcriptional Landscape of
- Histone Chaperone NAP1 Mediates Sister Chromatid Resolution by Counteracting Protein Phosphatase 2A