
Generation of Antigenic Diversity in by Structured Rearrangement of Genes During Mitosis
Malaria kills >600,000 people each year, with most deaths caused by Plasmodium falciparum. A family of proteins known as P. falciparum erythrocyte membrane protein 1, PfEMP1, is expressed on the surface of infected erythrocytes and plays an important role in pathogenesis. Each P. falciparum genome contains approximately 60 highly polymorphic var genes encoding the PfEMP1 proteins, and monoallelic expression with periodic switching results in immune evasion. Var gene polymorphism is thus critical to this survival strategy. We investigated how var gene diversity is generated by performing an in vitro evolution experiment, tracking var gene mutation in ‘real-time’ with whole genome sequencing. We found that genome structural variation is focused in and around var genes. These genetic rearrangements created new ‘chimeric’ var gene sequences during the mitotic part of the life cycle, and were consistent with processes of mitotic non-allelic homologous recombination. The recombinant var genes were always in frame and with conserved overall var gene architecture, and the recombination rate implies that many millions of rearranged var gene sequences are produced every 48-hour life cycle within infected individuals. In conclusion, we provide a detailed description of how new var gene sequences are continuously generated in the parasite genome, helping to explain long-term parasite survival within infected human hosts.
Published in the journal:
. PLoS Genet 10(12): e32767. doi:10.1371/journal.pgen.1004812
Category:
Research Article
doi:
https://doi.org/10.1371/journal.pgen.1004812
Summary
Malaria kills >600,000 people each year, with most deaths caused by Plasmodium falciparum. A family of proteins known as P. falciparum erythrocyte membrane protein 1, PfEMP1, is expressed on the surface of infected erythrocytes and plays an important role in pathogenesis. Each P. falciparum genome contains approximately 60 highly polymorphic var genes encoding the PfEMP1 proteins, and monoallelic expression with periodic switching results in immune evasion. Var gene polymorphism is thus critical to this survival strategy. We investigated how var gene diversity is generated by performing an in vitro evolution experiment, tracking var gene mutation in ‘real-time’ with whole genome sequencing. We found that genome structural variation is focused in and around var genes. These genetic rearrangements created new ‘chimeric’ var gene sequences during the mitotic part of the life cycle, and were consistent with processes of mitotic non-allelic homologous recombination. The recombinant var genes were always in frame and with conserved overall var gene architecture, and the recombination rate implies that many millions of rearranged var gene sequences are produced every 48-hour life cycle within infected individuals. In conclusion, we provide a detailed description of how new var gene sequences are continuously generated in the parasite genome, helping to explain long-term parasite survival within infected human hosts.
Introduction
Plasmodium falciparum is a unicellular parasite that causes malaria in humans. It infects over 300 million people per year and is estimated to have killed 600,000–1.2 million people in 2010 [1]. One of the most remarkable biological features of P. falciparum is an exceptionally polymorphic parasite antigen expressed on the surface of infected erythrocytes, known as P. falciparum erythrocyte membrane protein 1 (PfEMP1) [2]. PfEMP1 is encoded by a family of hypervariable genes known as var, each representing a different antigenic form, and the parasite is able to vary its antigenic profile by switching expression between different var genes [3]. This allows the parasite to evade the human immune system and has major clinical consequences, as PfEMP1 mediates the cellular interactions and pathological properties of infected erythrocyte [4]–[6].
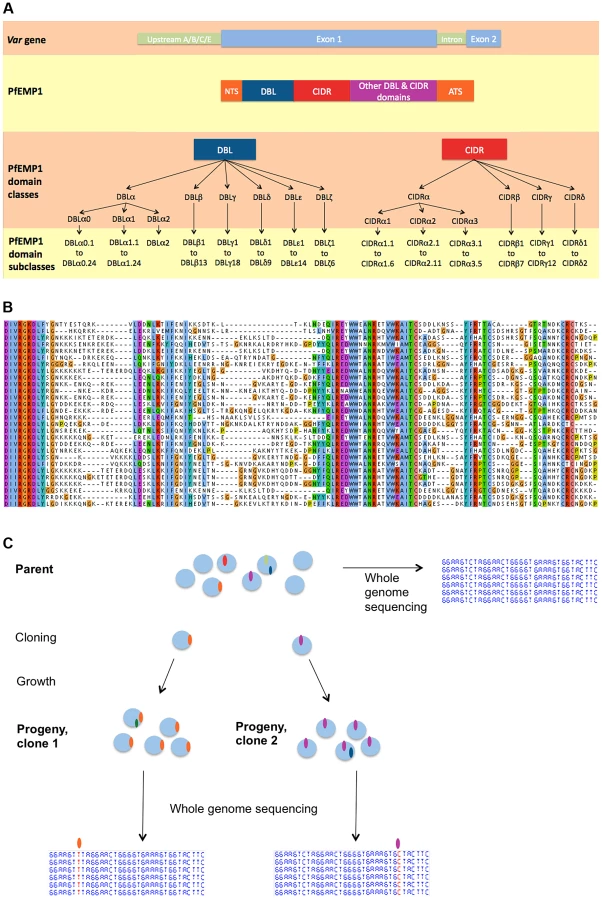
Each parasite genome contains approximately 60 var genes distributed in clusters across most of the 14 chromosomes. Based on conserved sequences upstream of the coding region, var genes are divided into three main groups. Group A var genes, which are confined to subtelomeric regions, have been shown by in vivo gene expression studies to be involved in the pathogenesis of severe malaria [2]. Group C var genes are found only in internal chromosomal regions while group B var genes occur both within chromosomes and at the subtelomere. Despite being the most polymorphic gene family in P. falciparum, var genes share broad structural similarities and some conserved motifs (Fig. 1A). The first exon (4–10 kb) begins with an N-terminal segment (NTS) and is followed by a succession of Duffy Binding Like (DBL) and cysteine rich interdomain regions (CIDR) domains. The second exon is semi-conserved and encodes the intracellular component of PfEMP1. Based on distance tree analysis, DBL domains are subdivided into six major classes (DBLα, β, γ, δ, ε, ζ) and CIDR domains into four (CIDRα, β, γ, δ) [7]. Each class can then be further subdivided into subclasses (DBLα0.1, DBLα0.2, etc) [8].
Previous studies have observed ectopic (non-allelic) recombination between subtelomeric var genes [9]–[13] and it has been proposed that this might account for a large part of the var gene diversity observed within and between species [14]. However it is not known whether var gene recombination is sufficiently frequent to be the primary driver of var gene diversity, nor whether this recombination occurs mainly in meiosis, which takes place in the mosquito, or during mitosis, which includes the entirety of the intraerythrocytic stages within the human host. It is also unclear whether recombination obeys particular patterns, and how this might relate to var gene structure. Understanding how the parasite manages to generate such an extreme level of sequence diversity while preserving the overall architecture and biological functionality of the var gene repertoire is fundamental to understanding P. falciparum pathogenesis.
We used an experimental evolution approach to systematically investigate the mechanisms that drive var gene diversity, performing whole genome sequence analysis on>200 clonal parasites. Parasites cultured in vitro in human erythrocytes were regularly sub-cloned to isolate single infected red blood cells, so that mutations arising in asexually dividing cells could be detected using whole genome sequencing of the expanded progeny derived from these cells (Fig. 1C). We generated these ‘clone trees’ for geographically diverse P. falciparum strains, comparing parasite genomes separated by 20–30 cycles of replication (S1 Fig.). The scale of our dataset allowed us to perform a comprehensive analysis of mitotic var gene recombination using observed recombination events for the first time. This revealed how var gene sequence polymorphism – and, by inference, parasite antigenic variation – can be continuously generated during asexual division over the course of a single human infection.
Results
Structural variation is focused in and around var genes in 3D7
We began by analysing the 3D7 strain of P. falciparum as this has the most complete genome assembly of any lab isolate. 19 individual parasites were cloned from 3D7 by limiting dilution and cultured until sufficient parasite quantity was reached for whole genome sequencing. From 2 of these 19 subclones, another 3 rounds of clonal dilutions were performed over a combined culturing period of 203 days (S1 Fig.). Whole-genome sequencing of a total of 37 subclones identified 20 de novo single nucleotide substitutions (hereafter referred to as Single Nucleotide Polymorphisms or SNPs) distributed throughout the genome, and 40 de novo structural variations comprising 10 duplications, 8 deletions and 22 translocations (Fig. 2, S2–S4 Table). Our analysis focused solely on de novo mutations, i.e. found in one or more subclone(s) but not in the parental clone. As expected, the first generation of subclones contained more mutations than subsequent generations, because they were derived from a standard 3D7 culture that had been growing for several months prior to beginning our experiment. Of the 19 structural variations that affected coding regions, all were in var genes. Of the remaining 21 structural variations, all were in telomeric regions or within internal regions of chromosomes that contained clusters of var genes. From these data we concluded that de novo structural variations of the P. falciparum genome occur relatively frequently during the mitotic intraerythrocytic life cycle and are highly concentrated in and around var genes.

Detailed inspection of these structural variations revealed that they took many forms (Fig. 3B–F) but all involved ectopic recombination between different var genes located either in the immediate vicinity on the same chromosome, or on different chromosomes. For example, Fig. 3A&B and S2 Fig. show a gene conversion event involving two subtelomeric var genes, in which the end subtelomere of chromosome 4 was duplicated and replaced the subtelomere of chromosome 9. The translocation breakpoints occurred within var genes on these two chromosomes, referred to as var4 and var9, creating a chimeric var4/var9 sequence. This gene conversion event was confirmed by capillary sequencing of PCR products, and the var4/var9 chimera was subsequently inherited by downstream parasite clones. There were also instances of two var genes recombining with multiple crossover points (Fig. 3D, S3 & S4 Fig.) and recombination between more than two var genes (Fig. 3E and Fig. S2). Recombination in subtelomeric var genes involved both reciprocal exchange and non-reciprocal gene conversion in which the entire end of one chromosome was duplicated and replaced the corresponding section of the other chromosome. In addition to recombination between subtelomeric var genes on different chromosomes, we found recombination between internal var genes on the same chromosome (Fig. 3F, S5 & S6 Fig.).

Var gene exon 1 recombination is a frequent mitotic event in diverse P. falciparum strains
To establish whether mitotic var gene recombination is a common feature among other P. falciparum strains, we generated similar clone trees for the Dd2 and W2 strains of drug-resistant P. falciparum from Southeast Asia, and for the HB3 strain of drug-sensitive P. falciparum from Honduras (S1 Fig.). The Dd2, W2 and HB3 clone trees were generated with a total of 7, 3, and 8 cloning rounds respectively, over a total of 298, 119 and 250 days. This generated 56, 20 and 81 subclones respectively, all of which were whole genome sequenced. Altogether, we observed 20, 11 and 19 SNPs in the Dd2, W2 and HB3 clone trees respectively, scattered across the genome (Fig. 2). As any mutation identified in a clone would have actually occurred in the previous generation, we can only use clones from the second generation onwards for calculating mutation rates (Fig. 1C). From these data we estimate mutation rates of 4.07×10⁻¹⁰, 3.63×10⁻¹⁰ and 3.78×10⁻¹⁰ SNPs per erythrocytic life cycle per nucleotide for 3D7, Dd2 and HB3 respectively (Table 1). The W2 clone tree did not contain enough clones for a reliable mutation rate estimate. Despite geographic and drug-sensibility differences between 3D7, Dd2 and HB3, there is no statistically significant difference in SNP mutation rate between these strains (Kruskal-Wallis, p>0.7); See Methods & Table 1 for rate calculations. The rates calculated here are similar to estimates for 3D7 and Dd2 by Bopp et al 2013, suggesting that SNP mutation rates are relatively constant across P. falciparum strains.

A complete high-quality genome assembly is currently only available for 3D7, which makes mapping difficult in other strains, especially in var genes. For these strains we therefore focused only on a detailed analysis of recombination events in var exon 1, which encodes the extracellular domains responsible for antigenic diversity. In Dd2 and W2, we observed 11 and 13 instances of var exon 1 recombinations in 7 and 6 pairs of recombining var genes respectively (Table 2). In contrast, there were no recombination events in HB3 clones, despite similar breadth and length of the clone trees and despite the var gene assemblies of HB3 and Dd2 being of a comparable standard.

We estimate that the rate at which pairs of var genes undergo exon 1 recombination in the Dd2 clone tree is 2.32×10⁻³ per erythrocytic life cycle, compared with 9.48×10⁻³, 8.47×10⁻³ and 8.81×10⁻³ SNPs per life cycle in 3D7, Dd2 and HB3 respectively (see Methods for rate calculations). This means that in the Dd2 strain, for every 48-hour intraerythrocytic generation approximately 0.2% of parasites will have undergone a var exon 1 recombination event producing a new chimeric var gene.
We further analysed the var gene recombination rate by comparing the ratio of total de novo var recombinations to SNPs observed in the clone trees. Our mutation rate calculations given above exclude mutations found in the first generation of each clone tree because these mutations occurred prior to our beginning the experiment after an unknown length of time in culture (Fig. 1C). However, mutations identified in this first clone tree round must have arisen during the intraerythrocytic stage, at some point between the original cloning of 3D7/HB3/Dd2 in the 1980s and the start of our clone tree experiments. As demonstrated in this study and in Bopp et al [9], the SNP mutation rate appears to be relatively constant between strains. Therefore, the number of SNPs found in first generation subclones becomes a proxy for the time of culture of the parent, i.e. the more SNPs identified, the longer the parent had been in culture since the original cloning step. Because of this constant SNP mutation rate, we can use all subclones, including the first generations subclones, to measure the ‘var recombination/SNP ratio’, which indicates the number of var recombinations over a period of time. The overall var exon 1 recombination to SNP mutation ratio is 0.25, 0.35, 0.54 and 0 in the 3D7, Dd2, W2 and HB3 clone trees respectively (Table 2). Thus, while the SNP mutation rate is constant between different P. falciparum strains, the structural variant rate in HB3 var genes is significantly lower than in Dd2 (p = 0.03, Fisher's exact test), at least with the specific HB3 isolate used in our laboratory.
The dynamic nature of var recombination in Dd2 is illustrated by a pair of internal var genes referred to here as var34 and var45 (Fig. 4). Recombination between var34 and var45 was first observed in a first generation subclone of the Dd2 clone tree (Dd2_(A)1a). This was a double crossover recombination which created a new chimeric var gene (‘var34/var45’) while retaining the original versions of var34 and var45 (Fig. 3C, Fig. 4, S7 Fig.). Over the next three generations of the clone tree, most of the 31 descendants of the recombined clone inherited var34, var45 and the var34/var45 chimera, with a few exceptions. Three descendants lost the var34 sequence, two lost the var34/var45 chimera, and two underwent further recombination of var34 and var45 producing new chimeras. In contrast, we observed no changes involving var34 or var45 in the branch of the clone tree that was not descended from the clone in which recombination between var34 and var45 had first occurred.

Var gene exon 1 recombination is structured such that overall var gene architecture is preserved
The clone trees demonstrate that var gene recombination during intraerythrocytic growth is extensive and complex, and in at least three strains occurs nearly as frequently as SNPs. To investigate the patterns and mechanisms of var gene recombination, we collated all available data on chromosomal crossovers in var exon 1 (Table 1) based on our clone tree experiments, together with data from previous smaller studies [9], [15] as well as data obtained by sequencing the progeny of three genetic crosses (Dd2xHB3, 3D7xHB3 and 7G8xGB4) [16]–[18] (Pearson & Miles, in prep) (discussed in more detail below). From these combined datasets we identified 110 crossovers in 46 pairs of var gene exon 1s, generating a mean of 2.4 (range 1–12) crossover points per recombining pair of exons (Table 2, S4 and S8 Fig.).
These data revealed a highly structured pattern of ectopic recombination. We found that all of the crossovers were in frame and in the vast majority of cases (109/110) the recombining sequences were of the same domain class, e.g. CIDRα almost invariably recombined with CIDRα (Fig. 5). Every var gene begins with a DBLα and CIDRα domain, followed by a variable number and order of other domains. Given that recombination only occurs between the same domain classes, this mechanism would preserve the overall architecture of chimeric var genes. Consistent with this, all observed chimeric var genes possessed a typical number of var domains. We observed only one exception to this, between 7G8var49 and 7G8var56, in which recombination took place in an area of shared homology between a DBLα and a DBLδ domain [8], producing a truncated gene with only two domains (S8 Fig.).

The new gene sequences generated by this structured process were extremely diverse, as var genes did not necessarily recombine with the most highly homologous var genes to themselves (S9 Fig.). The average sequence identity of the two recombining domains was 68%, and that of the two recombining exons was only 63%. In the terminology used by Rask et al, 65% of recombinations were between domains of different sub-classes (Fig. 6). But despite this overall diversity, we observed that crossovers invariably took place within a short section of perfect sequence identity ranging in length from 4 to 48 bp (median 15 bp). This section of sequence identity, which we refer to here as an identity block (S10 Fig.), was typically located within a broader section of elevated sequence homology (median 80 bp) relative to the average for the two genes concerned (Fig. 6). When exon 1 var sequences were aligned by BLAST analysis, 94% of crossovers were found to occur in a region of high similarity between the two recombining genes (S11 Fig.), whereas only 59% would be expected if the point of recombination was random (P<10−5 by chi-squared test).

We compared the recombination rates found in group A, B and C var genes from our pooled var exon 1 recombination dataset. In total, we observed 19 instances of B×B recombination, 12 instances of C×C recombination and 2 instances of B×C recombination. In contrast we observed no instances of recombination involving group A var genes. The 3D7 reference genome contains 10 group A, 37 group B and 13 group C var genes, so these observations depart significantly from what would be expected if the pairing of ectopic sequences was random across all var genes, (p = <0.0028, Fisher's exact test). These data suggest that group A var genes have a lower recombination rate than group B or C.
Analysis of experimental genetic crosses indicates that var gene recombination occurs mainly during mitosis
The prevailing view of var recombination is that it occurs primarily during meiosis, based on the observation of recombination in the progeny of experimental crosses [10], [19]. An alternative model is that var recombination in these progeny actually occurred during mitosis while the parasites were cultured in vitro prior to and after the cross itself [20]. To test these alternatives we identified and characterised var recombinations in genome sequence data from progeny of all three experimental genetic crosses, and compared them with analogous data from progeny of our clone trees. This comparison strongly supported the latter model – that the vast majority of var recombination occurs during mitosis – for three main reasons (Fig. 7). First, the recombination in both the (purely mitotic) clone trees and the crosses progeny share key features and appear to have been produced through the same process. Recombined var genes were always in frame without SNPs or InDels; crossovers took place in small regions of sequence identity; overall var exon 1 domain architecture was preserved because domains only recombined with other domains of the same class (with one exception), and recombination often involved multiple crossovers between the same two var genes, with an average of 2.6 and 2.4 crossovers per recombining var pair in the clone trees and crosses progeny respectively (S7 Table). Second, within the crosses progeny we could find only two cases where the var genes in a recombining var pair were derived from different parents. This is not what would be expected if recombination occurred during meiosis when the parasite was diploid. During meiosis, each progeny inherits on average half its chromosomes and associated var genes from each parent. If heterologous chromosomes only recombined at that stage, we should observe chimeric var sequences derived from var genes of different parents or from the same parent in an approximately 50∶50 ratio (Fig. 7). In contrast, we found that 26 out of 28 recombinations were ‘intra-strain’, i.e. involving pairs of var genes from the same parent. The simplest explanation is that these recombination events occurred during mitosis while the parental strains were in culture prior to the cross.

Finally, knowing the average mitotic var recombination rate calculated using our clone trees allows us to test whether the number of var recombination events observed in the crosses progeny is consistent with the culturing time before and after the cross. In our clone trees and other experiments [9], the SNP mutation rate is similar across strains (see above). Thus, the number of SNP mutations in a subclone is directly proportional to the number of intraerythrocytic life cycles that occurred before the last cloning step. The number of days of culture can then be inferred from the number of SNP mutations observed. Based on the number of de novo SNPs identified in the crosses progeny and our mitotic SNP mutation rate, we calculated that the P. falciparum strains used for the crosses had undergone 124 and 133 days of in vitro culturing for 3D7xHB3 and HB3xDd2 respectively. i.e. there had been 124 and 133 days in culture from when the original isolates were first sub-cloned (from NF54 for 3D7, H1 for HB3, etc), to the day the crosses' progeny were cloned out. For 3D7xHB3 and HB3xDd2, these estimates could be validated by direct comparison with the actual known culturing data of the parental clones, provided by Tom Wellems (NIH) and Lisa Ranford-Cartwright (University of Glasgow). The total recorded culture time, from isolation to progeny sub-cloning, was 89.5 and 99.5 days for the 3D7 and HB3 parasites used in the 3D7xHB3 cross – an average of 94.5 days. The equivalent time for the HB3 and Dd2 parasites used in the HB3xDd2 cross was 89 and 138 days respectively – an average of 113.5 days. These actual dates are very similar to the dates prdicted by our mutation analysis, which suggested that the 3D7xHB3 and HB3xDd2 isolates used for the crosses had been cultured for 124 and 133 days, where the real culture times were reassuringly close at approximately 94.5 and 113.5 days respectively (S7 Table). If we assume that the average mitotic var recombination rate is 6.44×10⁻⁴ recombinations per life cycle (the mean from the recombination rates calculated in the 3D7, Dd2, W2 and HB3 clone trees), then we would expect to find about 0.34 var recombinations per progeny sample. Again, these predictions, which are based on purely mitotic recombination, are very similar to what we observe: 0.38, 0.20 and 0.59 in 3D7xHB3, HB3xDd2 and 7G8xGB4, respectively. Therefore, the number of var recombinations found in the crosses progeny is consistent with what is expected from the number of mitotic events that the parasites have gone through both before and after the cross. No additional input of recombination from meiosis is required to explain the data.
Discussion
By analysing whole genome sequences from hundreds of subclones derived from asexually replicating parasites, we have generated a large dataset of mitotic mutations in the P. falciparum genome. We found that var genes of groups B and C undergo ectopic recombination at a rate which greatly exceeds that of structural variation in other parts of the P. falciparum genome, and is not dissimilar to the SNP mutation rate. Recombining var genes often have low levels of sequence homology, and a pair of var genes can recombine at different positions on different occasions, so the new var sequences generated by this process are extremely diverse. However, the recombinant sequence is invariably in frame and free of errors, and var gene domain architecture is preserved. This process has presumably evolved to generate antigenic diversity in P. falciparum during the course of a single infection to evade the human immune response.
Our SNP and structural variant detection method by whole-genome sequencing was validated by PCR, capillary sequencing or both (S2–S4 Table). Sander et al recently published an analysis of var gene recombination in progeny of 3D7xHB3 and HB3xDd2 [19]. They reported that recombination breakpoints are concentrated near low folding free energy DNA 50-mers, with a minimal required sequence identity of around 20 bp with 10% mismatch. Three out of the four progeny samples in which they identified var recombinations were available to us. We independently found the exact same var recombination breakpoint coordinates, and came to the same conclusion that crossover events take place within short regions of high homology.
Generating diversity by structured recombination of regional gene segments is somewhat analogous to the way in which the vertebrate immune system generates diversity by V(D)J recombination of immunoglobulin and T cell receptor genes. However, our data show that the molecular mechanism of var gene recombination is markedly different from that of V(D)J recombination in two respects. First, the site of recombination was not marked by any specific sequence motif equivalent to the 'Recombination Signal Sequence' that targets recombinases in V(D)J recombination (S15 Fig.), and we observed instances of the same pair of var genes recombining at different positions on separate occasions (S8 Fig.). Second, V(D)J recombination depends on repair of DNA double-strand breaks (DSBs) by non-homologous end joining (NHEJ), a molecular pathway that appears to be missing or atypical in P. falciparum [21], [22]. All the instances of ectopic recombination we observed were achieved without errors or indels, indicating that the mechanism of DSB repair is more similar to homologous recombination (HR) than NHEJ, as this is generally high fidelity whereas NHEJ is error-prone. It is interesting to note that, lacking a typical NHEJ system, P. falciparum is presumably reliant on the machinery of HR for DSB repair. This is somewhat paradoxical given that the parasite is haploid for the majority of its life cycle, including the entirety of the mitotic intraerythrocytic stages. It therefore lacks homologous chromosome copies to use as templates for HR-mediated DSB repair. These conditions may be conducive for non-allelic homologous recombination during mitosis, with non-allelic templates being employed in the absence of homologous chromosomes.
While the pattern of var gene recombination therefore differs from well-known methods for generating diversity, it is also strikingly different from conventional HR in which crossovers take place in a region of extremely high sequence homology (>92%), typically extending over hundreds of base pairs [23]. Without extensive homology as a cue for pairing sequences from different regions of the genome, some alternative mechanism must exist for co-localisation of var genes before initiation of the recombination-inducing lesion [24]. Var genes are located in more than 30 regions of the genome, i.e. in most subtelomeric regions and in internal regions of four chromosomes. P. falciparum telomeres are tethered to the nuclear periphery where they form several distinct clusters [10] and it has been demonstrated by FISH that both subtelomeric and internal var genes aggregate within these clusters [25]. This nuclear clustering is believed to play an important role in the transcriptional activation and silencing of var genes [25] and it might also be a mechanism of co-localising sequences from different regions of the genome prior to ectopic recombination [10].
Our genome-wide approach in 3D7 subclones identified structural variants in and around var genes, indicating that these regions are more recombinogenic. In these samples, we did not observe any recombination in other variant surface antigen families such as rifin or stevor, despite the fact that there are nearly three times as many rifin genes as var genes in the genome. The rate of var gene recombination differed depending on var gene Ups type and parasite strain. We found a lower rate of recombination in HB3 than in 3D7, Dd2 or W2 parasites. The HB3 genome does not appear to be unable to recombine var genes per sec, as we did identify a recombined exon 1 var gene in the 'parent' strain used for one of our two HB3 clone trees and all clonal descendants from that parent inherited the recombined var gene. We cannot use this example to measure the recombination rate because we do not know the time in culture prior to performing our first clonal dilution, but the observation indicates that mitotic var exon 1 recombination in HB3 does occur, although perhaps at a rate that is too slow to be detected over the course of our clone trees. We have also observed instances of var recombinations in genetically modified HB3 lines (Hamilton et al, manuscript in preparation). A longer time in culture between clonal dilutions, or more clones per dilution, or both, would be necessary to capture enough var recombination events in this strain to determine its rate accurately. What factors influence var gene recombinogenicity, and whether there is a connection with drug resistance, remains to be determined. It is possible that HB3 is inherently less recombinogenic than other strains, or that the particular HB3 isolate we used in our clone experiments had, for unknown reasons, lost or reduced its capacity to undergo var recombination. Moreover, although var gene recombination in recently adapted P. falciparum field isolates does occur (Hamilton et al, manuscript in preparation), the frequency of such events in the wild and in vivo is currently unknown.
The fact that recombination was more common in group B and C var genes is consistent with the observation that group A vars from geographically diverse strains are more conserved than those of groups B and C [26]. Var recombination group-specificity also has implications for the underlying mechanism, raising the possibility that the upstream sequence or some other group-specific sequence feature plays a role in co-localising var genes prior to recombination. Var genes can also be classified into six groups based on their DBLα sequences [27]. However there was no association between var recombination and that specific subgrouping (Chi-square, p>0.40). Whether some specific var genes are inherently more recombinogenic than others, as the Dd2var34/var45 example could suggest, requires an even larger dataset, perhaps involving several years of clone tree evolution, to properly assess. Further studies such as these will also be required to test the hypothesis that specific var genes being actively expressed in a given strain are more likely to recombine. If the latter hypothesis is true, it would partly explain the lack of recombination in group A genes that we observed, as cultured lab strains typically express very few, if any, of that subgroup [28]. It would also fit with the hypothesis that longer and more conserved var genes show a lower activation rate and lower sequence diversity [29]. Further investigation into DNA repair and recombination in P. falciparum will be essential to identify the precise molecular mediators of var recombination and elucidate the mechanism in full.
To date, var gene diversity has typically been studied using short DBLα tag sequences from field isolates [30], [31], or from 7 sequenced lab strains [8], [26], [32]. In either case, these var sequences represent snapshots of diversity at a particular time and place. They reflect the polymorphism found in the wild, under the intense pressure of the human immune system. Our study uses a novel approach to analyse var gene sequences as they are being generated, i.e. without any immunological selection. However, it has to be noted that lethal recombinations, for example between internal and subtelomeric var genes, would never be observed due to the resulting loss of genetic material. But only selection-free experiments such as this one can accurately measure the var recombination rate and the diversity of chimeric sequences being generated. As var gene assemblies from worldwide sampling will become available (Otto et al, manuscript in preparation), it will be of major interest to compare the sequence diversity under selection versus our dataset, for example to differentiate true recombination hotspots from selection hotspots. This will also help modelling studies to define and test recombinational constraints [32].
Comparison with our clone tree data suggests that much of the var gene recombination observed in the progeny of experimental genetic crosses likely arose during mitosis prior to the cross itself (Fig. 7). The dominance of mitotic recombination is inherent to the fact that the life cycle of P. falciparum consists of a single meiotic event for dozens or hundreds of mitoses. We propose a model whereby var gene sequence polymorphism is mainly generated during the asexual part of the life cycle, while meiosis has the crucial function of creating a new repertoire of ∼60 var genes from two different parents. There is also a clear biological advantage in having extensive recombination in antigen-coding genes take place during mitosis: it allows the continuous generation of antigenic diversity inside a human host over the course of a single infection. An adult with malaria fever typically carries on the order of 107 to 1010 infected erythrocytes (parasitaemia 5 to 5,000 parasites/µl), so this implies that on the order of 104 to 108 new mosaic var gene sequences could be generated through recombination every two days in a single infected individual. Var gene expression is a mechanism of immune evasion, enabling parasitized erythrocytes to sequester in small blood vessels and thus avoid circulation through the spleen. But var genes are themselves the targets of host immunity as they elicit a strong antibody response, which the parasite evades by switching expression between different var genes. Ectopic recombination of var genes may be of limited value in the initial phase of infection, as each new var sequence is present in only a tiny fraction of parasites. However it could be of great importance in chronic asymptomatic infection, which is increasingly recognized a crucial problem for malaria elimination [33]. As infection progresses, the parasite population carried by a single individual has the potential to accumulate an almost limitless repertoire of antigenic variants, thus allowing the evolutionary selection of variants which are best equipped to evade the immune response in that particular individual over a protracted period of time.
Materials and Methods
P. falciparum culture and clone tree generation
Our 3D7 ‘parent’ clone was provided by Bob Pinches. It was one of several 3D7 reference stabilates produced in 1989 following the isolation of 3D7 from NF-54. Thus, its genome should be very close to the canonical 3D7 reference genome. Dd2, W2 and HB3 parasites were obtained originally from the Malaria Research and Reference Reagent Resource Center (MR4). All P. falciparum strains were cultured in human O+ erythrocytes with heat-inactivated 10% pooled human serum as in [34]. For the clonal dilution step, parasites were ultra-diluted into a 96-well plate, to reach a theoretical concentration of 0.2 to 0.5 parasites per well, supplemented with 100 µl of complete medium at 2% haematocrit. The chamber was gassed every 2–4 days with medium changes on day 4, 12 and 20 and 50% dilution with fresh 2%hct medium on day 8, 16 and 24. Positive wells were identified by medium colour change confirmed microscopically after day 16–24 post clonal dilution. The clones were further cultured in either 6-well plates or 10 ml flasks at 4–5%hct. Cultures were pelleted, mixed with RPMI to a total volume of 2 ml and frozen at −80°C for DNA extraction (see below), with most clones also being frozen in glycerolyte for reculture. After 1–2 months growth, one clone was arbitrarily selected for the next round of clonal dilution.
DNA extraction, quantification and whole-genome sequencing
DNA extraction was performed with Qiagen whole blood midi kits [12145] following the manufacturer's instructions. DNA was quantified using Qubit 2.0 Fluorometer (Invitrogen, Carlsbad, CA, USA) according to manufacturer's instructions, with 1 µl from the extraction step. An average of 2 µg DNA (range 1–5 µg) per sample was submitted in 100 µl volume for PCR-free library preparation for next generation sequencing on the Illumina HiSeq, as described in [35], except without the initial PCR amplification step.
Mapping to reference genome
All whole-genome sequencing output samples (100 bp paired-end reads) were processed through the MalariaGEN pipeline, as described in [35]. Briefly, FASTQ files were mapped to the P. falciparum 3D7 reference genome (PlasmoDB version 5.5) using BWA with default parameters (See S1 Table for coverage of each sample). For HB3, Dd2 and W2, the resulting BAM files were also mapped to the HB3 and Dd2 genomes from BROAD (assembled in 1187 and 2837 supercontigs, respectively) and to a Dd2 assembly made following the PAGIT protocol [36] (14 chromosomes +636 contigs, by T. Otto, unpublished data). When an in silico control was needed, these reference genomes were modified according to the predicted chromosomal rearrangements. For the discovery of translocations within var genes, samples were also mapped to each var sequence from their respective strain (sequences from [8]). This allows the identification of potential translocations between var genes that are located on the same chromosome.
SNP calling
SAMtools mpileup followed by BCFtools were used for SNP detection [37]. Parent samples were analysed with the default parameters except for the following changes: Extended BAQ computation, unlimited read depth, use Bayesian inference, “−P” option <0.9 (probability that the site is a variant). Progeny samples were analysed with the following parameters: Extended BAQ computation, unlimited read depth, use Bayesian inference. The strict filter for progeny samples directly removes false positives. As the downstream analysis only keeps de novo SNPs called in progeny but not in parent, the looser filter for parent samples set here is also directed to remove false positives. Each progeny VCF file was then parsed using R with the following criteria: variant Quality >120, mapping quality >25, reject bi - or tri-allelic calls, at least 5 non-ref reads, number ref reads less than 20% of all reads. From this output list, each potential SNP was then visualised on LookSeq [38], an online tool in which sequence coverage is represented by a pile-up of blue reads matching the 3D7 reference genome, with mismatches in red. Finally, 95% of all detected SNPs had maximal quality (222) and a mapping quality >54. Note that a “progeny” sample was also analysed as a “parent” if that sample was subcloned.
Detection of structural variants
In order to detect translocations involving var genes located on the same chromosome, reads from each sample were mapped with BWA to separate var gene sequences, i.e. each var sequence is considered its own “chromosome”.
DELLY identifies structural variation (>150 bp) by integrated paired-end and split-read analysis [39]. Paired ends mapping to loci with an increased or reduced spacer distance relative to what is expected based on insert size suggests either a deletion or an insertion, respectively. Face-away reads with increased spacer distance and higher coverage is suggestive of a duplication, and reads mapping to different chromosomes (‘trans-locus reads’) indicate a translocation (or recombination). DELLY was run on each 3D7-mapped BAM file, as well as all var gene mapped BAM files, with default parameters. For deletions and duplications, outputs were parsed to a minimum of 20 reads and a maximum distance of 50,000. For translocations, outputs were parsed to a minimum of 10 reads. Similar to SNP detection, non-specific hits were discarded by detecting structural variants in progeny that were also identified in parents. All resulting hits were inspected on LookSeq.
Progeny clones from the P. falciparum crosses 3D7xHB3 [18] (16 samples +2 parents), 7G8xGB4 [16] (27 samples +2 parents) and HB3xDd2 [17] (30 samples +2 parents) were whole genome sequenced as part of another genetic study (Miles, Pearson et al, manuscript in preparation). These clones were also searched for var gene translocations.
Validating SNPs and structural variants
SNPs were validated by PCR amplifying a 150–800 bp fragment containing the putative SNP and capillary sequencing the PCR product (S6 Table).
Chimeric var genes identified by DELLY were validated through PCR, by designing primers that bridge the putative translocation site and only amplify product in samples possessing that translocation (S6 Table). The chimeric PCR product was then sub-cloned into a pCR Blunt-end Invitrogen vector backbone and 1–3 positive clones were capillary sequenced.
Quantitative real time PCR (qPCR) was used to validate copy number variations (CNV) in var genes. Primers were designed flanking the putative translocation site in the PF3D7_0421100-0421300 chimera on chromosome 4. Assay was conducted in triplicate on a 96 well plate using a Roche Light Cycler 480 real-time PCR system. We estimated gene copy number relative to wild type 3D7, and normalized samples against the AMA1 gene (which has one copy in 3D7). Conditions as described in [40], [41].
Calculating the SNP mutation and var exon 1 recombination rates
We estimated the SNP mutation rate per life cycle for each generation in the 3D7, Dd2 and HB3 clone trees, based on the number of SNPs identified per clone within that generation, and the number of life cycles since the previous clonal dilution:

Where is the SNP mutation rate per life cycle for that clonal dilution generation, ∑S is the total number of SNPs identified for all the clones in that clonal dilution generation, ∑C is the total number of clones that were analysed in that clonal dilution generation, L is the number of life cycles that took place between the previous clonal dilution and the current one (see below), and G is the Genome size, taken as 23.3×10⁶ bp [42]. The number of life cycles was calculated as follows:

Where d is the days in culture between clonal dilutions, 24 to convert to hours, and t is the estimated life cycle time in hours. t has been measured in HB3 and Dd2 at 49.7 and 44.1 hours, respectively [43]. 48 hours was used for 3D7.
We took into account the number of clones in each clonal dilution generation to produce a weighted average mutation rate (S5 Table) of 4.07×10⁻¹⁰, 3.63×10⁻¹⁰ and 3.78×10⁻¹⁰ SNPs per erythrocytic life cycle per nucleotide for 3D7, Dd2 and HB3 respectively. We did not calculate a SNP mutation rate in W2 as the clone tree was not as extensive and we did not feel there was enough data for an accurate calculation. We observed one instance of two SNPs occurring ‘back to back’, i.e. two consecutive nucleotides were mutated from the reference, and one occasion where a single nucleotide separated two SNPs. These were all counted as separate SNP mutations for the rate calculation, though it may be that they represent single ‘mutation events’ at a molecular level.
The Bopp et al [9] published mutation rates for 3D7 and Dd2 in the absence of drug selection was 1.7×10⁻⁹ and 3.2×10⁻⁹, respectively. However, they adjusted their raw data to account for deleterious non-synonymous SNPs that may have been eliminated by purifying selection before being identified. Using their methods, our raw mutation rates become 4.28×10⁻⁹, 3.82×10⁻⁹ and 3.98×10⁻⁹ SNPs per erythrocytic life cycle per nucleotide for 3D7, Dd2 and HB3 respectively. Thus, there is high consistency both between ours and Bopp et al's SNP mutation rate estimates and between different P. falciparum lab strains.
Our calculation of exon 1 var gene recombination in the Dd2 clone tree was very similar to our SNP mutation method described above (S5 Table). Because we often observed multiple crossovers per recombining var gene pair, we calculated two recombination rates: First, we calculated the rate at which pairs of var genes recombine in exon 1 in Dd2 as 2.32×10⁻³ per life cycle, i.e. a pair of var genes will recombine in ∼0.2% of infected erythrocytes per life cycle. We did not calculate the rate per life cycle per nucleotide because our analysis was focused on var exon 1, so dividing by the total nuclear genome was not appropriate. We therefore also calculated ‘per life cycle’ rates for SNP mutations to enable comparison between var recombination and SNPs. Second, we calculated the rate of var exon 1 crossover events at 3.45×10⁻³ per life cycle. This is higher than the rate of recombining var pairs per life cycle because some pairs have >1 crossover.
Supporting Information
Zdroje
1. MurrayCJL, RosenfeldLC, LimSS, AndrewsKG, ForemanKJ, et al. (2010) Global malaria mortality between 1980 and 2010: a systematic analysis. Lancet 379 : 413–431 doi:10.1016/S0140-6736(12)60034-8
2. SmithJD, RoweJA, HigginsMK, LavstsenT (2013) Malaria's deadly grip: cytoadhesion of Plasmodium falciparum-infected erythrocytes. Cell Microbiol 15 : 1976–1983 doi:10.1111/cmi.12183
3. ScherfA, Lopez-RubioJJ, RiviereL (2008) Antigenic variation in Plasmodium falciparum. Annu Rev Microbiol 62 : 445–470 doi:10.1146/annurev.micro.61.080706.093134
4. LavstsenT, TurnerL, SagutiF, MagistradoP, RaskTS, et al. (2012) Plasmodium falciparum erythrocyte membrane protein 1 domain cassettes 8 and 13 are associated with severe malaria in children. Proc Natl Acad Sci U S A 109: E1791–800 doi:10.1073/pnas.1120455109
5. AvrilM, TripathiAK, BrazierAJ, AndisiC, JanesJH, et al. (2012) A restricted subset of var genes mediates adherence of Plasmodium falciparum-infected erythrocytes to brain endothelial cells. Proc Natl Acad Sci U S A 109: E1782–90.
6. ClaessensA, AdamsY, GhumraA, LindergardG, BuchanCC, et al. (2012) A subset of group A-like var genes encodes the malaria parasite ligands for binding to human brain endothelial cells. Proc Natl Acad Sci U S A 109: E1772–81.
7. SmithJD, SubramanianG, GamainB, BaruchDI, MillerLH (2000) Classification of adhesive domains in the Plasmodium falciparum erythrocyte membrane protein 1 family. Mol Biochem Parasitol 110 : 293–310.
8. RaskTS, Hansen Da, TheanderTG, Gorm PedersenA, LavstsenT (2010) Plasmodium falciparum erythrocyte membrane protein 1 diversity in seven genomes—divide and conquer. PLoS Comput Biol 6 doi:10.1371/journal.pcbi.1000933
9. BoppSER, ManaryMJ, Bright aT, JohnstonGL, Dharia NV, et al. (2013) Mitotic Evolution of Plasmodium falciparum Shows a Stable Core Genome but Recombination in Antigen Families. PLoS Genet 9: e1003293 doi:10.1371/journal.pgen.1003293
10. Freitas-JuniorLH, BottiusE, Pirrit La, DeitschKW, ScheidigC, et al. (2000) Frequent ectopic recombination of virulence factor genes in telomeric chromosome clusters of P. falciparum. Nature 407 : 1018–1022 doi:10.1038/35039531
11. DuffyMF, ByrneTJ, CarretC, IvensA, Brown GV (2009) Ectopic recombination of a malaria var gene during mitosis associated with an altered var switch rate. J Mol Biol 389 : 453–469 doi:10.1016/j.jmb.2009.04.032
12. FrankM, KirkmanL, CostantiniD, SanyalS, LavazecC, et al. (2008) Frequent recombination events generate diversity within the multi-copy variant antigen gene families of Plasmodium falciparum. Int J Parasitol 38 : 1099–1109 doi:10.1016/j.ijpara.2008.01.010
13. DeitschKW, del Pinala, WellemsTE (1999) Intra-cluster recombination and var transcription switches in the antigenic variation of Plasmodium falciparum. Mol Biochem Parasitol 101 : 107–116.
14. ZilversmitMM, ChaseEK, ChenDS, AwadallaP, DayKP, et al. (2013) Hypervariable antigen genes in malaria have ancient roots. BMC Evol Biol 13 : 110 doi:10.1186/1471-2148-13-110
15. GulerJL, FreemanDL, AhyongV, PatrapuvichR, WhiteJ, et al. (2013) Asexual populations of the human malaria parasite, Plasmodium falciparum, use a two-step genomic strategy to acquire accurate, beneficial DNA amplifications. PLoS Pathog 9: e1003375 doi:10.1371/journal.ppat.1003375
16. HaytonK, GaurD, LiuA, TakahashiJ, HenschenB, et al. (2008) Erythrocyte binding protein PfRH5 polymorphisms determine species-specific pathways of Plasmodium falciparum invasion. Cell Host Microbe 4 : 40–51 doi:10.1016/j.chom.2008.06.001
17. WellemsTE, PantonLJ, GluzmanIY, do RosarioVE, GwadzRW, et al. (1990) Chloroquine resistance not linked to mdr-like genes in a Plasmodium falciparum cross. Nature 345 : 253–255 doi:10.1038/345253a0
18. WallikerD, QuakyiIA, WellemsTE, McCutchanTF, SzarfmanA, et al. (1987) Genetic analysis of the human malaria parasite Plasmodium falciparum. Science 236 : 1661–1666.
19. Sander AF, Lavstsen T, Rask TS, Lisby M, Salanti A, et al.. (2013) DNA secondary structures are associated with recombination in major Plasmodium falciparum variable surface antigen gene families. Nucleic Acids Res: 1–12. doi:10.1093/nar/gkt1174.
20. TaylorHM, Kyes Sa, NewboldCI (2000) Var gene diversity in Plasmodium falciparum is generated by frequent recombination events. Mol Biochem Parasitol 110 : 391–397.
21. Kirkman La, Lawrence Ea, DeitschKW (2014) Malaria parasites utilize both homologous recombination and alternative end joining pathways to maintain genome integrity. Nucleic Acids Res 42 : 370–379 doi:10.1093/nar/gkt881
22. KirkmanLA, DeitschKW (2012) Antigenic variation and the generation of diversity in malaria parasites. Curr Opin Microbiol 15 : 456–462 doi:10.1016/j.mib.2012.03.003
23. ChenJ-M, CooperDN, ChuzhanovaN, FérecC, PatrinosGP (2007) Gene conversion: mechanisms, evolution and human disease. Nat Rev Genet 8 : 762–775 doi:10.1038/nrg2193
24. BarzelA, KupiecM (2008) Finding a match: how do homologous sequences get together for recombination? Nat Rev Genet 9 : 27–37 doi:10.1038/nrg2224
25. MartyAJ, ThompsonJK, DuffyMF, VossTS, CowmanAF, et al. (2006) Evidence that Plasmodium falciparum chromosome end clusters are cross-linked by protein and are the sites of both virulence gene silencing and activation. Mol Microbiol 62 : 72–83 doi:10.1111/j.1365-2958.2006.05364.x
26. BuckeeCO, ReckerM (2012) Evolution of the multi-domain structures of virulence genes in the human malaria parasite, Plasmodium falciparum. PLoS Comput Biol 8: e1002451 doi:10.1371/journal.pcbi.1002451
27. BullPC, KyesS, BuckeeCO, MontgomeryJ, KortokMM, et al. (2007) An approach to classifying sequence tags sampled from Plasmodium falciparum var genes. Mol Biochem Parasitol 154 : 98–102 doi:10.1016/j.molbiopara.2007.03.011
28. ClaessensA, AdamsY, GhumraA, LindergardG, BuchanCC, et al. (2012) A subset of group A-like var genes encodes the malaria parasite ligands for binding to human brain endothelial cells. Proc Natl Acad Sci U S A 109: E1772–81 doi:10.1073/pnas.1120461109
29. Noble R, Christodoulou Z, Kyes S, Pinches R, Newbold CI, et al.. (2013) The antigenic switching network of Plasmodium falciparum and its implications for the immuno-epidemiology of malaria: 1–19. doi:10.7554/eLife.01074.
30. BullPC, BuckeeCO, KyesS, KortokMM, ThathyV, et al. (2008) Plasmodium falciparum antigenic variation. Mapping mosaic var gene sequences onto a network of shared, highly polymorphic sequence blocks. Mol Microbiol 68 : 1519–1534 doi:10.1111/j.1365-2958.2008.06248.x
31. TrimnellAR, KraemerSM, MukherjeeS, PhippardDJ, JanesJH, et al. (2006) Global genetic diversity and evolution of var genes associated with placental and severe childhood malaria. Mol Biochem Parasitol 148 : 169–180 doi:10.1016/j.molbiopara.2006.03.012
32. LarremoreDB, ClausetA, BuckeeCO (2013) A network approach to analyzing highly recombinant malaria parasite genes. PLoS Comput Biol 9: e1003268 doi:10.1371/journal.pcbi.1003268
33. Lindblade Ka, SteinhardtL, SamuelsA, KachurSP, SlutskerL (2013) The silent threat: asymptomatic parasitemia and malaria transmission. Expert Rev Anti Infect Ther 11 : 623–639 doi:10.1586/eri.13.45
34. TragerW, JensonJB (1978) Cultivation of malarial parasites. Nature 273 : 621–622.
35. Manske M, Miotto O, Campino S, Auburn S, Almagro-garcia J, et al.. (2012) Analysis of Plasmodium falciparum diversity in natural infections by deep sequencing. Nature: 1–5. doi:10.1038/nature11174.
36. SwainMT, TsaiIJ, Assefa Sa, NewboldC, BerrimanM, et al. (2012) A post-assembly genome-improvement toolkit (PAGIT) to obtain annotated genomes from contigs. Nat Protoc 7 : 1260–1284 doi:10.1038/nprot.2012.068
37. LiH, HandsakerB, WysokerA, FennellT, RuanJ, et al. (2009) The Sequence Alignment/Map format and SAMtools. Bioinformatics 25 : 2078–2079 doi:10.1093/bioinformatics/btp352
38. ManskeHM, KwiatkowskiDP (2009) LookSeq: a browser-based viewer for deep sequencing data. Genome Res 19 : 2125–2132 doi:10.1101/gr.093443.109
39. RauschT, ZichnerT, SchlattlA, StützAM, BenesV, et al. (2012) DELLY: structural variant discovery by integrated paired-end and split-read analysis. Bioinformatics 28: i333–i339 doi:10.1093/bioinformatics/bts378
40. NairS, NashD, SudimackD, JaideeA, BarendsM, et al. (2007) Recurrent gene amplification and soft selective sweeps during evolution of multidrug resistance in malaria parasites. Mol Biol Evol 24 : 562–573 doi:10.1093/molbev/msl185
41. NairS, MillerB, BarendsM, JaideeA, PatelJ, et al. (2008) Adaptive copy number evolution in malaria parasites. PLoS Genet 4: e1000243 doi:10.1371/journal.pgen.1000243
42. GardnerMJ, HallN, FungE, WhiteO, BerrimanM, et al. (2002) Genome sequence of the human malaria parasite Plasmodium falciparum. Nature 419 : 498–511 doi:10.1038/nature01097
43. ReillyHB, WangH, SteuterJA, MarxAM, FerdigMT (2007) Quantitative dissection of clone-specific growth rates in cultured malaria parasites. Int J Parasitol 37 : 1599–1607 doi:10.1016/j.ijpara.2007.05.003
Štítky
Genetika Reprodukční medicínaČlánek vyšel v časopise
PLOS Genetics
2014 Číslo 12
Nejčtenější v tomto čísle
- Tetraspanin (TSP-17) Protects Dopaminergic Neurons against 6-OHDA-Induced Neurodegeneration in
- Maf1 Is a Novel Target of PTEN and PI3K Signaling That Negatively Regulates Oncogenesis and Lipid Metabolism
- The IKAROS Interaction with a Complex Including Chromatin Remodeling and Transcription Elongation Activities Is Required for Hematopoiesis
- Echoes of the Past: Hereditarianism and