
Single Nucleotide Variants in Transcription Factors Associate More Tightly with Phenotype than with Gene Expression
There have been major efforts in the study of human disease to identify genetic polymorphisms that cause changes in gene expression. The assumption underlying these studies is that gene expression changes will be responsible for the disease. However, it is unclear if we can predict how a polymorphism affects the variation in disease based on the extent to which it explains variation in gene expression. We have taken advantage of four genetic polymorphisms that affect the ability of budding yeast cells to form spores. The variants were identified in naturally occurring strains, subject to natural selection pressures in the wild, and not from lab strains. These variants lie in factors that control gene expression, which gives us power to compare how the polymorphisms affect variation in both gene expression and the downstream phenotype. We find that the amount of variation in gene expression explained by the variants does not correlate with the amount of variation observed in spore formation, which has implications for studies that attempt to infer the effect of a polymorphism on phenotypic variation by studying its effect on gene expression variation.
Published in the journal:
. PLoS Genet 10(5): e32767. doi:10.1371/journal.pgen.1004325
Category:
Research Article
doi:
https://doi.org/10.1371/journal.pgen.1004325
Summary
There have been major efforts in the study of human disease to identify genetic polymorphisms that cause changes in gene expression. The assumption underlying these studies is that gene expression changes will be responsible for the disease. However, it is unclear if we can predict how a polymorphism affects the variation in disease based on the extent to which it explains variation in gene expression. We have taken advantage of four genetic polymorphisms that affect the ability of budding yeast cells to form spores. The variants were identified in naturally occurring strains, subject to natural selection pressures in the wild, and not from lab strains. These variants lie in factors that control gene expression, which gives us power to compare how the polymorphisms affect variation in both gene expression and the downstream phenotype. We find that the amount of variation in gene expression explained by the variants does not correlate with the amount of variation observed in spore formation, which has implications for studies that attempt to infer the effect of a polymorphism on phenotypic variation by studying its effect on gene expression variation.
Introduction
Mapping the loci that control quantitative variation is a crucial step towards understanding complex disease [1]–[3]. Genome-wide association studies (GWAS) have shown that a large proportion of human disease-risk alleles consist of non-coding variants [4]. Since alterations in transcriptional regulation can drive disease states, there have been extensive studies to map eQTL, the genetic variants responsible for variation in gene expression [5]–[10] (for reviews, see [11]–[14]). Finding eQTL is now a widely accepted strategy for identifying new variants that potentially affect phenotype [15], for screening GWAS alleles to find those that affect disease risk by altering transcription [16], and for uncovering the molecular pathways underlying disease [17]. These studies make a distinction between cis-eQTL (genetic variants that affect the expression of physically linked genes) and trans-eQTL (variants that are physically unlinked from their target gene) [18]. cis-eQTLs also have effects in trans on unlinked genes that are downstream targets of the gene linked to the cis-eQTL. A large amount of effort is now directed towards the identification and analysis of eQTL. However, it remains extremely difficult to identify the precise nucleotide variant/s responsible for the changes in gene expression or phenotype, even in model organisms.
eQTL studies rely on an assumption that an unknown subset of the transcriptional changes in the target genes of the eQTL are responsible for the downstream disease phenotype. cis-eQTL that affect transcription factors are considered particularly interesting as they may identify the transcriptional program involved in the disease. However, despite numerous studies linking GWAS and eQTL results [16], [17], [19], fundamental questions remain about how a variant's effect on gene expression relates to its effect on phenotype. It is unclear if the amount of gene expression variation explained by an eQTL correlates with the amount of phenotypic variation it explains. In addition, it remains to be established if cis-eQTL play a more significant role in controlling gene expression variation compared to trans-eQTLs. The best way to address these questions would be to compare the effects of a set of variants that are responsible for changes in both gene expression and the ultimate phenotype.
Our lab has been studying the genetic variation responsible for the differences in sporulation efficiency in natural populations of Saccharomyces cerevisiae (S. cerevisiae) [20]. In the presence of nitrogen and non-fermentable carbon sources, diploid S. cerevisiae cells face a cell fate decision that involves a switch from fermentation to aerobic respiration and the cessation of mitosis followed by the initiation of meiosis [21]–[23]. Sporulation efficiency is defined as the percentage of cells in a culture that form meiotic spores, and is a highly heritable, complex trait [20], [24]–[26]. We have identified the exact nucleotide variants responsible for most of the variation in sporulation efficiency between a natural oak tree isolate (YPS606) and a vineyard strain (BC187) [27]. The oak tree isolate sporulates at 100% efficiency while the vineyard strain sporulates at 3.5% under sporulating conditions [27], [28]. By swapping the causative nucleotides in the vineyard background for the oak nucleotide variants, we generated an isogenic panel of vineyard strains that have completely identical genomes except at the causative variants [27]. Here, we describe the use of this allele replacement strain panel to study the primary question posed above: What is the relationship between the effect of causative nucleotides on the variation in gene expression and in phenotype?
There are four quantitative trait nucleotides (QTNs) in three genes (IME1, RME1 and RSF1) that are responsible for most of the differences in sporulation efficiency between the oak and vineyard strains [27]. The four QTN consist of two non-coding and two coding variants. The non-coding regions of RME1 (RME1nc - RME1(indel-308A)) and IME1 (IME1nc - IME1(A-548G)) contain one causative variant each, implying that changes in RME1 and IME1 expression may be responsible for the differences in sporulation efficiencies between the parent strains. The remaining two QTN are coding variants in IME1 (IME1c - IME1(L325M)) and RSF1 (RSF1c - RSF1(D181G)). Strikingly, the three QTN-containing genes are either known (IME1 [29], [30] and RME1 [31]) or putative (RSF1 [32], [33]) transcription factors. Given their role in transcriptional regulation, it is reasonable to assume that the four sporulation QTN affect phenotype through changes in gene expression. The allele replacement panel is isogenic at all loci, except for the causative variants. Since the sporulation QTN are the only genetic variants in the panel, they must be responsible for all reproducibly observed gene expression variation among the panel strains. Consequently, the sporulation alleles are nucleotide variants responsible for the variation in phenotype (QTN) as well as variation in gene expression (eQTN).
We present the results of a study in which we measured the effects of individual single-nucleotide variants on both gene expression and sporulation efficiency in a controlled setting. Since the QTN underlying variation in sporulation efficiency reside in transcription factors, and have been swapped individually and in all combinations into a clean background, our experiment represents a rigorous test of the relationship between the effect of a variant on gene expression and on the ultimate phenotype. Our analysis reveals that 1) the amount of variation in gene expression explained by a polymorphism is not always correlated with the amount of phenotypic variation explained by that same polymorphism, 2) genetic interactions between variants are responsible for a larger proportion of gene expression variability than phenotypic variability, and 3) that alleles that change either the level or activity of a transcription factor affect expression variation of the same genes to different extents. We also find that while the allele replacement panel displays extensive variation in gene expression, the downstream phenotype is largely buffered from the variation in the upstream transcriptional network.
Results
Single QTN are responsible for variation in both gene expression and sporulation efficiency
To explore the relationship between genetic variation, gene expression and phenotype, we utilized a panel of sixteen isogenic strains in the vineyard background. The panel was generated by swapping causative vineyard nucleotides with their oak allele counterparts [27]. This panel includes the vineyard parent, the “vineyard converted” strain that has all four oak QTN in place of the vineyard alleles, as well as strains with all possible combinations of oak and vineyard alleles at the four QTN. Using conditions which differed slightly from those in Gerke et al [27] (see Materials and Methods), we first measured the sporulation efficiencies of the allele replacement strains to quantify the effects of the QTN on sporulation efficiency under these conditions (Table S1). We assessed the effect of genotype on sporulation efficiency by building a linear model of the effects of the four QTN on sporulation efficiency (Table S2). The analysis of variance shows that the allelic status of the QTN explains 98% of the differences in sporulation efficiencies between the strains in the panel (Table 1). 93% of the variance in sporulation efficiency is due to a simple linear combination of the individual (main or additive) effects of the four vineyard QTN alleles (Table 1). The variation in sporulation efficiency explained by the main effects of the vineyard alleles of RME1nc, RSF1c and IME1c is almost equal while the vineyard allele of IME1nc explains a smaller but significant amount. An additional small but significant amount of variance (5%) can be explained by the genetic interactions between the vineyard alleles. The small number of significant interaction parameters indicates that a simple additive model of the main effects between the four QTN explains almost all the variation in the phenotype under these conditions.

We next measured the effect of each QTN on global-expression profiles during the cell fate decision phase when all three genes are active. RSF1 is required for transcription of mitochondrial genes [32] and respiration is known to be required for Ime1 expression and meiosis [34]. In addition, RME1 [31] and IME1 [30], [35] control some of the critical transcriptional changes during this phase. IME1 expression is induced rapidly after the switch to sporulation medium [35]. We showed previously that differences between the oak and vineyard strains in making the decision to sporulate occur very early after the switch to non-fermentable carbon, before meiotic DNA synthesis [20]. We, therefore, used RNA-Seq [36] to measure global mRNA expression-profiles in all sixteen strains in the panel after two hours in sporulation medium, before meiotic DNA replication begins. We surmised that the causative QTN would be active during this period and that the differences in gene expression between the strains at this time point would be linked to the differences in sporulation efficiencies. We obtained good reproducibility between the biological replicates (the range of mean Pearson's correlation coefficients for pair-wise comparisons between replicates of each strain was 0.86–0.93). The coefficient of variance, CV, (standard deviation/mean), for the biological replicates is a measure of the variance in our measurements. The CV for gene expression (median CV = 0.15) is slightly greater than the CV for sporulation efficiency (median CV = 0.076) but is consistent with reports from previous RNA-Seq experiments [37], [38].
We assessed the effects of the QTN on the expression of each gene in the genome by regressing genotype on gene expression patterns across the sixteen strains in the panel. After removing the effect of day-to-day experimental variation (see Materials and Methods), we applied a linear model framework to assess how much of the variation in the expression of each gene could be explained by the allelic status of the sporulation QTN (Table S3). After correcting for multiple hypothesis testing, we obtained 289 significant gene-specific models (∼5% of the genome) in which gene expression was significantly affected by the allele status of the QTN (Figures 1 & S1).

Within these 289 genes, the genetic status of the QTNs explains 45–88% of the observed variation in expression (median 49%) (Figure 1 (inset), Table S4). The best model of gene expression (for URC2, a putative Zn(II)Cys6-containing transcription factor [39]) explains 88% of the variance in this gene's expression. These results stand in stark contrast to the model of sporulation efficiency, which explains 98% of the variation in this phenotype. The median variance explained by the polymorphisms depends on the exact FDR we chose in our analysis (a lower FDR would yield a higher median variance explained). However, for any FDR threshold, the gene expression models are always less predictive than the sporulation model. Applying a similar linear model framework to log-transformed expression counts did not increase the gene expression variance explained by the QTN (Figure S2) and, therefore, we analyzed the models using untransformed gene expression counts. These results suggest that the statistical relationship between QTN and phenotype is simpler than the link between eQTN and gene expression.
Balance between main and interaction effects on the variation in gene expression versus sporulation efficiency
Genetic interactions between the QTN account for a large fraction of the variation in gene expression. We found that all four QTN play a role in the expression of most of the 289 significantly affected genes, either through main or interaction effects (Tables 2 & S3). As RME1, IME1 and RSF1 act at similar points in the sporulation network [23], [33], [34], it is not surprising that interactions between the alleles explain a major portion of the variation in gene expression (Figure 2). Main and interaction effects explain almost equal amounts of the variation in gene expression, which stands in contrast to the model for sporulation efficiency, in which main effects explain the vast majority of the variation in phenotype. The median variance in gene expression explained by main effects of the QTN across all 289 genes is 20% and by the interaction effects is 29.7%. Only a small fraction of the genes (26/289) show the additive-interaction balance observed in the sporulation model where main effects account for over 90% of the explained expression variance. These genes include RIM4 (a known target of Ime1 [40]), RME1 itself, and PRD1 (a zinc metalloendopeptidase that is involved in the degradation of mitochondrial proteins [41]). Our results show that, while complex interactions between the QTN drive most of the variation in gene expression patterns, additive effects of the QTN account for most of the variation in sporulation efficiency under the conditions tested here. Given the significant differences between the explanatory power of the gene expression models and the sporulation efficiency model, our results suggest that the downstream phenotype is robust to expression variation in the network.


We also found that the balance between main and interaction effects on the variation in gene expression was different for different QTN (Figure 3). RSF1c's role in controlling expression variation was primarily through its main effects while RME1nc and both IME1 alleles exerted their influence on expression variation primarily through interactions with the other alleles. These results are not surprising as RME1 and IME1 act at the same point in the sporulation transcriptional network [23] with Rme1 binding directly to the promoter of IME1 [31].

Comparison of the effect of QTN on variation in gene expression and sporulation
We next asked whether the fraction of variation in gene expression explained by sporulation QTN was similar to that explained for sporulation efficiency. We found that the proportion of gene expression variation explained by the QTN was not predictive of the explanatory power in the sporulation efficiency model. RSF1c controls the variation in expression of a large number of genes. It affects the expression of almost all of the 289 genes with significant expression models and explains a significant proportion of the variation of 71% of the target genes (205/287 genes) (Table 2). The main effect of RSF1c also explains the largest proportion of the variation in gene expression compared to the other three QTN (median variance explained by RSF1c main effect = 8.5%, Figure 3). However, it is surprising that, despite its significant role in gene expression, RSF1c does not have the largest role in explaining the variation in sporulation efficiency. The RSF1c allele explains 23% of the variation in sporulation efficiency as compared to RME1nc (38%) and IME1c (35%) (Table 1B, Figure 4). Little is known about RSF1 except that it may be a transcriptional modulator of respiration [32] which is known to be required for sporulation in S. cerevisiae [34]. These results suggest that RSF1 plays a significant role in the transcriptional cascade that initiates sporulation along with the known sporulation transcriptional regulators, RME1 and IME1. However, it is also possible that, despite being responsible for a large fraction of the variation in gene expression, only a subset of RSF1c's target genes affect sporulation efficiency. In contrast, RME1nc or IME1c may account for a greater proportion of the variation in the phenotype as more of their target genes may be directly involved in sporulation.
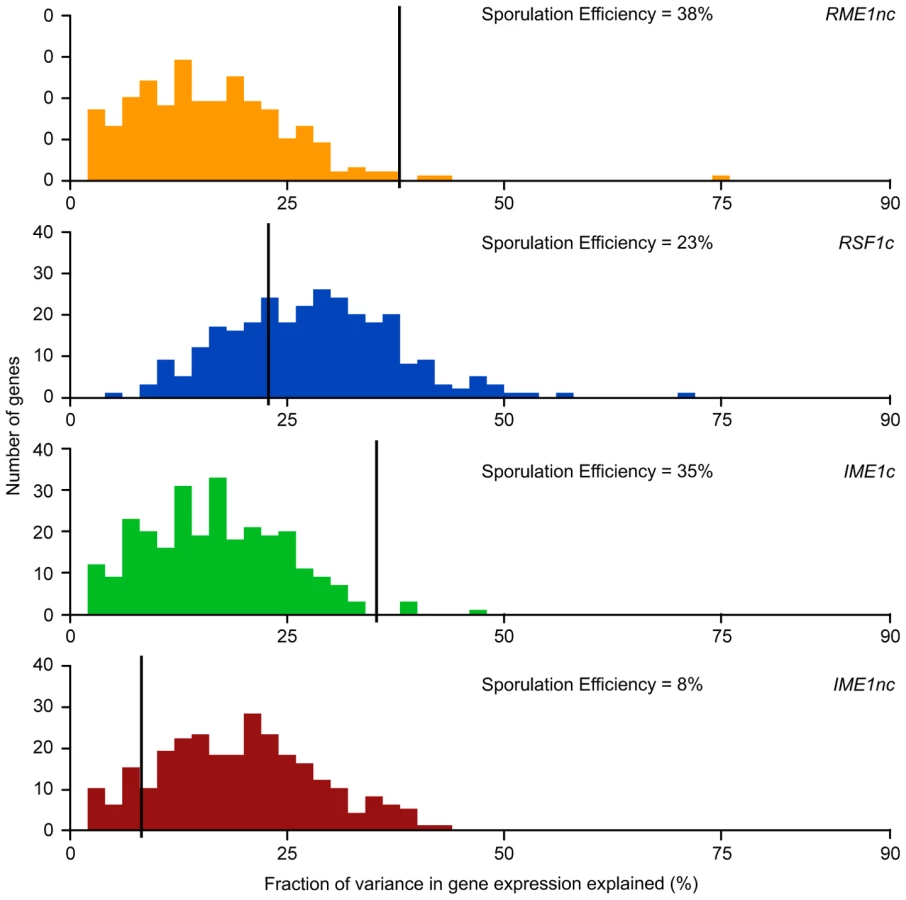
RME1nc and IME1c both explain a comparatively modest fraction of the variation in gene expression (Figure 4). The main effects of both alleles account for the expression variation of 35% of their targets (Table 2) but exert their influence primarily through interactions with the other QTN (Figure 3). As stated before, this is not surprising as Rme1 and Ime1 act at the same point of the transcriptional cascade [23] and RME1 is a known repressor of IME1 expression [31]. The expression of RME1 itself is a notable exception. The main effect of RME1nc explains 75% of the variation in RME1 expression (Table 3). The expression of RME1 is almost bimodal with increased expression in strains containing the RME1nc oak allele and reduced expression in the presence of the vineyard allele. These results are striking given the role of the two QTN on the variation in sporulation efficiency. The main effects of RME1nc and IME1c explain a large proportion of the variation in sporulation efficiency (Table 1, Figure 4). However, their role in controlling gene expression variation is not as significant as RSF1c and occurs primarily through interactions with the other alleles (Figure 3). These results, again, highlight the differences between the QTN in their control of gene expression and sporulation efficiency variation.

IME1 is considered the primary regulator of the sporulation transcriptional cascade [30], [42]. However, the IME1nc allele does not explain as much of the variation in gene expression as RSF1 (Table 2) possibly because RSF1 acts earlier than IME1 and affects both respiration and sporulation genes. Accordingly, RSF1 is responsible for a significant proportion of the variation in IME1 gene expression (Table 3) though it is unclear if it directly affects the transcription of IME1. Similar to RME1 and the coding allele of IME1, IME1nc affects gene expression through genetic interactions with the other three alleles (Figure 3). The main effects of IME1nc explain the variation of a slightly larger number of genes than IME1c (134/273 genes) (Table 2). It is striking, therefore, that IME1nc, is responsible for the smallest proportion of the variation in sporulation efficiency (Figure 4) showing that a genetic variant such as IME1nc can cause significant changes in the variability of gene expression upstream in the network but play a modest role in the variation of the ultimate phenotype. Our results thus indicate that the proportion of variation in gene expression explained by a QTN is not predictive of the amount of phenotypic variation that it explains.
The number of eQTL targets has also been used to identify “hot spots” of regulatory activity that may be important for the disease phenotype [5], [10], [43], [44]. In addition, there has been some discussion that trans-eQTL are more likely to be eQTL “hot spots” than cis-eQTL as their effects may be more pleiotropic [45]. The oak and vineyard parental strains used in these studies also exhibit some pleiotropy as they differ in the size of the cells entering meiosis, the relative numbers of dyads, triads, and tetrads in fully sporulated cultures, and growth on non-fermentable carbon sources [20]. While we know that the RSF1c is not responsible for the growth differences of the parental strains on glycerol [27], it is possible that some of the sporulation QTN-dependent genes may influence these other phenotypes. All four of the eQTN studied here affect the expression variation of a large number of overlapping genes (Table 2), thereby, behaving as expression “hot spots”. As expected, the cis-eQTL affect the variation in gene expression of the linked genes (RME1 and IME1) but also affect the variability of many genes in trans. We do not observe any consistent differences in the number of genes whose expression variation is affected by either the cis-eQTL (RME1nc and IME1nc) or the trans-eQTL (RSF1c and IME1c). We also do not find significant enrichment for any particular gene ontology (GO) category (P.S & B.A.C, unpublished data). More importantly, as described above, even though all four eQTN behave as “hot spots” for transcriptional changes, there are significant differences in the amount of downstream phenotypic variation that they control. The comparisons indicate that the number of genes affected, the balance between the additive-interaction effects in their control of expression variation and the fraction of gene expression variance explained are not predictive of the effect of the QTN on sporulation efficiency.
Comparison of the IME1 coding and non-coding QTN
One striking result is the difference between the effects of the two IME1 QTN on the variation in sporulation efficiency. The non-coding allele of IME1, IME1nc, affects the expression level of IME1 and consequently, the amount of Ime1 protein. The coding allele of IME1, IME1c, probably affects the activity of Ime1 protein as it lies in a domain of Ime1 that is responsible for protein-protein interactions with Rim11 and Ume6 [30], two factors that are required for the initiation of sporulation. Given that both alleles occur in the same transcription factor, we investigated if their effects on the variation in gene expression matched their roles in controlling variation in sporulation efficiency. While the distributions of the effects on the variation in gene expression for the two alleles look very similar and they affect similar sets of genes (Figure 4), the IME1c allele explains a larger proportion of the variation in sporulation efficiency than IME1nc (Table 1). Closer inspection of the expression data revealed that while both alleles explained the expression variation of the same set of genes, the rank order of the amount of variance explained by each of the alleles is quite different (p-value<0.005, Wilcoxon rank sum test). In other words, the two IME1 alleles both affect the same set of genes, but expression variation of specific genes is more or less sensitive to either the coding or non-coding allele. These differences can be seen by comparing the fraction of variance explained by the two IME1 alleles in individual gene expression models. While the expression variation of most IME1-dependent genes is affected by both alleles when the full model is applied, the proportion of variance explained varies between the alleles (Figure 5a, correlation coefficient, r = 0.43). This difference between the alleles is magnified when only the variance explained by main effects is considered (Figure 5b). While there are a few genes where the main effects from both alleles affect a significant proportion of the variation, the expression variation of most of the dependent genes is affected primarily by only one or the other allele. The difference between subsets of genes in their sensitivity to either the level (IME1nc) or the activity (IME1c) of Ime1 manifests itself as a dramatic difference in the effects of the two IME1 alleles on sporulation efficiency.

Discussion
We have used a set of individual single nucleotide variants in known or putative transcriptional regulators that are causative for variation in sporulation efficiency to explore the relationship between genetic variants and their effects on gene expression and phenotype. The allele status of the QTNs explains almost all of the variation in sporulation efficiency but the median variation in gene expression explained is only 49%. In addition, variation in gene expression results from many interactions between the alleles while simple additive effects of the QTN explain most of the variation in sporulation efficiency. It is intriguing that gene expression varies more than the phenotype as the four QTN represent the sole genetic changes in the panel. Why might the QTN show a stronger correlation with sporulation efficiency than with expression variation, even though the QTN reside in transcriptional regulators? It is possible that our gene expression measurements are “noisier” than those of sporulation efficiency as RNA-Seq may be more sensitive in measuring variation in gene expression than the fluorescence measurements used to assess sporulation efficiency. It is also possible that experimental variation was introduced during sample preparation. We know that day-to-day variation in media conditions, oxygen levels, etc. can affect sporulation efficiency and expect that they would affect gene expression as well. We accounted for this variation by including the day of growth as a covariate in our gene expression models. However, it is possible that there is some additional unexplained gene expression variation even among strains grown on the same day.
The fact that genotype better explains sporulation efficiency than the “endo-phenotypes” of gene expression suggest that sporulation efficiency is buffered from changes in the transcriptional network. Developmental biologists have invoked the concept of “phenotypic robustness” to explain how body patterns remain invariant despite perturbations in the upstream gene regulatory network [46], . QTL mapping studies in Arabadopsis lines have also suggested that genetic variation in gene expression does not always manifest itself as phenotypic variation [48]. Phenotypic changes often require gene expression changes beyond certain thresholds. As long as transcriptional fluctuations do not cross the threshold, the phenotype does not vary. When transcription is tuned to be close to the threshold, variability in gene expression has been shown to be responsible for incomplete penetrance [49]. Conversely, surplus gene expression i.e. gene expression levels that are considerably higher than the threshold needed to cause phenotypic change, can result in “wild-type” phenotypes [50]. The fact that, in our conditions, main effects account for most of the variation in sporulation efficiency whereas allele interactions account for a significant, but much smaller amount of the phenotypic variation, suggests that the sporulation efficiency phenotype is buffered from the variation in the transcriptional network. The sporulation transcriptional cascade contains multiple points for feedback control [51] which probably impose several thresholds on gene expression levels. One obvious possibility is that cells only sporulate when the levels of the sporulation transcriptional activators are above a certain level. This also implies that, in properly powered studies, genotype will be more strongly associated with phenotype than with gene expression.
Our analyses of the relationship between gene expression variation and sporulation efficiency variation are based on expression measurements taken at a single time point. We chose to analyze the gene expression changes at this early stage of sporulation as the transcription factors containing the sporulation QTN exert their effects soon after the switch into sporulation medium. In addition, Gerke et al. [20] showed that the critical differences between the oak and vineyard parental strains also occur early in sporulation. Gene expression changes at later time points are likely to correlate better with sporulation efficiency, but this correlation will be driven by gene expression changes due to differences in the numbers of actively sporulating cells. Our expression measurements reflect the early gene expression changes in the decision to sporulate during the period when the QTN are active, not the downstream effectors of sporulation.
The main effects of the two IME1 alleles, IME1nc and IME1c, play distinct roles in controlling the variation in gene expression, despite residing in the same transcription factor. Our results suggest that individual target genes are more dependent on either the level (IME1nc) or activity (IME1c) of Ime1. Ime1 binds its target promoters through Ume6, which encodes a DNA-binding protein [52]. Binding of Ime1 for Ume6 activates transcription of early-meiosis genes by displacing the repressive activities associated with Ume6 [30]. The IME1c allele probably affects the affinity of Ime1 for Ume6 or other co-factors as it lies in a domain of Ime1 that is responsible for protein-protein interactions with Rim11 and Ume6 [30]. Given this mode of action, the differences between the two IME1 alleles suggest that changing the affinity of Ime1 to Ume6 or other co-factors has a different effect on IME1-dependent promoters compared to changing the concentration of Ime1. It is possible that Ime1 exhibits cooperativity at IME1nc-dependent genes but not at IME1c-dependent genes, rendering these particular targets more sensitive to changes in Ime1 levels but insensitive to changes in the affinity of Ime1 binding. An initial search for transcription factor motifs uncovered the Ume6 binding site in both sets of genes, but did not reveal any notable differences in the motif content of the two sets of target promoters (P.S & B.A.C, unpublished data). However, it remains possible that each set of promoters contains a unique combination of motifs and co-factors that control the allele-dependent response.
Finding consistent patterns among the hundreds of eQTL is a major challenge in the study of quantitative variation in gene expression [13]. Investigators have focused on cis-eQTL, the number of targets, or the effect size of a given eQTL as ways to screen eQTL for the variants most likely to be important. We find that that the fraction of variation in gene expression explained by the sporulation QTN is not predictive of the fraction of variation in phenotype that they explain. The results are surprising since all four QTN lie in known or putative transcriptional regulators and, therefore, must exert their phenotypic effects through changes in gene expression. It remains to be determined if this same trend will hold for causal genes that are not TFs. Perhaps the indirect effects of non-TFs on gene expression will better correlate with downstream phenotypes than the direct effects of TFs. However, early studies on laboratory-derived mutations showed that there were no significant differences between TFs and non-TFs in terms of their effects on gene expression [53]. Therefore, we suspect that our results will be applicable to naturally occurring polymorphisms in non-TFs as well. We have also not found any distinction between cis - and trans-QTN. While all four QTN act like eQTL “hot spots”, either cis - or trans-eQTL can can explain large proportions of the variation in gene expression (RSF1c and IME1nc) or in phenotype (RME1nc and IME1c). These results suggest that, along with the amount of gene expression variation explained by a given QTN, the identity and function of the particular genes affected may be important in identifying the eQTL that has the most significant role in controlling phenotypic variation.
Materials and Methods
Experimental design
The culture conditions for sporulation efficiency were modified from Gerke et al. [27] to accommodate larger samples for RNA-Seq preparations. Two replicates each of the 16 strains in the vineyard background allele replacement panel were grown for 14 hours at 30C in 96-well blocks containing 500 ul of Yeast Peptone Dextrose (YPD) medium with 2% dextrose. The replicates were pooled and diluted 1∶50 into 250 ml conical flasks containing 50 ml of 1% potassium acetate to induce sporulation. Cultures were grown for 30 hours and sporulation efficiencies were measured as described in Gerke et al. [27]. The entire procedure was repeated on different days until we had four biological replicates for each strain.
For RNA-Seq, cultures were grown as described above but growth was stopped after 2 hours in potassium acetate by spinning cells down and freezing the cell pellets at −80°C. Cells were harvested at this stage and total RNA was extracted [20]. The entire procedure including total RNA extraction was repeated on different days until we had four biological replicates for each strain.
mRNA was extracted with the DynaI mRNA DIRECT kit (Life Technologies) and fragmented with a Covaris Focused ultrasonicator. mRNA extraction and fragmentation, random hexamer priming of cDNA and Illumina library preparations were done by the Genome Technology Access Center (GTAC) at Washington University in St. Louis (https://gtac.wustl.edu) using standard procedures [54]. The liquid handling steps from the mRNA extraction stage onwards were performed on all 64 samples simultaneously using the Caliper Sciclone Automated Liquid Handling Workstation (PerkinElmer).
RNA-seq
Illumina libraries were prepared from the cDNA of each of the 64 samples. We obtained libraries from all the samples except the strain with vineyard alleles of RME1nc, RSF1c, IME1nc and oak allele of IME1c which had only 3 replicates for the subsequent analyses. The libraries were indexed separately and pooled into one sequencing reaction. The pool was run on multiple lanes until we obtained a minimum of 4 million reads per sample. The sequencing reads for each sample were combined across all sequencing runs. If present, adapter dimers were removed and the sequencing reads were aligned to the Verified and Uncharacterized open reading frames (ORFs) in the S. cerevisiae reference genome (S288C, genome release R63-1-1, Saccharomyces Genome Database (SGD, http://www.yeastgenome.org/)) using Bowtie, version 0.12.7 [55]. Only unique alignments with maximum 2 mismatches in the –best alignment mode were accepted. The counts for all the reads aligned to a given ORF were summed to give the raw counts per ORF. The raw counts were scaled to account for differences in sequencing depths per sample by calculating the normalized count values across all samples as described in DESeq, version 1.9.11 [56]. To normalize samples, the ratio of a gene's counts to its geometric mean across all the samples was calculated for each gene. Assuming that most genes are not differentially expressed, the scaling factor for each sample was the median of the ratios of all the genes in the sample. For each gene in a given sample, the counts were then normalized by the scaling factor for that sample. The normalized gene counts were used for all further analyses. The lowest 20th percentile of ORFs, based on the sum of the normalized counts across all samples for the given ORF, was removed to reduce the number of tested hypotheses and false positives. 4633 ORFs out of the initial 5792 ORFs remained after the filtering stage.
The normalized gene counts and the raw expression data discussed in this publication have been deposited in NCBI's Gene Expression Omnibus [57] and are accessible through GEO Series accession number GSE55409 (http://www.ncbi.nlm.nih.gov/geo/query/acc.cgi?acc=GSE55409).
Statistical analyses
All statistical analyses were performed in R [58]. Linear regression was performed using the lm function in R. The genes whose expression is best explained by the genotype of the sporulation QTN were found in a two-step process. To eliminate any variation due to growing the allele replacement panel on different days, for a given ORF, i, we computed the residual gene expression (εi) for all 4633 ORFs after removing the additive effect of the day of growth (DAY) on the normalized counts (Ni) of each ORF. Thus, the DAY model was applied on a gene-by-gene basis resulting in 4633 gene-specific DAY models.

The residual gene expression from the DAY models was used in subsequent analyses. For each gene, the effect of the sporulation QTN on gene expression was computed in a second linear model by regressing the genotype of each of the four QTN (RME1nc, RSF1c, IME1c and IME1nc) on the residual gene expression from the previous modeling step. Again, 4633 gene-specific expression models were run. The in the model below indicates that both additive and interaction effects were considered.

The effect of the sporulation QTN on gene expression was also compared to results from alternative model where the effect of DAY as well as the genotype of each of the four QTN (RME1nc, RSF1c, IME1c and IME1nc) was regressed on the log-transformed normalized expression counts of each gene.

We used the Benjamini-Hochberg procedure [59] on the model p-values to control the False Discovery Rate (FDR) to 10% and obtained 289 significant models. The unadjusted p-value of the significant models was 0.006 or lower. We also assessed significance of the gene expression models by permuting the genotype designations on all 63 samples and regressing the effect of the permuted genotype on the residual expression from the DAY model for all ORFs. The p-value corresponding to the lowest 5th percentile was obtained from the distribution of model p-values across the genome. The permutations and genotype modeling were repeated 1000 times to determine the distribution of the 5th percentile of model p-values. We found the unadjusted p-value threshold from the FDR control to be almost 2 standard deviations below the average of the distribution of 5th percentile model p-values obtained from the permutations. Since the FDR p-value threshold was more stringent than that obtained from the permutations above, we performed the remaining analyses on the 289 significant models.
The effect of individual QTN on gene expression was found by comparing nested models using ANOVA and calculating the fraction of variance explained by all significant factors of the given allele. In the ANOVA analysis, individual factors were considered to be statistically significant with a fairly permissive threshold (f-statistic p-value<0.1). We chose to report the effect of each variant as the computed variance explained by each variant, rather than the magnitude of the regression coefficients. We chose this metric because genes are expressed on very different scales which makes it difficult to interpret effect sizes across genes.
The coefficient of variation (CV = σ/μ) of the expression of each ORF across all four biological replicates was calculated for all 5792 ORFs in the genome. For a given ORF, σ represents the standard deviation of gene expression counts across the four biological replicates and μ represents the mean of gene expression counts across the biological replicates. To remove the effect of day of growth and to perform this particular analysis on the original expression scale, the normalized expression counts (using the DESeq normalization procedure) for each gene were further normalized for day-to-day variation as follows. A given day was arbitrarily chosen as Day A. For each ORF, the fitted values from the DAY model for all samples grown on a given day represent the mean expression of the ORF across all 16 strains in the panel for the given day. Variation due to the growing the allele replacement panel on different days was removed by dividing Ni, the normalized gene expression counts for the ORF by the ratio of the mean expression of the particular ORF on a given day to the mean expression of that ORF in the 16 strains grown on day A. These “day-corrected” expression values were used for the CV calculations as well as for the heat map (Figure S1).
The wilcoxon rank sum test was applied using the standard wilcox.test function in R [58]. Enrichment analysis for gene-ontology (GO) categories was performed using the functional category analysis tools at DAVID Bioinformatics Resource 6.7 [60], [61].
Supporting Information
Zdroje
1. StrangerBE, StahlEA, RajT (2011) Progress and promise of genome-wide association studies for human complex trait genetics. Genetics 187 : 367–383.
2. LitiG, LouisEJ (2012) Advances in quantitative trait analysis in yeast. PLoS Genet 8: e1002912.
3. FlintJ, MackayTF (2009) Genetic architecture of quantitative traits in mice, flies, and humans. Genome Res 19 : 723–733.
4. MauranoMT, HumbertR, RynesE, ThurmanRE, HaugenE, et al. (2012) Systematic localization of common disease-associated variation in regulatory DNA. Science 337 : 1190–1195.
5. BremRB, YvertG, ClintonR, KruglyakL (2002) Genetic dissection of transcriptional regulation in budding yeast. Science 296 : 752–755.
6. CheungVG, ConlinLK, WeberTM, ArcaroM, JenKY, et al. (2003) Natural variation in human gene expression assessed in lymphoblastoid cells. Nat Genet 33 : 422–425.
7. BremRB, KruglyakL (2005) The landscape of genetic complexity across 5,700 gene expression traits in yeast. Proc Natl Acad Sci U S A 102 : 1572–1577.
8. GagneurJ, StegleO, ZhuC, JakobP, TekkedilMM, et al. (2013) Genotype-environment interactions reveal causal pathways that mediate genetic effects on phenotype. PLoS Genet 9: e1003803.
9. SmithEN, KruglyakL (2008) Gene-environment interaction in yeast gene expression. PLoS Biol 6: e83.
10. YvertG, BremRB, WhittleJ, AkeyJM, FossE, et al. (2003) Trans-acting regulatory variation in Saccharomyces cerevisiae and the role of transcription factors. Nat Genet 35 : 57–64.
11. NicaAC, DermitzakisET (2013) Expression quantitative trait loci: present and future. Philos Trans R Soc Lond B Biol Sci 368 : 20120362.
12. GiladY, RifkinSA, PritchardJK (2008) Revealing the architecture of gene regulation: the promise of eQTL studies. Trends Genet 24 : 408–415.
13. MajewskiJ, PastinenT (2011) The study of eQTL variations by RNA-seq: from SNPs to phenotypes. Trends Genet 27 : 72–79.
14. JansenRC, NapJP (2001) Genetical genomics: the added value from segregation. Trends Genet 17 : 388–391.
15. CurtisC, ShahSP, ChinSF, TurashviliG, RuedaOM, et al. (2012) The genomic and transcriptomic architecture of 2,000 breast tumours reveals novel subgroups. Nature 486 : 346–352.
16. NicolaeDL, GamazonE, ZhangW, DuanS, DolanME, et al. (2010) Trait-associated SNPs are more likely to be eQTLs: annotation to enhance discovery from GWAS. PLoS Genet 6: e1000888.
17. LiQ, SeoJH, StrangerB, McKennaA, Pe'erI, et al. (2013) Integrative eQTL-based analyses reveal the biology of breast cancer risk loci. Cell 152 : 633–641.
18. GrundbergE, SmallKS, HedmanAK, NicaAC, BuilA, et al. (2012) Mapping cis - and trans-regulatory effects across multiple tissues in twins. Nat Genet 44 : 1084–1089.
19. CooksonW, LiangL, AbecasisG, MoffattM, LathropM (2009) Mapping complex disease traits with global gene expression. Nat Rev Genet 10 : 184–194.
20. GerkeJP, ChenCT, CohenBA (2006) Natural isolates of Saccharomyces cerevisiae display complex genetic variation in sporulation efficiency. Genetics 174 : 985–997.
21. HonigbergSM, PurnapatreK (2003) Signal pathway integration in the switch from the mitotic cell cycle to meiosis in yeast. J Cell Sci 116 : 2137–2147.
22. KassirY, AdirN, Boger-NadjarE, RavivNG, Rubin-BejeranoI, et al. (2003) Transcriptional regulation of meiosis in budding yeast. Int Rev Cytol 224 : 111–171.
23. VershonAK, PierceM (2000) Transcriptional regulation of meiosis in yeast. Curr Opin Cell Biol 12 : 334–339.
24. DeutschbauerAM, DavisRW (2005) Quantitative trait loci mapped to single-nucleotide resolution in yeast. Nat Genet 37 : 1333–1340.
25. Ben-AriG, ZenvirthD, ShermanA, DavidL, KlutsteinM, et al. (2006) Four linked genes participate in controlling sporulation efficiency in budding yeast. PLoS Genet 2: e195.
26. TomarP, BhatiaA, RamdasS, DiaoL, BhanotG, et al. (2013) Sporulation genes associated with sporulation efficiency in natural isolates of yeast. PLoS One 8: e69765.
27. GerkeJ, LorenzK, CohenB (2009) Genetic interactions between transcription factors cause natural variation in yeast. Science 323 : 498–501.
28. GerkeJ, LorenzK, RamnarineS, CohenB (2010) Gene-environment interactions at nucleotide resolution. PLoS Genet 6: e1001144.
29. SmithHE, DriscollSE, SiaRA, YuanHE, MitchellAP (1993) Genetic evidence for transcriptional activation by the yeast IME1 gene product. Genetics 133 : 775–784.
30. Rubin-BejeranoI, MandelS, RobzykK, KassirY (1996) Induction of meiosis in Saccharomyces cerevisiae depends on conversion of the transcriptional represssor Ume6 to a positive regulator by its regulated association with the transcriptional activator Ime1. Mol Cell Biol 16 : 2518–2526.
31. CovitzPA, MitchellAP (1993) Repression by the yeast meiotic inhibitor RME1. Genes Dev 7 : 1598–1608.
32. LuL, RobertsG, SimonK, YuJ, HudsonAP (2003) Rsf1p, a protein required for respiratory growth of Saccharomyces cerevisiae. Curr Genet 43 : 263–272.
33. RobertsGG3rd, HudsonAP (2009) Rsf1p is required for an efficient metabolic shift from fermentative to glycerol-based respiratory growth in S. cerevisiae. Yeast 26 : 95–110.
34. JambhekarA, AmonA (2008) Control of meiosis by respiration. Curr Biol 18 : 969–975.
35. MitchellAP, DriscollSE, SmithHE (1990) Positive control of sporulation-specific genes by the IME1 and IME2 products in Saccharomyces cerevisiae. Mol Cell Biol 10 : 2104–2110.
36. WangZ, GersteinM, SnyderM (2009) RNA-Seq: a revolutionary tool for transcriptomics. Nat Rev Genet 10 : 57–63.
37. LevinJZ, YassourM, AdiconisX, NusbaumC, ThompsonDA, et al. (2010) Comprehensive comparative analysis of strand-specific RNA sequencing methods. Nat Methods 7 : 709–715.
38. ToungJM, MorleyM, LiM, CheungVG (2011) RNA-sequence analysis of human B-cells. Genome Res 21 : 991–998.
39. AndersenG, BjornbergO, PolakovaS, PynyahaY, RasmussenA, et al. (2008) A second pathway to degrade pyrimidine nucleic acid precursors in eukaryotes. J Mol Biol 380 : 656–666.
40. DengC, SaundersWS (2001) RIM4 encodes a meiotic activator required for early events of meiosis in Saccharomyces cerevisiae. Mol Genet Genomics 266 : 497–504.
41. Garcia-AlvarezN, TeichertU, WolfDH (1987) Proteinase yscD mutants of yeast. Isolation and characterization. Eur J Biochem 163 : 339–346.
42. SmithHE, SuSS, NeigebornL, DriscollSE, MitchellAP (1990) Role of IME1 expression in regulation of meiosis in Saccharomyces cerevisiae. Mol Cell Biol 10 : 6103–6113.
43. CheungVG, SpielmanRS (2009) Genetics of human gene expression: mapping DNA variants that influence gene expression. Nat Rev Genet 10 : 595–604.
44. OrozcoLD, BennettBJ, FarberCR, GhazalpourA, PanC, et al. (2012) Unraveling inflammatory responses using systems genetics and gene-environment interactions in macrophages. Cell 151 : 658–670.
45. RockmanMV, KruglyakL (2006) Genetics of global gene expression. Nat Rev Genet 7 : 862–872.
46. WaddingtonCH (1942) Canalization of development and the inheritance of acquired characters. Nature 150 : 563–565.
47. AriasAM, HaywardP (2006) Filtering transcriptional noise during development: concepts and mechanisms. Nat Rev Genet 7 : 34–44.
48. FuJ, KeurentjesJJ, BouwmeesterH, AmericaT, VerstappenFW, et al. (2009) System-wide molecular evidence for phenotypic buffering in Arabidopsis. Nat Genet 41 : 166–167.
49. RajA, RifkinSA, AndersenE, van OudenaardenA (2010) Variability in gene expression underlies incomplete penetrance. Nature 463 : 913–918.
50. ClemmonsAW, WassermanSA (2013) Combinatorial effects of transposable elements on gene expression and phenotypic robustness in Drosophila melanogaster development. G3 (Bethesda) 3 : 1531–1538.
51. RubinsteinA, GurevichV, Kasulin-BonehZ, PnueliL, KassirY, et al. (2007) Faithful modeling of transient expression and its application to elucidating negative feedback regulation. Proc Natl Acad Sci U S A 104 : 6241–6246.
52. AndersonSF, SteberCM, EspositoRE, ColemanJE (1995) UME6, a negative regulator of meiosis in Saccharomyces cerevisiae, contains a C-terminal Zn2Cys6 binuclear cluster that binds the URS1 DNA sequence in a zinc-dependent manner. Protein Sci 4 : 1832–1843.
53. HughesTR, MartonMJ, JonesAR, RobertsCJ, StoughtonR, et al. (2000) Functional discovery via a compendium of expression profiles. Cell 102 : 109–126.
54. WilhelmBT, LandryJR (2009) RNA-Seq-quantitative measurement of expression through massively parallel RNA-sequencing. Methods 48 : 249–257.
55. LangmeadB, TrapnellC, PopM, SalzbergSL (2009) Ultrafast and memory-efficient alignment of short DNA sequences to the human genome. Genome Biol 10: R25.
56. AndersS, HuberW (2010) Differential expression analysis for sequence count data. Genome Biol 11: R106.
57. EdgarR, DomrachevM, LashAE (2002) Gene Expression Omnibus: NCBI gene expression and hybridization array data repository. Nucleic Acids Res 30 : 207–210.
58. Team RC (2012) R: A language and environment for statistical computing. R Foundation for Statistical Computing, Vienna, Austria.
59. BenjaminiY, HochbergY (1995) Controlling the false discovery rate: a practical and powerful approach to multiple testing. Journal of the Royal Statistical Society Series B 57 : 289–300.
60. Huang daW, ShermanBT, LempickiRA (2009) Bioinformatics enrichment tools: paths toward the comprehensive functional analysis of large gene lists. Nucleic Acids Res 37 : 1–13.
61. Huang daW, ShermanBT, ZhengX, YangJ, ImamichiT, et al. (2009) Extracting biological meaning from large gene lists with DAVID. Curr Protoc Bioinformatics Chapter 13: Unit 13 11.
Štítky
Genetika Reprodukční medicínaČlánek vyšel v časopise
PLOS Genetics
2014 Číslo 5
Nejčtenější v tomto čísle
- PINK1-Parkin Pathway Activity Is Regulated by Degradation of PINK1 in the Mitochondrial Matrix
- Null Mutation in PGAP1 Impairing Gpi-Anchor Maturation in Patients with Intellectual Disability and Encephalopathy
- Phosphorylation of a WRKY Transcription Factor by MAPKs Is Required for Pollen Development and Function in
- p53 Requires the Stress Sensor USF1 to Direct Appropriate Cell Fate Decision