
Hidden Diversity in Honey Bee Gut Symbionts Detected by Single-Cell Genomics
Gut microbial communities are often complex, consisting of bacteria from divergent phyla as well as multiple strains of each of the constituent species. But because the composition of these communities is typically assessed using 16S rRNA analyses, little is known about genomic changes associated with in situ diversification of bacterial lineages in animal guts. We undertook a single-cell genomic approach to investigate the diversification within two species of the gut microbiota of honey bees. Each species exhibited a surprisingly high level of genomic variation, despite uniformity in the 16S rRNA sequences. Our data indicate that genetically and ecologically distinct lineages can evolve in the gut of the same host species in the presence of frequent recombination at 16S rRNA genes. These findings parallel observations from mammals, suggesting that in situ diversification of a few bacterial lineages is a common pattern in the evolution of gut communities.
Published in the journal:
. PLoS Genet 10(9): e32767. doi:10.1371/journal.pgen.1004596
Category:
Research Article
doi:
https://doi.org/10.1371/journal.pgen.1004596
Summary
Gut microbial communities are often complex, consisting of bacteria from divergent phyla as well as multiple strains of each of the constituent species. But because the composition of these communities is typically assessed using 16S rRNA analyses, little is known about genomic changes associated with in situ diversification of bacterial lineages in animal guts. We undertook a single-cell genomic approach to investigate the diversification within two species of the gut microbiota of honey bees. Each species exhibited a surprisingly high level of genomic variation, despite uniformity in the 16S rRNA sequences. Our data indicate that genetically and ecologically distinct lineages can evolve in the gut of the same host species in the presence of frequent recombination at 16S rRNA genes. These findings parallel observations from mammals, suggesting that in situ diversification of a few bacterial lineages is a common pattern in the evolution of gut communities.
Introduction
Animals contain complex bacterial communities in their guts that can impact health status [1]–[3]. In mammals, the phylogenetic architecture of gut communities has been described as fan-like, with few deep - and intermediate-branching lineages, but with many shallow branches [3]. Most of these bacteria live exclusively in the gut environment, suggesting that phylogenetic clusters have evolved in situ through diversification of a few founder species.
Diversity of gut communities is typically assessed using deep-sequencing of 16S rRNA PCR amplicons [4], [5], often with the aim of illuminating community differences between closely related hosts or between hosts with different environments or diets [6]–[9]. To this end, 16S rRNA sequences are clustered into operational taxonomic units (OTUs), and a cutoff of 97–98% identity is applied to discriminate these clusters. However, 16S rRNA studies have limited use for predicting functional differences or for understanding micro-evolutionary changes in gut communities, as bacteria with almost identical 16S rRNA sequences can exhibit high levels of sequence divergence at other loci and very different gene repertoires [10]–[12]. Consequently, little is known about diversification of bacterial lineages in the gut.
Insect gut communities are relatively small and simple, and thus can serve as model systems to explore diversification in gut bacteria [13]. In particular, honey bees (genus Apis) and related bumble bees (genus Bombus) harbor characteristic gut communities dominated by <10 bacterial species in three phyla: Proteobacteria, Firmicutes, and Actinobacteria. Most of the bacterial taxa in honey bees are not found in other environments or in solitary bee species but are consistently present and abundant in the guts of adult Apis and Bombus [14]–[23]. Thus, these bacteria are adapted to live in the guts of social bees and likely possess specific symbiotic mechanisms affecting health of the host. Apis and Bombus are important pollinators and have suffered from severe population declines [24]–[26]. Therefore, studies on the characteristic bee gut microbiota are of interest not only for basic understanding of microbial communities, but also for potential applications in agriculture and biotechnology.
Metagenomic analyses provided initial insights into the functional gene content of the gut symbionts of the honey bee, Apis mellifera [22], and revealed polymorphism within two of the core species, Gilliamella apicola (Gammaproteobacteria) and Snodgrassella alvi (Betaproteobacteria), which were each classified as single species on the basis of previous 16S rRNA analyses [20], [21], [27]. Reference genomes of Apis and Bombus isolates of G. apicola and S. alvi are now available [28] facilitating comparative analyses of the genomic variation across strains from conspecific and heterospecific hosts.
Here, we used single-cell genomics to investigate the genomic variation in S. alvi and G. apicola sampled from a single colony of A. mellifera. By sorting individual bacterial cells from specific gut regions of adult worker bees, we were able to sequence genomic DNA of four single cells of S. alvi and of three single cells of G. apicola and compare their genomes against the completely sequenced reference strains. These analyses revealed surprising levels of genomic divergence between strains with near-identical 16S rRNA and illustrate the applicability of single-cell genomics for population genomic studies of host-associated bacteria.
Results
Sorting single bacterial cells of S. alvi and G. apicola from the gut of A. mellifera
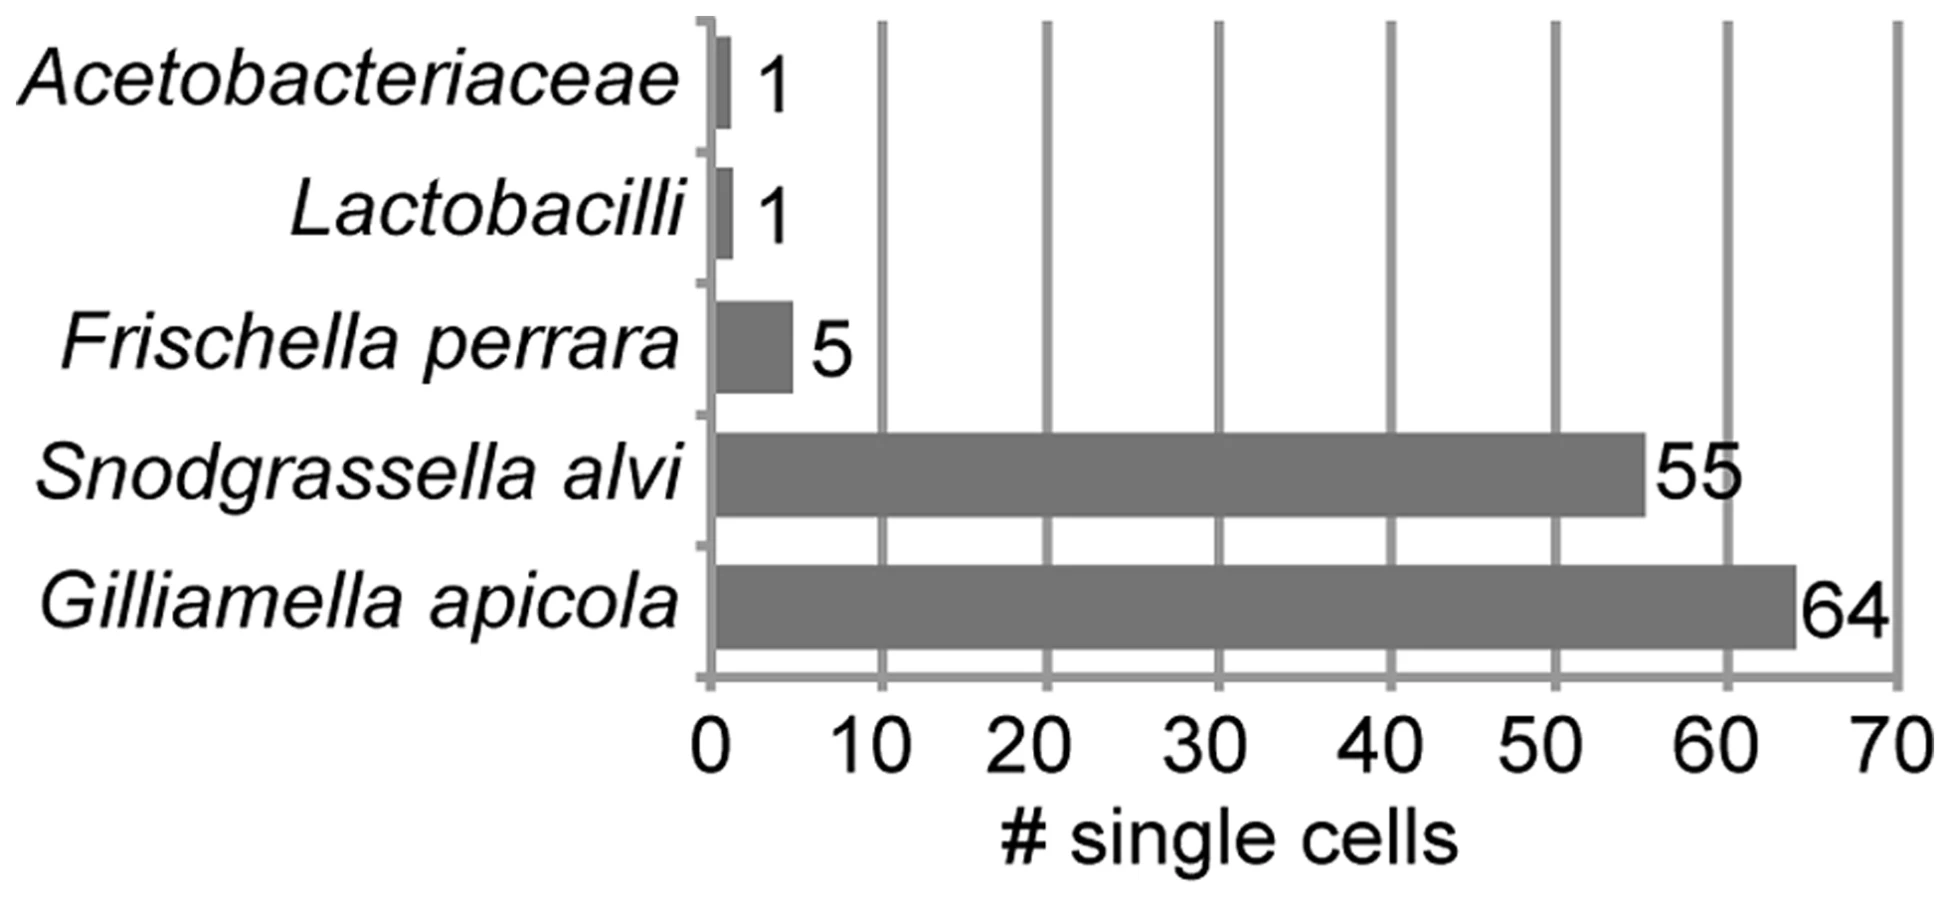
We sorted 315 single bacterial cells from homogenate of the midgut and ileum gut regions of ten A. mellifera workers collected on the same day from a single colony in West Haven, CT, USA (Figure S1). Following bacterial lysis and multidisplacement amplification (MDA), we obtained detectable DNA enrichment for 300 of the 315 cells (95%) (Figure S2). Of the 315 sorted cells, 216 were confirmed to contain bacterial DNA using PCR of a partial fragment of the 16S rRNA gene (Figure S2). We sequenced 16S rRNA amplicons for a random selection of 126 of these 216 single amplified genomes (SAGs) and found that all 126 belonged to core members of the gut microbiota of A. mellifera (Table S1). As expected, most were S. alvi and G. apicola (Figure 1). However, a few cells of other core members were also identified, i.e. five cells of Frischella perrara (Gammaproteobacteria) [29], one Firmicute, and one Alphaproteobacterium.
16S rRNA sequence analysis of S. alvi and G. apicola SAGs
Phylogenetic trees based on partial 16S rRNA sequences showed that SAGs of S. alvi and G. apicola both formed monophyletic clades together with their corresponding type strains, S. alvi wkB2 and G. apicola wkB1, both previously isolated from A. mellifera [27] (Figure 2). Sequences originating from other bee species clustered outside the A. mellifera-specific clades, including the Bombus isolates for which genome sequences are available (S. alvi wkB12 and wkB29 and G. apicola wkB11 and wkB30). However, due to the high similarity between 16S rRNA sequences, most nodes within the species-clusters were not supported by bootstrap analyses. The average pairwise sequence divergence (π) between all analyzed SAGs was 0.27% and 0.56% for S. alvi and G. apicola, respectively. The average π for representative sequences originating from strains of different bee species was higher, at 0.67% and 2.47% for S. alvi and G. apicola, respectively.

Genomic sequencing and de novo assembly of S. alvi and G. apicola SAGs
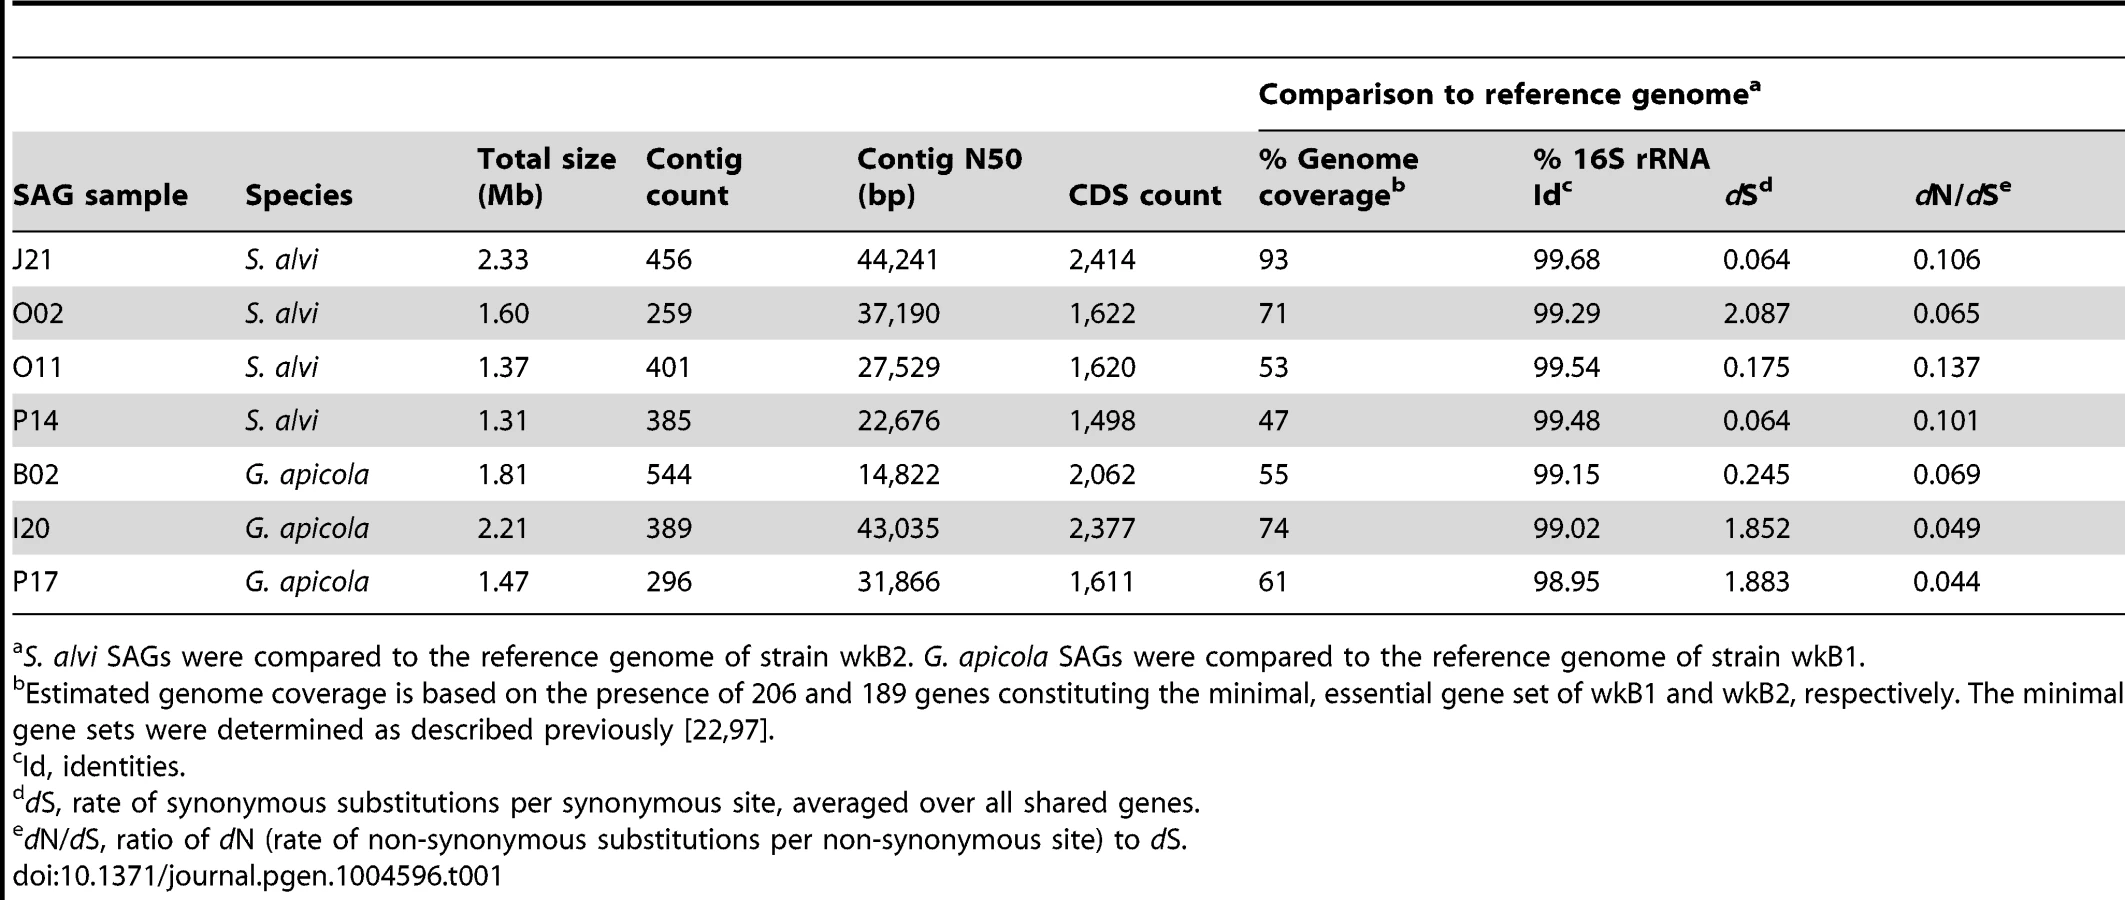
To analyze genome-wide diversity, we shotgun-sequenced four SAGs of S. alvi (J21, O02, O11, P14) and three SAGs of G. apicola (B02, I20, P17) in a single multiplexed Illumina lane (Table 1). SAGs were selected based on distinct positions in the 16S rRNA gene trees (Figure 2) and their low Cp (critical point) values, i.e. the time required to produce half of the maximal fluorescence during the MDA reaction (Figure S2). Low Cp values are indicative for ample template DNA, which should result in a less biased DNA amplification and better coverage of the genome (R. Stepanauskas, unpublished data). For each SAG, we generated first-pass assemblies with SPAdes [30] and detected some low-coverage contigs originating from misassigned reads, i.e., reads assigned to the wrong dataset due to dense clustering on the Illumina flow cell [31] (see Materials and Methods for details). Following removal of misidentified reads, the curated datasets consisting of 25–32 million reads were re-assembled. Resulting contigs were included in subsequent analyses only if they met our quality criteria which were based on read coverage, contig length, redundancy, and homology (see Materials and Methods for details). The final assemblies consist of 259–544 contigs and range in total size from 1.31 Mb to 2.33 Mb (Table 1).
Genomic variation and sequence divergence patterns between SAGs and reference genomes
Based on the coverage of a minimal, essential gene set defined for the fully sequenced reference genomes of S. alvi wkB2 and G. apicola wkB1, genome completeness of the sequenced SAGs was estimated to range from 47% to 93% (Table 1). We determined orthologous gene sets present in SAGs and reference genomes, mapped these onto the reference genome, and found that large genomic regions were missing from SAG assemblies (Figure S3). Many of these missing regions likely reflect incomplete genome recovery from the single cells. Missing regions are erratically distributed (Figure S3), suggesting that they correspond to random processes (e.g., incomplete single cell lysis and the stochastic nature of single cell MDA) rather than compositional variation among genomic regions, consistent with prior studies [32], [33].
Despite missing regions, we determined a shared set of 239 genes for S. alvi and 400 genes for G. apicola (Figure S4). Analysis of these orthologs revealed extended intraspecific variation in divergence at synonymous sites (dS, estimated rate of synonymous substitutions per site). This was unexpected, because the analyzed strains show similar divergence at 16S rRNA gene loci (Table 1). Genome-wide dS values between SAGs and reference genome range from 0.064 to 2.087 for S. alvi and from 0.245 to 1.883 for G. apicola (Table 1). dS values of individual genes show similarly extreme variation in divergence across strains (Figures 3A and 3B). With many orthologs exhibiting dS values near or at saturation (i.e. dS values ≥3), O02 of S. alvi and I20 and P17 of G. apicola are the most divergent SAGs compared to their respective reference genome. These SAGs seem to be almost as divergent from other honey bee isolates as they are from strains isolated from Bombus species (Figures 3A and 3B).

For both S. alvi and G. apicola, phylogenetic trees inferred from concatenated protein-encoding genes differ from 16S rRNA gene trees (Figures 3C and 3D). Strains from A. mellifera do not form a single monophyletic clade exclusive of Bombus strains. For S. alvi, three of the four SAGs (J21, O11, P14) and the reference strain from A. mellifera (wkB2) form a tight clade, but the most divergent SAG, O02, occupies a basal branch within the S. alvi cluster. For G. apicola, two strains from A. mellifera (B02 and wkB1) form a clade that is sister to the clade of Bombus strains (wkB11 and wkB30); the other G. apicola strains from A. mellifera (P17 and I20) form a more basally branching clade. Thus, trees for both G. apicola and S. alvi support divergence among A. mellifera strains that started before and continued after the divergence from Bombus strains. Most relevant branches are supported by high bootstrap values (≥80) and by topology concordance of the majority of the single gene trees (≥50% of the analyzed genes) (Figures 3C and 3D).
Patterns of recombination between SAGs and reference genomes
For both S. alvi and G. apicola, 16S rRNA sequences are highly similar across closely related and highly divergent strains. This could reflect the occurrence of frequent homologous recombination at 16S rRNA loci resulting in sequence homogenization [34]. Using the four-gamete test under the infinite sites assumption (i.e. repeat mutations have zero probability), we found that at least 1 and at least 8 recombination events must have occurred between the 16S rRNA sequences of the ancestors of SAGs of S. alvi and G. apicola, respectively. This finding is concordant with a previous study showing homologous recombination of 16S rRNA genes in both S. alvi and G. apicola, with higher rates in G. apicola [20]. To test whether other genes of S. alvi and G. apicola show signs of recombination, we (i) examined single gene trees for topology discordance with the concatenated gene tree, (ii) analyzed patterns of sequence divergence at synonymous sites, (iii) determined the frequency at which substitutions occurred by mutation or recombination, and (iv) detected intragenic recombination events between orthologous genes.
Patterns of recombination in S. alvi
The O02 lineage of S. alvi appears to have low recombination rates with the other analyzed strains, as most single gene trees (75%) support its basal position (Figure 3C), and most trees with incongruent topologies have weak support for the position of O02 (Figure S6). In contrast, for the more closely related strains (J21, P14, O11, and wkB2), many single gene trees show discordant topologies (Figure S6), indicating either recombination and/or insufficient phylogenetic signal.
In the absence of recombination, dS values for a pair of genomes will reflect their divergence time and will show a consistent pattern across genes, but recombination will cause some genes to have anomalous dS values. We plotted dS values in ternary plots, in which the sum of all values for three pairwise comparisons equals 1. For the ternary plot of O02, P14, and J21, most genes exhibit similar divergence patterns, with dS values ∼40× lower for J21-P14 than for J21-002 or P14-O02 (Figure 4A), indicating deeper branching of 002 and little subsequent recombination. Of the 13 genes dispersed over the plot area. 12 fell within three regions in the wkB1 reference genome, one encoding genes for urease and two encoding genes for efflux permeases (Table S2). A sliding window analysis over the aligned sequences of the urease-encoding gene cluster showed that sequence divergence between O02 and both J21 and P14 drops from high to very low (Figure 5A), suggesting that the recombination breakpoint is located in the middle of the locus. Ternary plot analysis of the three closely related SAGs, J21, O11, and P14, showed much more dispersal of genes (Figure 4A), mostly reflecting low dS values that do not differ significantly. However, a considerable number of the dispersed genes show dS values >0.1 (Figure 4A), suggesting that intraspecific recombination contributed to this variation in sequence divergence.


To determine the relative importance of recombination versus mutation in sequences of S. alvi strains, we estimated the ratio (r/m) at which substitutions are generated via recombination (r) or mutation (m) across the 239 shared genes. Most r/m values were <1 for the closely related S. alvi strains, suggesting that mutations contribute more to their evolution. For the distant strain, O02, no reliable estimates could be obtained due to saturation of substitutions at most sites (Table S3).
Small fragments of genes exchanged by recombination might be missed by our phylogenetic or divergence analyses based on whole genes. Therefore, we tested for the occurrence of intragenic recombination within shared genes and found that 7–19% of genes carried signs of past recombination events (Figure S7). In agreement with its divergent phylogenetic position, O02 had the fewest genes with intragenic recombination (7%), while all other strains had at least 15% affected genes. Average recombination fragment length generally decreased with increasing phylogenetic distance of the analyzed strains (Figure S7).
Patterns of recombination in G. apicola
Most genes display congruent topologies for the splits between the three SAGs and the reference strain of G. apicola, providing no evidence for frequent recombination among their ancestors (Figure 3D). Consistent with this, the ternary plot analysis does not detect much variation in relative dS among the shared genes, as indicated by low dispersal over the plot area (Figure 4B). However, dS is near saturation for many genes, possibly obscuring evolutionary rate differences. Nevertheless, a slight dispersal of dS values along the axis plotting the comparison of I20 and P17 is evident. Concordantly, dS values for these two strains vary markedly among orthologs, in contrast to the other pairwise comparisons, for which most orthologs exhibit uniform dS values (Figure 4B, Figure S8). I20 and P17 form one of the two A. mellifera-associated clades of G. apicola, and the variation in dS suggests a high frequency of recombination in this particular sub-lineage. This was confirmed by estimates of r/m, revealing very high rates of recombination (5.1–23.5) for I20 and P17. In contrast, r/m ratios for B02 and the reference genome wkB1 are much lower (0.4–0.8) (Table S3). The differences in recombination frequencies among G. apicola strains are further corroborated by the analysis for intragenic recombination. Recombination is evident in all pairwise comparisons, but is highest for I20 versus P17 (Figure S7B) for which 15% of shared genes (60 of 400 genes) show evidence of at least one recombination event. In comparison, only 2–4% of the 400 shared genes show signs of recombination between any other pair of G. apicola genomes. A sliding window analysis over a genomic region of G. apicola illustrates these differences in recombination frequency between P17 and I20, and B02 and wkB2 (Figure 5B).
Functional differences between strains of S. alvi and G. apicola
Despite the clear evidence for recombination in both S. alvi and G. apicola, strains from the same bee colony can be highly divergent, potentially reflecting adaptation to distinct ecological niches in the bee gut. To test for differences in functional gene content between strains, we determined the accessory gene pool of SAGs, which we defined as the genes present in SAGs but absent from the completely sequenced reference genomes. Based on this criterion, we found 755 and 851 accessory genes for S. alvi and G. apicola, respectively (Figure S4). For S. alvi, the accessory gene pool is dominated by categories covering a broad range of functions (Figure 6A). Among others, we found a considerable number of genes associated with mobile elements such as phages, plasmids, or transposons, and restriction-modification systems. In agreement with its distant phylogenetic position, strain O02 has the largest accessory gene pool, with 258 unique genes (Figure S4), suggesting that O02 differs substantially from other sampled strains in its functional capabilities. However, many of these genes are annotated as hypotheticals, preventing prediction of their functional roles.

For G. apicola, 20% of the accessory genes encode carbohydrate-related functions, including many transporters of the phosphotransferase system and major facilitator families, and another 7% corresponds to amino acid transport and metabolism (Figure 6B). These marked differences in gene content linked to metabolic functions suggest distinct ecological roles and effects in the host.
Discussion
Studies of bacterial diversity typically focus on 16S rRNA gene sequences. But such analyses give only limited understanding of bacterial diversification. We found high variation in intraspecific sequence divergence for both G. apicola and S. alvi, despite uniformly high 16S rRNA similarity. Some strains originating from A. mellifera are as divergent from each other as from strains isolated from Bombus species. They exhibit saturation of dS and form deep-branching lineages in phylogenies based on protein-encoding genes. Despite high sequence divergence, interstrain recombination was evident, but its frequency varies and generally decreases with increasing divergence between strains. The accessory gene sets of G. apicola imply that strains differ in metabolic functions, which could reflect divergent adaptation to different niches in the gut environment.
Application of single-cell sequencing for population genomic analyses
We sorted single cells directly from their environment to obtain an unbiased picture of genomic variation within populations. While isolates of G. apicola and S. alvi have been grown in the laboratory [27], culturing often introduces sampling biases [35]–[38], as certain strains possess metabolically costly genes or lytic phages which hinder growth in culture [39]. The A. mellifera gut microbiota is particularly suitable, because its low species richness facilitates high-frequency retrieval of single cells of the same species (i.e., cells with near-identical 16S rRNA sequences). By only targeting the bee gut ileum and midgut, we could increase the sorting frequency of G. apicola and S. alvi, which dominate in these regions [40]. Single-cell enrichment of specific bacteria from more complex communities, such as those in mammalian guts, may require a higher sorting throughput or specific labeling with fluorescent probes.
An obvious limitation of single-cell genomics for population genetic analysis is the incomplete recovery of genomes from single cells [41], [42]. We obtained 239 and 400 shared genes with an average genome completeness of 66% and 63% for four S. alvi SAGs and three G. apicola SAGs, respectively. These estimated genome recoveries were in the upper range of previous single-cell studies [35], [38], [43]–[47] and provided abundant genomic information for our analyses. Nevertheless, it is important to note that the number of shared genes rapidly decreases as SAGs are added to the analysis, due to the higher likelihood of a given gene being absent from one of the samples. Population genetic studies of larger SAG datasets would therefore require higher average genome coverage and new computational tools to take full advantage of partial genomes. Recent studies have shown that partial genomes can also be obtained from metagenomic datasets [48]–[51]. While metagenomic approaches might be cost-effective, reconstruction of closely related genomes is difficult, hindering evolutionary analysis of bacterial populations.
Do divergent strains of S. alvi and G. apicola correspond to separate species?
There is no generally accepted species concept for bacteria, and microbiologists use different criteria to delineate species [52]–[54]. A pragmatic and commonly applied convention uses 16S rRNA sequence similarity to define OTUs, with an arbitrary cut-off of 97% for species delineation [55]. However, this criterion is not an indicator of biologically meaningful boundaries between ecologically and genetically distinct populations, and bacterial strains with near-identical 16S rRNA may be adapted to different ecological niches or harbor distinct functional capabilities [11], [12], [35], [56], [57]. Most G. apicola and S. alvi strains investigated in this study share 99–100% sequence identity in 16S rRNA with their respective type strain (Table S1), but often show much higher divergence at other loci as well as very different gene repertoires (Figure 3 and Figure S4). This appears to reflect the slow evolution of rRNA genes. But compared to other pairwise analyses of bacteria [58], the extent of divergence of protein-encoding genes relative to 16S rRNA divergence is exceptionally high for the two honey bee gut symbionts analyzed in this study. Concerted evolution or ongoing homologous recombination at 16S rRNA loci (even when other genomic regions continuously diverge) could be two possible explanations for this phenomenon. It is not apparent why gut bacteria would have stronger purifying selection on rRNA genes than any other bacteria resulting in concerted evolution of these loci. Further, our analyses provide evidence that sequence homogenization likely originates from recombination. First, we found incongruence between tree topologies for 16S rRNA and those for protein-encoding genes (Figure 2 and Figure 3). Second, we detected recombination breakpoints in 16S rRNA sequences, which was consistent with a previously published analysis [20]. Consequently, 16S rRNA sequences fail to portray the extensive genetic diversity present in S. alvi and G. apicola populations, and other genomic regions must be considered to demarcate divergent intraspecific lineages. For example, O02 of S. alvi appears to have irreversibly separated from other strains. While frequent recombination and genome cohesion was evident among other S. alvi strains, O02 has undergone recombination in only a few genomic regions (Table S2). These few genes could correspond to adaptive functions important for survival in the shared habitat. The urease gene cluster, for example, might be responsible for tolerance to acidic conditions in the A. mellifera gut, based on the role of this enzyme in other host-associated bacteria [59].
Notably, divergent strains within S. alvi and G. apicola co-exist in an individual bee [20], suggesting that they may occupy different niches and constitute distinct ecotypes [60]. In G. apicola, a large proportion of the accessory gene pool consists of carbohydrate-related functions (Figure 6), which might play a role in divergent adaptation to different metabolic niches. This corroborates previous results showing that strains of G. apicola differ in ability to breakdown pectin, a major component of the cell wall of pollen [22], the major source of dietary protein of honey bees. Furthermore, the fully sequenced honey bee-associated strain wkB1 has a larger genome (3.14 Mb) than the two Bombus-associated strains (2.26 Mb, 2.32 Mb), largely due to an expanded set of genes involved in carbohydrate metabolism [28]. These results suggest the possibility that G. apicola strains affect the use of diverse carbohydrates present in the diets of different honey bee colonies.
Does intraspecific diversity influence host health?
Social bees are key pollinator species in almost all terrestrial ecosystems, including agricultural systems. In recent years, A. mellifera has undergone colony losses [25], and Bombus species have also suffered from population declines and extinctions [24], potentially influenced by pesticide usage and interactions with parasites. No consistent changes in microbiota are apparent in failing A. mellifera colonies [21], [61], but studies have been based on 16S rRNA, which lacks resolution to reveal differences in strain composition. Strain composition in the gut could affect nutrient availability or resistance to parasites. Preliminary support for such effects comes from experiments showing differences in G. apicola strains for pectin catabolism [22] and from experiments on Bombus showing that particular sources of gut symbionts vary in levels of protection against protozoan parasites [62]. Moreover, strains might vary in overall effects on hosts, from beneficial to neutral or even detrimental. All sampled A. mellifera workers harbor G. apicola and S. alvi, but differ in strain composition [20], and these differences potentially impact health of bee colonies.
What has caused the divergent evolution of S. alvi and G. apicola?
Diversification of S. alvi and G. apicola likely occurred within the bee gut environment, as both species have been detected exclusively in the guts of Bombus and Apis [14], [16]. It is possible that they descend from ancestors that colonized an Apis-Bombus ancestor living ∼85 million years ago [63]. Divergence of strains in different Apis and Bombus species reflects host evolutionary relationships, at least in part [64]. When transmission is largely intraspecific, divergence of strains confined to different host species is expected, and is likely reinforced by symbiont-host coevolution, resulting in barriers to colonization of non-native hosts. Parallel cases are Xenorhabdus species specialized to particular species of Steinernema nematodes [65] and Lactobacillus reuteri strains adapted to different vertebrate hosts [66], [67].
Our study focuses on strain variation that appears to have arisen due to diversification within a single host species, A. mellifera; this situation likely parallels that of the human gut microbiota [3], [68]. Diversification is likely driven by divergent selection reflecting ecologically distinct niches in the gut, but such diversifying selection might be countered by recombination with homologous DNA from other strains. Temporary isolation of host populations and colonies, followed by recontact and exchange of symbionts, might generate ecological and genomic diversity among symbiont strains. In A. mellifera, symbiont exchange among colonies likely occurs occasionally via robbing behaviors or foraging at the same flowers. The mode of colony founding, by a swarm containing hundreds of workers and a queen, also favors maintenance of strain diversity, because it does not impose a bottleneck in numbers of gut bacteria. In contrast, Bombus colonies are initiated annually from a single queen bee, potentially imposing a bottleneck that reduces diversity of gut bacteria. However, whether strain diversity of S. alvi and G. apicola is lower in Bombus hosts is unknown.
How general are our findings about the microevolution of gut bacteria?
The bacterial diversity in A. mellifera gut ecosystems consists of many closely related taxa, but relatively few deep-branching lineages, a pattern similar to that in mammalian gut microbiota [3], [5], [69]. Another parallel with mammalian systems is that strains categorized as single species on the basis of 16S rRNA can have extensive differences in genome content: as for S. alvi and G. apicola, over 25% of each genome may be unalignable across strains of human gut bacterial species [70]. In the human gut, strains are persistent within individual hosts and tend to be shared among relatives living together [70], [71]. Colony-specific strain composition also appears to occur in A. mellifera [20].
Although 16S rRNA sequences are typical markers for assessing diversity in bacterial communities, we found that they correlate poorly with genomic content and divergence at protein-coding loci. Because most studies of genome-wide patterns of variation are based on metagenomic samples which do not reveal linkage of 16S rRNA and protein-coding genes (e.g., [71]), it is unclear how often this discrepancy occurs. We propose the following model for how this might evolve. If populations are isolated, for example in different bee colonies, then their genomes will begin to diverge. However, protein-coding genes, particularly synonymous sites, will diverge faster than rRNA genes, in which contiguous regions are conserved due to strong purifying selection to maintain function. If recontact of populations occurs following an appropriate time interval, regions of the rRNA may retain sufficient similarity to recombine through homologous recombination pathways, which require near-identity for a region of >50 base pairs [72], while many or all protein-coding regions may exceed this divergence threshold. In this sense, the rRNA genes have not yet “speciated”, while protein-coding regions have. Ongoing coexistence could result in extensive recombination and homogenization at rRNA loci and continued divergence of protein-coding loci, increasing the discrepancy between their divergence levels. The continued coexistence of strains also suggests ecological specialization maintaining strain variation, as proposed for other communities (e.g., [73], [74]). Such specialization would reinforce the highly distinct gene repertoires of strains, such as those we observed. Experiments on metabolism and host-relationships of isolates will illuminate this possibility and reveal the extent to which strain divergence and ecological differentiation correlate.
Materials and Methods
Single-cell sorting of bacteria from A. mellifera guts
10 worker bees were collected from inside a single hive in West Haven, CT, USA. The midgut and the ileum (anterior part of the hindgut) were dissected with sterile forceps and homogenized with a pestle in 6% betaine in 1× PBS. The homogenate was pipetted into a fresh tube avoiding gut tissue debris and frozen at −80°C. Aliquots were shipped on dry ice to the Single Cell Genomics Center at the Bigelow laboratory, Maine, USA, for fluorescence-activated cell sorting (FACS), single-cell lysis, and multiple displacement amplification (MDA) following procedures described previously [75].
Genotyping of single cells
An initial qPCR screen for the 16S rRNA gene was performed with primers 27F (AGR GTT YGA TYM TGG CTC AG) and 907R (CCG TCA ATT CMT TTR AGT TT) on each single-cell sample in the 384-well plate. None of the negative control samples gave a positive PCR signal (Figure S2). Initially, amplicons from 94 SAGs were selected for Sanger sequencing with primer 907R. For phylogenetic analyses, we generated longer 16S rRNA gene PCR amplicons with primers 27F and 1507R (TAC CTT GTT ACG ACT TCA CCC CAG). Amplicons were Sanger-sequenced and assembled into near-full length 16S rRNA gene sequences. A total of 126 SAGs were genotyped by using the partial 16S rRNA sequences as queries in BLASTN against the NCBI non-redundant database and against the 16S rRNA gene sequences of F. perrara PEB0191 [29], S. alvi wkB2, and G. apicola wkB1 [27] (Table S1).
Single-cell genome sequencing, assembly, and annotation
Selected MDA products were sequenced on an Illumina HiSeq 2000 machine at the Yale Center for Genome Analysis. Illumina paired-end libraries with approximate insert sizes of 400 bp were constructed following Illumina standard protocols for genome sequencing using four PCR amplification cycles with the Bio HiFi polymerase (Kapa Biosystems, Woburn, MA, USA). These libraries were sequenced as part of a larger multiplexed pool in a single 2×76 bp lane. Sequencing reads were corrected with BayesHammer and first-pass assemblies generated with SPAdes using standard parameters [30], [76]. Illumina's multiplexing technology has a relatively high error rate (0.3%) for assigning reads to the correct library adapter sequence [31]. The higher the read coverage for a given region, the more reads of this region are being misassigned. Sequencing data obtained from single-cell derived MDA products typically reveal large variation in read coverage [76], [77], with some regions being covered by >10,000×. We determined that a substantial number of reads were misassigned and assembled into contigs of low coverage (mostly <10×), if the read coverage of a particular region in the original dataset exceeded 5,000× to 10,000×. To identify and remove such misassigned reads, we mapped every Illumina read dataset against assembled regions of other datasets exceeding a read coverage of 5000×. Reads were mapped with SOAP2 v2.21 [78] allowing for two mismatches per read. Reads that mapped with an average read coverage of ≤20× over the length of the read were removed from the dataset. Reads that mapped with an average read coverage of >20× were searched with BLASTN against the other datasets to avoid removing correctly assigned reads from highly conserved regions. Cleaned read datasets were again corrected with BayesHammer and assembled with SPAdes [30], [76]. The resulting assemblies were annotated with the IMG/MER system (Integrated Microbial Genomes and Metagenome Expert Review system) using the standard metagenome pipeline [79]. To remove sequences originating from potential DNA contamination during cell sorting or MDA reaction, or from spontaneous DNA synthesis, we excluded contigs fulfilling any of the following three criteria: (i) contig length <250 bp, (ii) contig length <500 bp, and read coverage <5× or no BLASTX hit to the reference genomes wkB1 and wkB2 (E-value cutoff of 10−5), (iii) contigs with no BLASTX hit to any bacterial sequence in the non-redundant database. We also removed contigs identical to larger contigs in the same assembly, because these redundant contigs typically present assembly artifacts due to the high read coverage of certain regions.
Ortholog analysis
Orthologous gene sets were determined with OrthoMCL [80], for S. alvi SAGs J21, O02, O11, P14 and the reference genomes wkB2 (CP007446), wkB12 (JFZW00000000), wkB29 (JFZV00000000), and for G. apicola SAGs B02, I20, P17 and reference genomes wkB1 (CP007445), wkB11 (JFON00000000), wkB30 (JFZX00000000). To this end, separate all-against-all BLASTP searches with the protein sequences of S. alvi genomes and G. apicola genomes were performed. We only considered BLASTP hits with ≥50% protein identity, covering >50% of both query and hit protein length. Based on these BLASTP hits, CDSs were clustered into sets of homologs using the MCL algorithm [80]. Ortholog clusters of SAGs and reference genomes from A. mellifera were extracted and visualized as Venn diagrams (Figure S4). Paralogs were identified within these clusters and the paralog copy with the highest similarity to the other sequences was retained in the cluster. CDSs not belonging to any homolog cluster were classified as remnants, if they had a partial BLASTP hit in any other genome of the same species (alignment length <50% over the length of the hit). They were classified as genome-specific genes, if they had no BLASTP hit in the other genomes of the same species (E-value cutoff of 10−5).
Phylogenetic analysis
16S rRNA sequences were aligned with ClustalW [81] and overhanging ends removed. Phylogenies were inferred with PhyML [82] as implemented in Geneious R6 (http://www.geneious.com/) using the GTR model with substitution rate categories set to four and all other parameters being estimated. Phylogenetic analyses of protein-encoding genes of S. alvi and G. apicola strains were conducted for genes having an ortholog in all outgroup species. These orthologs were identified with OrthoMCL comparing the reference genome of wkB2 (S. alvi) and wkB1 (G. apicola) and the complete genomes of six betaproteobacterial species and seven gammaproteobacterial species, respectively (see Figure 3A and 3B). We applied the same BLASTP hit cutoffs as before. A total of 114 and 211 genes for S. alvi and G. apicola, respectively, were found to have an ortholog in all ingroup and outgroup genomes. These genes were aligned on protein sequence level with MUSCLE [83] and back-translated into aligned DNA sequences with a custom-made Perl script. Single gene trees were inferred with Garli 2.0 [84] using the model of evolution predicted by jModelTest 2 for each gene [85]. To infer the multilocus sequence phylogenies, DNA alignments were concatenated and maximum likelihood phylogenies inferred with Garli 2.0. 100 non-parametric bootstrap trees were calculated for the concatenated alignments and the resulting supports for each split mapped with SumTrees [86] onto the maximum likelihood trees. To summarize the number of single gene trees supporting each split of the multilocus sequence phylogenies, we used the commands ‘Constraints’ and ‘Filter’ in PAUP 4.0 [87].
Analysis of sequence divergence
Nucleotide diversity (π) of 16S rRNA sequences within S. alvi and G. apicola was calculated with DNAsp v5 [88]. Pairwise sequence identity between 16S rRNA sequences of SAGs and reference genomes were obtained with ClustalW as implemented in Geneious R6. To estimate the average pairwise sequence divergence at synonymous sites between orthologs of sequenced SAGs and reference genomes, orthologs were aligned as described before. Pairwise sequence divergence was based on maximum likelihood estimation of the synonymous substitution frequency per site (dS) using the program codeml implemented in PAML 4.7 (runmode = −2, CodonFreq = 2) [89]. We obtained mean pairwise dS and dN/dS values between SAGs and reference genomes by running codeml on the concatenated alignments of all shared genes (226 genes for S. alvi and 348 genes for G. apicola, including genomes of Bombus strains). Ternary plot analyses were conducted on genes shared between all A. mellifera strains (239 genes for S. alvi and 400 genes for G. apicola), following previously published methods [90]–[92]. In short, relative levels of dS values between ortholog triplets of SAGs were calculated and plotted with R using the ‘triangle.plot’ function [93]. The spread of the data points was calculated by averaging the distances between normalized dS values of each ortholog to the mean normalized dS value.
Detection of recombination
The minimum number of recombination events in 16S rRNA gene alignments was calculated using the four-gamete test implemented in DNAsp v5 [88]. Sliding window analyses of nucleotide divergence over genomic regions were calculated with DNAsp v5 using the function ‘Polymorphism and Divergence’ with the Jukes-Cantor correction. For this analysis, genomic regions were aligned with ClustalW as implemented in Geneious R6 and stripped from all alignment gaps. To calculate the r/m ratios, two independent runs with the program ClonalFrame [94] were performed on orthologs shared between SAGs and reference genomes from A. mellifera. Each run consisted of 100,000 iterations, with a burn-in of 50,000 iterations. Parameters were recorded every 100th iteration. The r/m values were calculated from the output data of the two separate runs using two different methods. The first method considered all positions in the data, independent of the probability of a substitution at each site [95]. The second method only considered positions where the probability of a substitution by either mutation or recombination was ≥0.95 [90]. The program Geneconv was used to detect intragenic recombination events [96]. Different mismatch penalties (gscale = 0, 1, or 2) were used to identify recombination events of different ages. We only considered global inner (GI) fragments, i.e. sequences that result from recombination of other sequences in the alignment. We applied a Karlin-Altschul p-value cutoff of 0.05. The average fragment length for each pairwise comparison was calculated from all significant GI fragments.
Data deposition
The sequences of SAGs B02, J21, I20, O02, O11, P14, and P17 are deposited in Genbank under accession numbers JAIM00000000, AVQL00000000, JAIN00000000, JAIL00000000, JAIK00000000, JACG00000000, and JAIO00000000.
Supporting Information
Zdroje
1. MorganXC, SegataN, HuttenhowerC (2013) Biodiversity and functional genomics in the human microbiome. Trends Genet 29 : 51–58.
2. SommerF, BäckhedF (2013) The gut microbiota - masters of host development and physiology. Nat Rev Microbiol 11 : 227–238.
3. LeyRE, PetersonDA, GordonJI (2006) Ecological and evolutionary forces shaping microbial diversity in the human intestine. Cell 124 : 837–848.
4. CaporasoJG, LauberCL, WaltersWA, Berg-LyonsD, LozuponeCA, et al. (2011) Global patterns of 16S rRNA diversity at a depth of millions of sequences per sample. Proc Natl Acad Sci USA 108 (Suppl 1) 4516–4522.
5. AnderssonAF, LindbergM, JakobssonH, BäckhedF, NyrénP, et al. (2008) Comparative analysis of human gut microbiota by barcoded pyrosequencing. PLoS ONE 3: e2836.
6. ClaessonMJ, JefferyIB, CondeS, PowerSE, O'ConnorEM, et al. (2012) Gut microbiota composition correlates with diet and health in the elderly. Nature 488 : 178–184.
7. LeyRE, HamadyM, LozuponeC, TurnbaughPJ, RameyRR, et al. (2008) Evolution of mammals and their gut microbes. Science 320 : 1647–1651.
8. TurnbaughPJ, RidauraVK, FaithJJ, ReyFE, KnightR, et al. (2009) The effect of diet on the human gut microbiome: a metagenomic analysis in humanized gnotobiotic mice. Sci Transl Med 1 : 6ra14.
9. TurnbaughPJ, HamadyM, YatsunenkoT, CantarelBL, DuncanA, et al. (2009) A core gut microbiome in obese and lean twins. Nature 457 : 480–484.
10. MiraA, OchmanH (2002) Gene location and bacterial sequence divergence. Mol Biol Evol 19 : 1350–1358.
11. TouchonM, HoedeC, TenaillonO, BarbeV, BaeriswylS, et al. (2009) Organised genome dynamics in the Escherichia coli species results in highly diverse adaptive paths. PLoS genetics 5: e1000344.
12. TettelinH, MasignaniV, CieslewiczMJ, DonatiC, MediniD, et al. (2005) Genome analysis of multiple pathogenic isolates of Streptococcus agalactiae: Implications for the microbial “pan-genome.”. Proc Natl Acad Sci USA 102 : 13950–13955.
13. EngelP, MoranNA (2013) The gut microbiota of insects - diversity in structure and function. FEMS Microbiol Rev 37 : 699–735.
14. KochH, Schmid-HempelP (2011) Bacterial communities in central European bumblebees: low diversity and high specificity. Microb Ecol 62 : 121–133.
15. AhnJ-H, HongI-P, BokJ-I, KimB-Y, SongJ, et al. (2012) Pyrosequencing analysis of the bacterial communities in the guts of honey bees Apis cerana and Apis mellifera in Korea. J Microbiol 50 : 735–745.
16. MartinsonVG, DanforthBN, MinckleyRL, RueppellO, TingekS, et al. (2011) A simple and distinctive microbiota associated with honey bees and bumble bees. Mol Ecol 20 : 619–628.
17. MohrKI, TebbeCC (2006) Diversity and phylotype consistency of bacteria in the guts of three bee species (Apoidea) at an oilseed rape field. Environ Microbiol 8 : 258–272.
18. BabendreierD, JollerD, RomeisJ, BiglerF, WidmerF (2007) Bacterial community structures in honeybee intestines and their response to two insecticidal proteins. FEMS Microbiol Ecol 59 : 600–610.
19. JeyaprakashA, HoyMA, AllsoppMH (2003) Bacterial diversity in worker adults of Apis mellifera capensis and Apis mellifera scutellata (Insecta: Hymenoptera) assessed using 16S rRNA sequences. J Invertebr Pathol 84 : 96–103.
20. MoranNA, HansenAK, PowellJE, SabreeZL (2012) Distinctive gut microbiota of honey bees assessed using deep sampling from individual worker bees. PLoS ONE 7: e36393.
21. Cox-FosterDL, ConlanS, HolmesEC, PalaciosG, EvansJD, et al. (2007) A metagenomic survey of microbes in honey bee colony collapse disorder. Science 318 : 283–287.
22. EngelP, MartinsonVG, MoranNA (2012) Functional diversity within the simple gut microbiota of the honey bee. Proc Natl Acad Sci USA 109 : 11002–11007.
23. CariveauDP, PowellJE, KochH, WinfreeR, MoranNA (2014) Variation in gut microbial communities and its association with pathogen infection in wild bumble bees (Bombus). ISME J Epub ahead of print. doi:10.1038/ismej.2014.68
24. CameronSA, LozierJD, StrangeJP, KochJB, CordesN, et al. (2011) Patterns of widespread decline in North American bumble bees. Proc Natl Acad Sci USA 108 : 662–667.
25. vanEngelsdorpD, EvansJD, SaegermanC, MullinC, HaubrugeE, et al. (2009) Colony collapse disorder: a descriptive study. PLoS ONE 4: e6481.
26. BauerDM, WingIS (2010) Economic consequences of pollinator declines: a synthesis. Agr Resource Econ Rev 39 : 368–383.
27. KwongWK, MoranNA (2012) Cultivation and characterization of the gut symbionts of honey bees and bumble bees: Snodgrassella alvi gen. nov., sp. nov., a member of the Neisseriaceae family of the Betaproteobacteria; and Gilliamella apicola gen. nov., sp. nov., a member of Orbaceae fam. nov., Orbales ord. nov., a sister taxon to the Enterobacteriales order of the Gammaproteobacteria. Int J Syst Evol Microbiol 63 : 2008–2018.
28. KwongWK, EngelP, KochH, MoranNA (2014) Genomics and host specialization of honey bee and bumble bee gut symbionts. Proc Natl Acad Sci USA 111 : 11509–11514.
29. EngelP, KwongWK, MoranNA (2013) Frischella perrara gen. nov., sp. nov., a Gammaproteobacterium isolated from the gut of the honey bee, Apis mellifera. Int J Syst Evol Microbiol 63 : 3646–51.
30. BankevichA, NurkS, AntipovD, GurevichAA, DvorkinM, et al. (2012) SPAdes: a new genome assembly algorithm and its applications to single-cell sequencing. J Comput Biol 19 : 455–477.
31. KircherM, SawyerS, MeyerM (2012) Double indexing overcomes inaccuracies in multiplex sequencing on the Illumina platform. Nucleic Acids Res 40: e3.
32. WoykeT, XieG, CopelandA, GonzálezJM, HanC, et al. (2009) Assembling the marine metagenome, one cell at a time. PLoS ONE 4: e5299.
33. WoykeT, SczyrbaA, LeeJ, RinkeC, TigheD, et al. (2011) Decontamination of MDA reagents for single cell whole genome amplification. PLoS ONE 6: e26161.
34. DeitschKW, MoxonER, WellemsTE (1997) Shared themes of antigenic variation and virulence in bacterial, protozoal, and fungal infections. Microbiol Mol Biol Rev 61 : 281–293.
35. SwanBK, TupperB, SczyrbaA, LauroFM, Martinez-GarciaM, et al. (2013) Prevalent genome streamlining and latitudinal divergence of planktonic bacteria in the surface ocean. Proc Natl Acad Sci USA 110 : 11463–11468.
36. MuniesaM, BlanchAR, LucenaF, JofreJ (2005) Bacteriophages may bias outcome of bacterial enrichment cultures. Appl Environ Microbiol 71 : 4269–4275.
37. HarderW, DijkhuizenL (1982) Strategies of mixed substrate utilization in microorganisms. Philos Trans R Soc Lond, B, Biol Sci 297 : 459–480.
38. LloydKG, SchreiberL, PetersenDG, KjeldsenKU, LeverMA, et al. (2013) Predominant archaea in marine sediments degrade detrital proteins. Nature 496 : 215–218.
39. LangridgeGC, PhanM-D, TurnerDJ, PerkinsTT, PartsL, et al. (2009) Simultaneous assay of every Salmonella Typhi gene using one million transposon mutants. Genome Res 19 : 2308–2316.
40. MartinsonVG, MoyJ, MoranNA (2012) Establishment of characteristic gut bacteria during development of the honeybee worker. Appl Environ Microbiol 78 : 2830–2840.
41. StepanauskasR (2012) Single cell genomics: an individual look at microbes. Curr Opin Microbiol 15 : 613–620.
42. LaskenRS (2012) Genomic sequencing of uncultured microorganisms from single cells. Nat Rev Microbiol 10 : 631–640.
43. McLeanJS, LombardoM-J, BadgerJH, EdlundA, NovotnyM, et al. (2013) Candidate phylum TM6 genome recovered from a hospital sink biofilm provides genomic insights into this uncultivated phylum. Proc Natl Acad Sci USA 110: E2390–E2399.
44. Martinez-GarciaM, SwanBK, PoultonNJ, GomezML, MaslandD, et al. (2012) High-throughput single-cell sequencing identifies photoheterotrophs and chemoautotrophs in freshwater bacterioplankton. ISME J 6 : 113–123.
45. RinkeC, SchwientekP, SczyrbaA, IvanovaNN, AndersonIJ, et al. (2013) Insights into the phylogeny and coding potential of microbial dark matter. Nature 499 : 431–437.
46. WasmundK, SchreiberL, LloydKG, PetersenDG, SchrammA, et al. (2014) Genome sequencing of a single cell of the widely distributed marine subsurface Dehalococcoidia, phylum Chloroflexi. ISME J 8 : 383–397.
47. CampbellAG, CampbellJH, SchwientekP, WoykeT, SczyrbaA, et al. (2013) Multiple single-cell genomes provide insight into functions of uncultured Deltaproteobacteria in the human oral cavity. PLoS ONE 8: e59361.
48. IversonV, MorrisRM, FrazarCD, BerthiaumeCT, MoralesRL, et al. (2012) Untangling genomes from metagenomes: revealing an uncultured class of marine Euryarchaeota. Science 335 : 587–590.
49. MorowitzMJ, DenefVJ, CostelloEK, ThomasBC, PoroykoV, et al. (2011) Strain-resolved community genomic analysis of gut microbial colonization in a premature infant. Proc Natl Acad Sci USA 108 : 1128–1133.
50. SloanDB, BennettGM, EngelP, WilliamsD, OchmanH (2013) Disentangling Associated Genomes. Method Enzymol 531 : 445–464.
51. AlbertsenM, HugenholtzP, SkarshewskiA, NielsenKL, TysonGW, et al. (2013) Genome sequences of rare, uncultured bacteria obtained by differential coverage binning of multiple metagenomes. Nat Biotechnol 31 : 533–538.
52. WiedenbeckJ, CohanFM (2011) Origins of bacterial diversity through horizontal genetic transfer and adaptation to new ecological niches. FEMS Microbiol Rev 35 : 957–976.
53. KonstantinidisKT, RametteA, TiedjeJM (2006) The bacterial species definition in the genomic era. Philos Trans R Soc Lond B Biol Sci 361 : 1929–1940.
54. LawrenceJG, RetchlessAC (2009) The interplay of homologous recombination and horizontal gene transfer in bacterial speciation. Methods Mol Biol 532 : 29–53.
55. StackebrandtE, GoebelBM (1994) Taxonomic note: A place for DNA-DNA reassociation and 16S rRNA sequence analysis in the present species definition in bacteriology. Int J Syst Evol Microbiol 44 : 846–849.
56. WelchRA, BurlandV, PlunkettG, RedfordP, RoeschP, et al. (2002) Extensive mosaic structure revealed by the complete genome sequence of uropathogenic Escherichia coli. Proc Natl Acad Sci USA 99 : 17020–17024.
57. WhittamTS, BumbaughAC (2002) Inferences from whole-genome sequences of bacterial pathogens. Curr Opin Genet Dev 12 : 719–725.
58. OchmanH, ElwynS, MoranNA (1999) Calibrating bacterial evolution. Proc Natl Acad Sci USA 96 : 12638–12643.
59. BurneRA, ChenY-YM (2000) Bacterial ureases in infectious diseases. Microbes and Infection 2 : 533–542.
60. CohanFM (2001) Bacterial species and speciation. Syst Biol 50 : 513–524.
61. CornmanRS, TarpyDR, ChenY, JeffreysL, LopezD, et al. (2012) Pathogen webs in collapsing honey bee colonies. PLoS ONE 7: e43562.
62. KochH, Schmid-HempelP, JaenikeJ (2012) Gut microbiota instead of host genotype drive the specificity in the interaction of a natural host-parasite system. Ecol Lett 15 : 1095–1103.
63. CardinalS, StrakaJ, DanforthBN (2010) Comprehensive phylogeny of apid bees reveals the evolutionary origins and antiquity of cleptoparasitism. Proc Natl Acad Sci USA 107 : 16207–16211.
64. KochH, AbrolDP, LiJ, Schmid-HempelP (2013) Diversity and evolutionary patterns of bacterial gut associates of corbiculate bees. Mol Ecol 22 : 2028–2044.
65. ChastonJM, MurfinKE, Heath-HeckmanEA, Goodrich-BlairH (2013) Previously unrecognized stages of species-specific colonization in the mutualism between Xenorhabdus bacteria and Steinernema nematodes. Cell Microbiol 15 : 1545–1559.
66. FreseSA, BensonAK, TannockGW, LoachDM, KimJ, et al. (2011) The evolution of host specialization in the vertebrate gut symbiont Lactobacillus reuteri. PLoS genetics 7: e1001314.
67. OhPL, BensonAK, PetersonDA, PatilPB, MoriyamaEN, et al. (2010) Diversification of the gut symbiont Lactobacillus reuteri as a result of host-driven evolution. ISME J 4 : 377–387.
68. OchmanH, WorobeyM, KuoC-H, NdjangoJ-BN, PeetersM, et al. (2010) Evolutionary relationships of wild hominids recapitulated by gut microbial communities. PLoS Biol 8: e1000546.
69. EckburgPB, BikEM, BernsteinCN, PurdomE, DethlefsenL, et al. (2005) Diversity of the human intestinal microbial flora. Science 308 : 1635–1638.
70. FaithJJ, GurugeJL, CharbonneauM, SubramanianS, SeedorfH, et al. (2013) The long-term stability of the human gut microbiota. Science 341 : 1237439.
71. SchloissnigS, ArumugamM, SunagawaS, MitrevaM, TapJ, et al. (2013) Genomic variation landscape of the human gut microbiome. Nature 493 : 45–50.
72. ThomasCM, NielsenKM (2005) Mechanisms of, and barriers to, horizontal gene transfer between bacteria. Nat Rev Microbiol 3 : 711–721.
73. Cadillo-QuirozH, DidelotX, HeldNL, HerreraA, DarlingA, et al. (2012) Patterns of gene flow define species of thermophilic Archaea. PLoS Biol 10: e1001265.
74. ShapiroBJ, FriedmanJ, CorderoOX, PreheimSP, TimberlakeSC, et al. (2012) Population genomics of early events in the ecological differentiation of bacteria. Science 336 : 48–51.
75. SwanBK, Martinez-GarciaM, PrestonCM, SczyrbaA, WoykeT, et al. (2011) Potential for chemolithoautotrophy among ubiquitous bacteria lineages in the dark ocean. Science 333 : 1296–1300.
76. NikolenkoSI, KorobeynikovAI, AlekseyevMA (2013) BayesHammer: Bayesian clustering for error correction in single-cell sequencing. BMC Genomics 14 (Suppl 1) S7.
77. ChitsazH, Yee-GreenbaumJL, TeslerG, LombardoM-J, DupontCL, et al. (2011) Efficient de novo assembly of single-cell bacterial genomes from short-read data sets. Nat Biotechnol 29 : 915–921.
78. LiR, YuC, LiY, LamT-W, YiuS-M, et al. (2009) SOAP2: an improved ultrafast tool for short read alignment. Bioinformatics 25 : 1966–1967.
79. MarkowitzVM, IvanovaNN, SzetoE, PalaniappanK, ChuK, et al. (2007) IMG/M: a data management and analysis system for metagenomes. Nucleic Acids Res 36: D534–D538.
80. LiL, StoeckertCJ, RoosDS (2003) OrthoMCL: identification of ortholog groups for eukaryotic genomes. Genome Res 13 : 2178–2189.
81. LarkinMA, BlackshieldsG, BrownNP, ChennaR, McGettiganPA, et al. (2007) Clustal W and Clustal X version 2.0. Bioinformatics 23 : 2947–2948.
82. GuindonS, DufayardJ-F, LefortV, AnisimovaM, HordijkW, et al. (2010) New algorithms and methods to estimate maximum-likelihood phylogenies: assessing the performance of PhyML 3.0. Syst Biol 59 : 307–321.
83. EdgarRC (2004) MUSCLE: multiple sequence alignment with high accuracy and high throughput. Nucleic Acids Res 32 : 1792–1797.
84. Zwickl DJ (2006) Genetic algorithm approaches for the phylogenetic analysis of large biological sequence datasets under the maximum likelihood criterion. Ph.D. dissertation, The University of Texas at Austin.
85. DarribaD, TaboadaGL, DoalloR, PosadaD (2012) jModelTest 2: more models, new heuristics and parallel computing. Nat Methods 9 : 772.
86. SukumaranJ, HolderMT (2010) DendroPy: a Python library for phylogenetic computing. Bioinformatics 26 : 1569–1571.
87. Swofford DL (2003) PAUP*: phylogenetic analysis using parsimony (*and Other Methods). Version 4. Sinauer Associates, Sunderland, Massachusetts.
88. LibradoP, RozasJ (2009) DnaSP v5: a software for comprehensive analysis of DNA polymorphism data. Bioinformatics 25 : 1451–1452.
89. YangZ (2007) PAML 4: phylogenetic analysis by maximum likelihood. Mol Biol Evol 24 : 1586–1591.
90. EllegaardKM, KlassonL, NäslundK, BourtzisK, AnderssonSGE (2013) Comparative genomics of Wolbachia and the bacterial species concept. PLoS genetics 9: e1003381.
91. GuyL, NystedtB, SunY, NäslundK, BerglundEC, et al. (2012) A genome-wide study of recombination rate variation in Bartonella henselae. BMC Evol Biol 12 : 65.
92. KlassonL, WestbergJ, SapountzisP, NäslundK, LutnaesY, et al. (2009) The mosaic genome structure of the Wolbachia wRi strain infecting Drosophila simulans. Proc Natl Acad Sci USA 106 : 5725–5730.
93. DrayS, DufourAB (2007) The ade4 package: implementing the duality diagram for ecologists. J Stat Softw 22 : 1–20.
94. DidelotX, FalushD (2007) Inference of bacterial microevolution using multilocus sequence data. Genetics 175 : 1251–1266.
95. DidelotX, BowdenR, StreetT, GolubchikT, SpencerC, et al. (2011) Recombination and population structure in Salmonella enterica. PLoS genetics 7: e1002191.
96. Sawyer SA (1999) GENECONV: a computer package for the statistical detection of gene conversion. Distributed by the author, Department of Mathematics, Washington University. Available: http://www.math.wustl.edu/~sawyer.
97. GilR, SilvaFJ, PeretóJ, MoyaA (2004) Determination of the core of a minimal bacterial gene set. Microbiol Mol Biol Rev 68 : 518–37.
Štítky
Genetika Reprodukční medicínaČlánek vyšel v časopise
PLOS Genetics
2014 Číslo 9
Nejčtenější v tomto čísle
- Admixture in Latin America: Geographic Structure, Phenotypic Diversity and Self-Perception of Ancestry Based on 7,342 Individuals
- Nipbl and Mediator Cooperatively Regulate Gene Expression to Control Limb Development
- Genome Wide Association Studies Using a New Nonparametric Model Reveal the Genetic Architecture of 17 Agronomic Traits in an Enlarged Maize Association Panel
- Histone Methyltransferase MMSET/NSD2 Alters EZH2 Binding and Reprograms the Myeloma Epigenome through Global and Focal Changes in H3K36 and H3K27 Methylation