
The Causal Effect of Vitamin D Binding Protein (DBP) Levels on Calcemic and Cardiometabolic Diseases: A Mendelian Randomization Study
Background:
Observational studies have shown that vitamin D binding protein (DBP) levels, a key determinant of 25-hydroxy-vitamin D (25OHD) levels, and 25OHD levels themselves both associate with risk of disease. If 25OHD levels have a causal influence on disease, and DBP lies in this causal pathway, then DBP levels should likewise be causally associated with disease. We undertook a Mendelian randomization study to determine whether DBP levels have causal effects on common calcemic and cardiometabolic disease.
Methods and Findings:
We measured DBP and 25OHD levels in 2,254 individuals, followed for up to 10 y, in the Canadian Multicentre Osteoporosis Study (CaMos). Using the single nucleotide polymorphism rs2282679 as an instrumental variable, we applied Mendelian randomization methods to determine the causal effect of DBP on calcemic (osteoporosis and hyperparathyroidism) and cardiometabolic diseases (hypertension, type 2 diabetes, coronary artery disease, and stroke) and related traits, first in CaMos and then in large-scale genome-wide association study consortia. The effect allele was associated with an age - and sex-adjusted decrease in DBP level of 27.4 mg/l (95% CI 24.7, 30.0; n = 2,254). DBP had a strong observational and causal association with 25OHD levels (p = 3.2×10⁻¹⁹). While DBP levels were observationally associated with calcium and body mass index (BMI), these associations were not supported by causal analyses. Despite well-powered sample sizes from consortia, there were no associations of rs2282679 with any other traits and diseases: fasting glucose (0.00 mmol/l [95% CI −0.01, 0.01]; p = 1.00; n = 46,186); fasting insulin (0.01 pmol/l [95% CI −0.00, 0.01,]; p = 0.22; n = 46,186); BMI (0.00 kg/m2 [95% CI −0.01, 0.01]; p = 0.80; n = 127,587); bone mineral density (0.01 g/cm2 [95% CI −0.01, 0.03]; p = 0.36; n = 32,961); mean arterial pressure (−0.06 mm Hg [95% CI −0.19, 0.07]); p = 0.36; n = 28,775); ischemic stroke (odds ratio [OR] = 1.00 [95% CI 0.97, 1.04]; p = 0.92; n = 12,389/62,004 cases/controls); coronary artery disease (OR = 1.02 [95% CI 0.99, 1.05]; p = 0.31; n = 22,233/64,762); or type 2 diabetes (OR = 1.01 [95% CI 0.97, 1.05]; p = 0.76; n = 9,580/53,810).
Conclusions:
DBP has no demonstrable causal effect on any of the diseases or traits investigated here, except 25OHD levels. It remains to be determined whether 25OHD has a causal effect on these outcomes independent of DBP.
Please see later in the article for the Editors' Summary
Published in the journal:
. PLoS Med 11(10): e32767. doi:10.1371/journal.pmed.1001751
Category:
Research Article
doi:
https://doi.org/10.1371/journal.pmed.1001751
Summary
Background:
Observational studies have shown that vitamin D binding protein (DBP) levels, a key determinant of 25-hydroxy-vitamin D (25OHD) levels, and 25OHD levels themselves both associate with risk of disease. If 25OHD levels have a causal influence on disease, and DBP lies in this causal pathway, then DBP levels should likewise be causally associated with disease. We undertook a Mendelian randomization study to determine whether DBP levels have causal effects on common calcemic and cardiometabolic disease.
Methods and Findings:
We measured DBP and 25OHD levels in 2,254 individuals, followed for up to 10 y, in the Canadian Multicentre Osteoporosis Study (CaMos). Using the single nucleotide polymorphism rs2282679 as an instrumental variable, we applied Mendelian randomization methods to determine the causal effect of DBP on calcemic (osteoporosis and hyperparathyroidism) and cardiometabolic diseases (hypertension, type 2 diabetes, coronary artery disease, and stroke) and related traits, first in CaMos and then in large-scale genome-wide association study consortia. The effect allele was associated with an age - and sex-adjusted decrease in DBP level of 27.4 mg/l (95% CI 24.7, 30.0; n = 2,254). DBP had a strong observational and causal association with 25OHD levels (p = 3.2×10⁻¹⁹). While DBP levels were observationally associated with calcium and body mass index (BMI), these associations were not supported by causal analyses. Despite well-powered sample sizes from consortia, there were no associations of rs2282679 with any other traits and diseases: fasting glucose (0.00 mmol/l [95% CI −0.01, 0.01]; p = 1.00; n = 46,186); fasting insulin (0.01 pmol/l [95% CI −0.00, 0.01,]; p = 0.22; n = 46,186); BMI (0.00 kg/m2 [95% CI −0.01, 0.01]; p = 0.80; n = 127,587); bone mineral density (0.01 g/cm2 [95% CI −0.01, 0.03]; p = 0.36; n = 32,961); mean arterial pressure (−0.06 mm Hg [95% CI −0.19, 0.07]); p = 0.36; n = 28,775); ischemic stroke (odds ratio [OR] = 1.00 [95% CI 0.97, 1.04]; p = 0.92; n = 12,389/62,004 cases/controls); coronary artery disease (OR = 1.02 [95% CI 0.99, 1.05]; p = 0.31; n = 22,233/64,762); or type 2 diabetes (OR = 1.01 [95% CI 0.97, 1.05]; p = 0.76; n = 9,580/53,810).
Conclusions:
DBP has no demonstrable causal effect on any of the diseases or traits investigated here, except 25OHD levels. It remains to be determined whether 25OHD has a causal effect on these outcomes independent of DBP.
Please see later in the article for the Editors' Summary
Introduction
Serum vitamin D levels are generally low in populations worldwide [1],[2]. Observational studies have implicated vitamin-D-deficient states in several common diseases and related traits, including cardiovascular disease [3]–[5], type 2 diabetes [6],[7], breast cancer [8], bladder cancer [9], colorectal cancer [10], chronic lung diseases such as asthma, bronchiectasis, and other lung infections [11]–[14]. Vitamin D may have modulatory effects on the immune system and thus a potential effect on rheumatologic, inflammatory, and autoimmune diseases [15],[16], such as type 1 diabetes, inflammatory bowel disease [17], familial Mediterranean fever [18], multiple sclerosis [19], and chronic pain [20],[21].
Although observational studies have shown associations between vitamin D deficiency (defined as serum 25-hydroxy-vitamin D [25OHD] level <50 nmol/l) and a number of common diseases, it is not known whether these relationships are causal. Similarly, while animal studies have provided some mechanistic clues into possible causal pathways, mechanisms underlying the associations between circulating 25OHD concentrations and different diseases remain unclear. One key determinant of 25OHD levels is vitamin D binding protein (DBP), a group-specific component of serum globulin [22]. DBP acts as the principal protein carrier for serum 25OHD and activated vitamin D, and thus functions as a reservoir for vitamin D metabolites [23]. Approximately 85%–90% of 25OHD is transported from the liver to target organs bound to DBP [24]. DBP also affects the clearance of vitamin D metabolites in part by aiding in the reabsorption of filtered vitamin D metabolites through megalin in the kidney [25].
DBP is encoded by GC, which is located on Chromosome 4q13. Genetic association testing of a single nucleotide polymorphism (SNP) at GC, rs2282679, in the TwinsUK cohort (n = 1,674) showed that this genetic variant was strongly associated with DBP concentrations (p = 4.0×10−42) [26]. The Study of Underlying Genetic Determinants of Vitamin D and Highly Related Traits (SUNLIGHT), a large, multicenter genome-wide association study (GWAS), demonstrated that rs2282679 was also strongly associated with reduced 25OHD concentrations (p = 1.9×10−109) [26]. Each copy of the effect allele, C, at rs2282579, lowered 25OHD levels by an amount similar to that associated with daily vitamin D supplementation [26]. Other genetic studies have also shown robust associations between GC genetic variants and circulating 25OHD concentrations [26]–[29].
If vitamin D has a causal impact on common diseases and DBP levels are a main determinant of 25OHD levels, DBP may lie in the causal pathway between 25OHD and these conditions. Indeed, DBP may have additional metabolic roles beyond vitamin D transport. For example, it may modulate bone development, innate immunity, and inflammatory responses [30]–[32]. DBP has also been purportedly linked with autoimmune and inflammatory diseases, aspirin resistance (i.e., failure of aspirin to inhibit platelet function) [33], various arthritides [34], and cardiometabolic outcomes [35]–[37]. Polymorphisms in the GC gene [38] have been associated with oral glucose tolerance, fasting insulin levels [39], fracture risk [40], and breast cancer [41]. Thus, observational evidence showing that differences in serum DBP levels are associated with common diseases supports the hypothesis that DBP may either be an intermediate in the biological pathway or an upstream determinant influencing 25OHD effects on common diseases. By way of analogy, it has been suggested that other transporters of steroidal hormones, including sex hormone binding globulin and corticosteroid binding globulin, are major effectors of steroid action independent of their function as carriers [42].
We therefore examined whether DBP levels might be associated with common diseases, potentially clarifying some of the mechanisms underpinning the possible clinical effects of 25OHD. Mendelian randomization (MR) is a method used to provide evidence for causal associations between a potentially modifiable risk factor (e.g., DBP) and common diseases when a randomized clinical trial is not possible [43]. The MR paradigm relies on the random assortment of genetic variants at conception to provide an un-confounded study design to estimate the causal effects of an intermediate phenotype on an outcome measure of interest (i.e., disease and related phenotypic traits) undistorted by reverse causation [43]. Findings from such an analysis can strengthen causal inferences from observational studies and could therefore clarify whether DBP is in the causal pathway between 25OHD levels and disease.
Here, we first evaluated the causal impact of DBP levels on (1) serum 25OHD concentrations, (2) 25OHD biological readouts, such as parathyroid hormone (PTH) levels, and (3) common cardiometabolic diseases that have been related to vitamin D physiology and their associated traits, through a MR analysis comprising two stages. In the first stage, we determined the effect of DBP levels on these diseases and traits in a large, multicenter cohort. In the second stage, we sought replication of findings in large-scale international GWAS consortia, to achieve a maximal sample size and precise effect estimates. We tested whether these causal estimates from MR analyses were consistent with findings from observational analyses.
Methods
Study Populations
The Canadian Multicentre Osteoporosis Study (CaMos) population was used to describe the relationship between rs2282679, 25OHD, and DBP levels, and to produce instrumental variable (IV) results on the causal effect of DBP levels on diseases and related traits. CaMos is an ongoing population-based prospective cohort study of 9,423 randomly selected community-dwelling women (n = 6,539) and men (n = 2,884) aged ≥25 y at baseline (1995–1997) residing in Canada [44]. Interviews and measurements were repeated at 5 and 10 y after enrollment; participant retention remained at 67% at the tenth year. A similar approach was used to enroll a youth cohort of individuals aged 16–24 y at recruitment (2004–2006). Ethics approval for the study was obtained from the ethics review board at each institution involved in the study, and all participants gave written informed consent in accordance with the Helsinki declaration. The current study sample included 2,254 participants ≥16 y of age for whom genotyping for SNP rs2282679 was obtained (adult cohort, n = 2,122; youth cohort, n = 132).
The large-scale GWAS international consortia used to replicate CaMos findings of the influence of rs2282679 on traits and disease were the following: (1) METASTROKE, a collaborative meta-analysis of ischemic stroke GWAS data comprising 15 cohorts (12,389 cases/62,004 controls) of European ancestry from the International Stroke Genetics Consortium (ISGC) [45]; (2) the Genetic Factors for Osteoporosis Consortium (GEFOS), which meta-analyzed genetic data and bone mineral density (BMD) measurements from 17 GWASs comprising 32,961 individuals of European and East Asian ancestry [46]; (3) the Diabetes Genetics Replication and Meta-analysis (DIAGRAM) Consortium, which combined samples from 9,580 cases of type 2 diabetes and 53,810 controls of European ancestry [47]; (4) the International Consortium for Blood Pressure (ICBP), which meta-analyzed genetic data on blood pressure indices from 28,775 individuals of European descent [48]; (5) the Meta-analyses of Glucose and Insulin-Related Traits Consortium (MAGIC), which meta-analyzed 21 GWASs comprising up to 46,186 non-diabetic individuals to identify genetic loci that impact glycemic and metabolic traits [49]; (6) the Genetic Investigation of Anthropometric Traits (GIANT) Consortium, which meta-analyzed data from ∼170,000 participants to identify genetic loci associated with body mass index (BMI) and other anthropometric traits [50]; (7) the Coronary Artery Disease Genome Wide Replication and Meta-analysis (CARDIoGRAM), a meta-analysis of 14 GWASs of individuals of European descent for coronary artery disease [51]; and (8) SUNLIGHT, a meta-analysis GWAS of 33,996 individuals from 15 cohorts in Europe and North America [26].
CaMos Data Collection
Data collection at baseline employed an extensive interviewer-administered questionnaire that included socio-demographic information, medical and family history, general health, medication and supplement use, and food intake. “Ethnicity” was determined by self-report; indication of an ethnicity other than “white” or “European” was considered “non-European.” Disease status was ascertained with the following survey question: “Have you ever been told by a doctor that you have any of the following conditions: hypertension, insulin-dependent or non-insulin-dependent diabetes, heart attack, osteoporosis, stroke, or transient ischemic attack, among other health conditions?” Participants were considered a positive case if they had ever responded “yes” during one of the interviews conducted in year 0, 5, or 10. We investigated cardiometabolic and calcium-related common diseases with a prevalence of at least 5% (n>100) in the study population.
Clinical Assessments
Clinical assessments included height and weight measurements to calculate BMI using the following formula: weight (in kilograms)/height (in meters)2. BMD was measured at the femoral neck using a DXA Hologic QDR 1000, 2000, or 4500 bone densitometer (Hologic, Marlborough, Masschusetts, US) or a Lunar DPX bone densitometer (Lunar, Piscataway, New Jersey, US). BMD at the femoral neck was chosen as the standard osteoporosis-related outcome as it is not confounded by non-osteoporotic degenerative changes. Lunar data were converted into equivalent Hologic values by standard methods [52],[53]. A detailed description of BMD quality control appears elsewhere [54].
Laboratory Measurements
An automated immunoturbidimetric assay (Dako, Glostrup, Denmark) was used to measure serum DBP concentration. The assay was configured for the Roche Modular P System (Roche Diagnostics, Laval, Quebec, Canada). The assay was linear within the calibration range (28 to 544 mg/l), and the measurable range could be expanded with sample dilution. The imprecision of the DBP mass assay was 2.2% at 275 mg/l (Dako Low QC) and 1.4% at 365 mg/l (in-house quality control). Comparison with an established binding capacity assay showed close correlation (r = 0.86, p<0.0001). Serum total 25OHD and PTH were measured using the Liaison (DiaSorin, Stillwater, Minnesota, US) autoimmunoanalyzer, using chemiluminescent immunoassay technology. Details of the assay were described previously [55]. Estimated glomerular filtration rate was calculated using the Chronic Kidney Disease Epidemiology Collaboration formula [56].
Genotyping
Genotyping was performed using the Applied Biosystems (ABI) TaqMan protocol. The SNP rs2282679 had a minor allele frequency of 0.288, with no evidence for deviation from Hardy–Weinberg equilibrium (p = 0.89). Three other 25OHD-level-associated SNPs previously implicated in GWASs [26], rs12785878 (11q12 near DHCR7), rs10741657 (11p15 near CYP2R1), and rs6013897 (20q13 near CYP24A1), were also genotyped.
Linear Regression of SNP and DBP Level
All statistical analyses were undertaken using the STATA software package (version 11, StataCorp, College Station, Texas, US). Descriptive statistics of DBP, relevant covariates, and outcomes were assessed. We visually inspected for normality in the distribution of DBP levels in our study population and excluded extreme outliers (>600 mg/l; ∼3.5 standard deviations [SD] from the mean). Further data transformation was not required. A univariable linear regression model was used to assess the association of SNP rs2282679 (coded as 0, 1, and 2, as the count of the C allele) with DBP level (response variable). Results were then adjusted using a multivariate model that included socio-demographic characteristics: age, sex, and ethnicity (European or non-European ancestry).
Observational Regression Analysis of DBP Level and Clinical Phenotypes
To explore the effect of DBP on phenotypes (common diseases and related traits), we first visually inspected for normality in the distribution of all continuous variables and excluded any extreme outliers (∼3.5 SD from the mean; <1% of all data points). Logarithmic transformation was performed for PTH and fasting insulin. The native distribution was used for 25OHD, calcium, BMI, and BMD. We then generated linear regression models for continuous outcomes (e.g., BMI) and logistic regression models for binary outcomes, adjusted for age and sex. Effect estimates were presented per 1-SD (50 mg/l) increase in DBP. Missing data points were assumed to be missing at random; thus, complete case analyses were performed. We used the adult and youth cohorts to determine the associative effect of DBP on clinical and laboratory-measured traits, i.e., circulating 25OHD, PTH, calcium, fasting glucose and fasting insulin levels, and BMI. As the youth cohort had low risk for the common diseases in question (i.e., myocardial infarction, diabetes, hypertension, and cerebrovascular accidents), we explored the effect of DBP on diseases only in the adult cohort.
Multiple Variable Regression of SNP and Phenotypes
We then examined the association of SNP rs2282679 with the phenotypes (common diseases and related traits) using linear regression for continuous variables and logistic regression for binary variables, adjusting for age and sex. The null hypothesis was tested using α = 0.05. The Bonferroni method was used to maintain family-wise error rate when performing multiple testing through enforcing a more stringent α for declaring statistical significance for each comparison (0.05/12 = 0.004 for 12 comparisons). Conservatively, independence between outcomes was assumed for this correction.
Instrumental Variable Analysis of DBP and Clinical Phenotypes
We used the SNP as an IV to estimate the causal effect of DBP on the same outcome measures. For continuous outcomes we used the two-stage least-squares estimator method that regressed each outcome against predicted values of DBP level per genotype using the command “ivreg2” in the STATA software package. The Durbin-Wu-Hausman chi-square test [57], a test for endogeneity in a regression estimated via IVs, was computed using the command “ivendog,” where the null hypothesis states that an ordinary least-squares estimator of the same equation would yield consistent estimates. For dichotomous outcomes (e.g., myocardial infarction), we conducted a two-stage IV analysis. The first stage was a linear regression of the intermediate phenotype (DBP) on the categorical instrument (SNP) to generate DBP fitted values. The second stage was a logistic regression of the clinical outcome on predicted values of the intermediate phenotype, adjusted for age, sex, and the estimated residuals that may be correlated with unmeasured confounders. IV analysis for dichotomous outcomes has been described previously [58].
Single SNP Look-Ups in GWAS International Consortia
We sought replication of the associations of rs2282679 with these phenotypes in publically available GWAS meta-analysis data from large international consortia that provided single SNP look-up results. Results for this SNP were provided for the following phenotypes: BMI from GIANT [50], BMD from GEFOS [46], type 2 diabetes from DIAGRAM [47], blood pressure measurements from ICBP [48], ischemic stroke from METASTROKE/ISGC [45], and fasting insulin and fasting glucose from MAGIC [49]. Using this SNP (instrument) as the proxy measure in genetic association analysis, these large consortia provided at least 90% power to detect direct associations between rs2282679 (proxy exposure) and continuous outcome variables given a 2% change in the mean of the outcome variable per 1-SD change in DBP with type 1 error rate = 0.004 [59]. Power estimations are shown in Tables S1 and S2.
Association Analysis of Three Other Vitamin-D-Associated SNPs with Phenotypes
We used univariable linear regression models to determine the association of three other vitamin-D-associated SNPs, rs12785878, rs10741657, and rs6013897, with 25OHD level, and evaluated the association of all four SNPs, including rs2282679, with 25OHD level in a multivariate regression model adjusting for age, sex, ethnicity, and season of blood draw. We then performed single SNP look-ups for these three additional genetic variants in the GWAS meta-analysis data for the same traits and diseases that were tested in CaMos.
Results
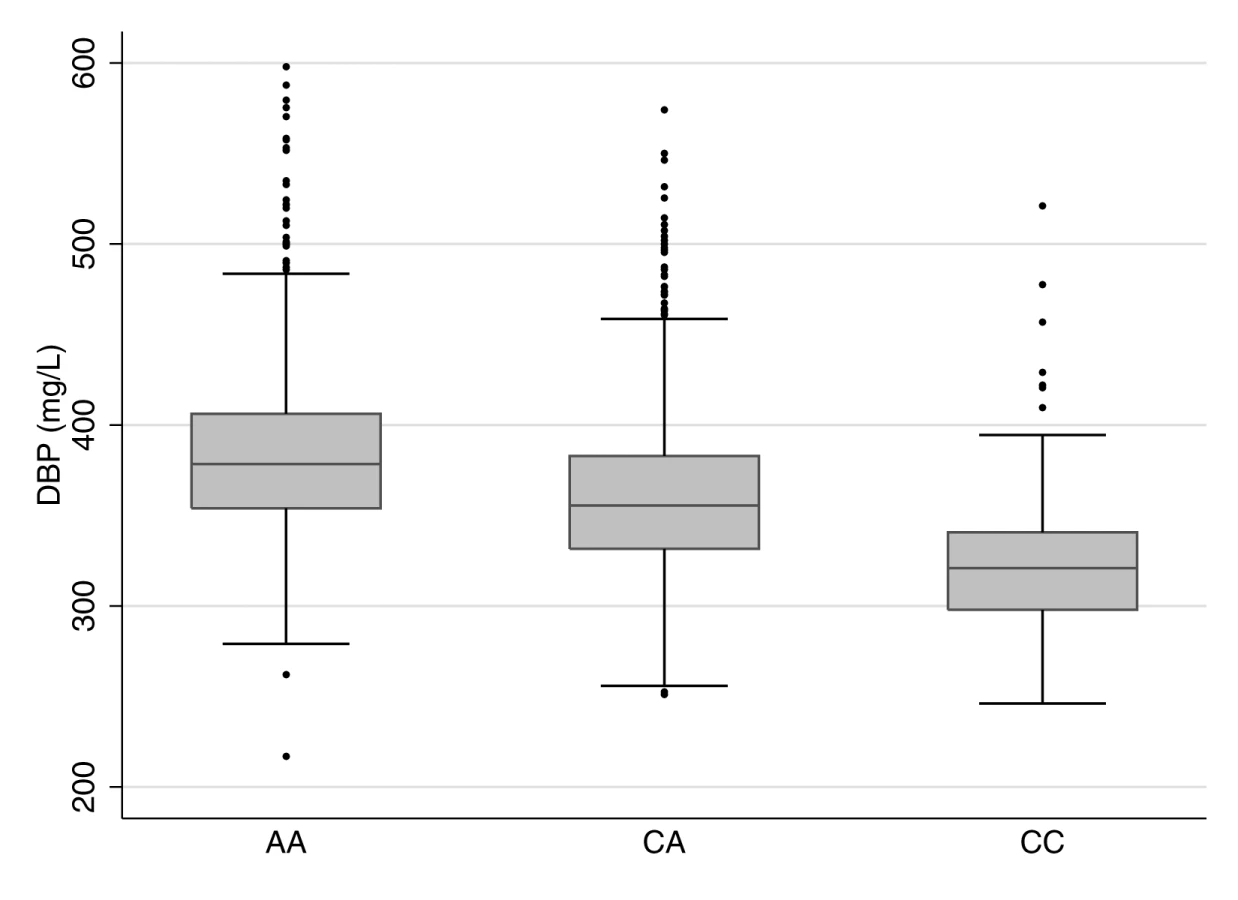
We tested the relationships between rs2282679, DBP, and 25OHD in 2,254 CaMos participants; 69.5% were women, and 79.5% were of European descent. The mean age was 65.7 (SD 15.4) y, and mean BMI was 27.5 (SD 5.4) kg/m2 at the time of clinical assessment. The C allele at rs2282679 had a population frequency of 0.288; genotype frequencies were 0.514 (AA), 0.396 (AC), and 0.090 (CC) (Table 1). We refer to the C allele as the effect allele. Individuals carrying the effect allele had lower DBP levels than those with the more common allele (AA: 384.6 mg/l [SD 48.3], n = 1,159; CA: 360.7 mg/l [SD 45.9], n = 893; CC: 322.9 mg/l [SD 39.1], n = 202). The effect allele showed an inverse linear relationship with DBP level (Figure 1). Univariable linear regression demonstrated a strong relationship between rs2282276 and DBP level (each copy of the effect allele, C, was associated with a decrease of 27.6 [95% CI 24.8, 30.4] mg/l in DBP levels, p = 3.3×10−76). The rs2282679 SNP explained 14.1% of the variance in DBP level (coefficient of determination, r2 = 0.141, F-statistic = 368.7). Adjusted for age, sex, and ethnicity, the effect size of this SNP on DBP was similar (−27.4 [95% CI −30.0, −24.7] mg/l); the variance explained was 25%, while the F-statistic was 188.7.

While DBP level was associated with age, sex, and ethnicity (Table 2), rs2282679 was not associated with age, sex, ethnicity, or any of the following potential confounders: education beyond high school, sunlight exposure, and smoking status (Table S3). Thus, rs2282679 remained a suitable genetic instrument for DBP level in MR analyses. The association for rs2282679 remained robust (−26.5 [95% CI −29.2, −23.8] mg/l) after additionally adjusting for other potential confounders (i.e., season of blood draw, education beyond high school, sunlight exposure in the last year, and smoking status) (Table S4). This SNP also explained 1.5% of the variance in 25OHD level (F-statistic = 34.6).

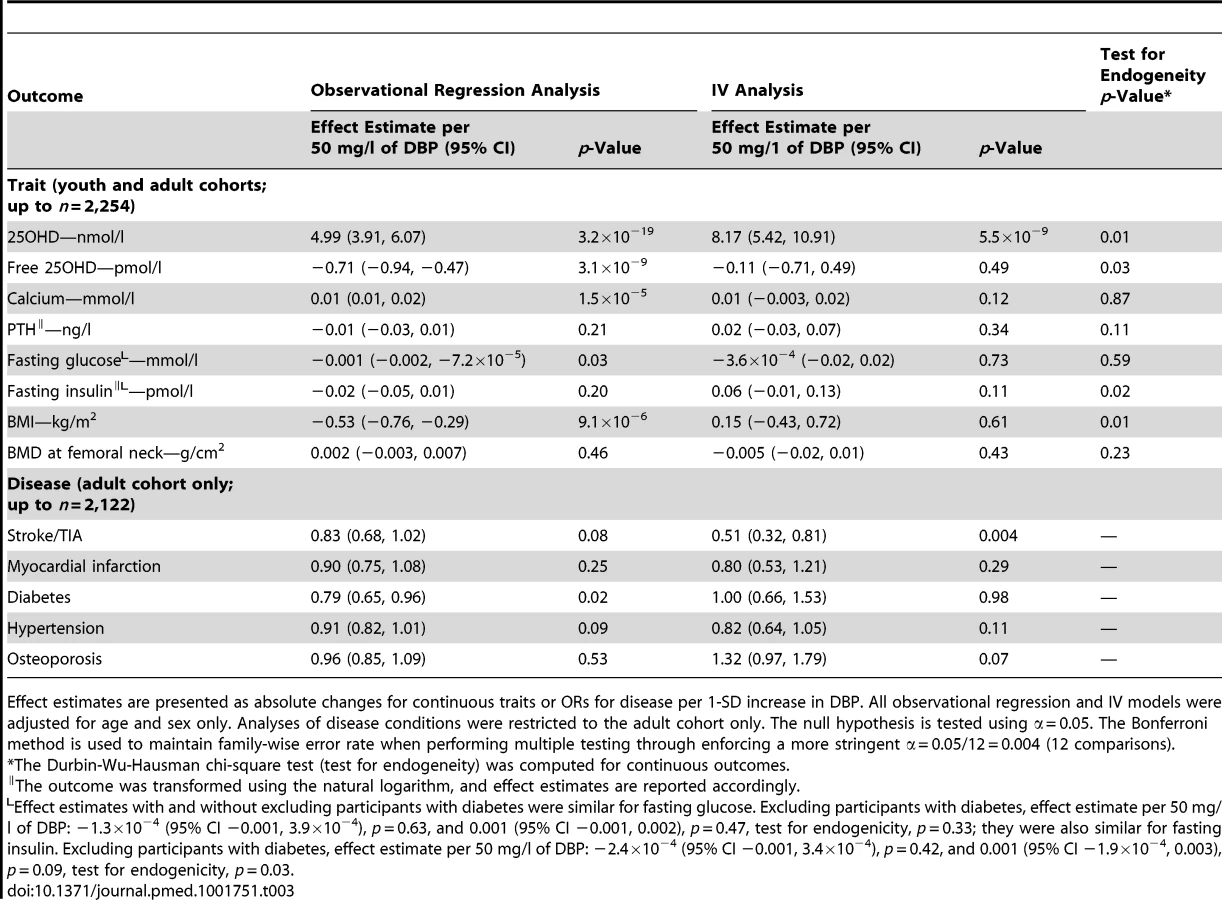
There was no evidence of non-linearity in the relationship between DBP concentration and 25OHD concentration (Figure S1). Observational analysis demonstrated DBP levels to be strongly associated (p≤0.004) with changes in 25OHD levels (5.0 [95% CI 3.9, 6.1] nmol/l per 1-SD increase in DBP), calcium levels (0.01 [95% CI 0.01, 0.02] mmol/l per 1-SD increase in DBP), and BMI (−0.5 [95% CI −0.7, −0.3] kg/m2 per 1-SD increase in DBP) (Table 3). Weak evidence for association (p≤0.1) was observed between DBP and fasting glucose (−0.001 [95% CI −0.002, −7.2×10⁻⁵] mmol/l per 1-SD increase in DBP), diabetes (odds ratio [OR] 0.79 [95% CI 0.66, 0.95]), hypertension (OR 0.91 [95% CI 0.82, 1.01]), and stroke/transient ischemic attack (TIA) (OR 0.83 [95% CI 0.68, 1.02]). No association was found with the other phenotypes tested, i.e., fasting insulin, PTH, BMD, osteoporosis, and myocardial infarction (p>0.1).
Mendelian Randomization Analyses in the CaMos Cohort
Using the SNP for MR analyses, DBP levels were shown to have a causal effect on only 25OHD levels (8.2 [95% CI 5.2, 10.9] nmol/l per 1-SD increase in DBP). The other observational associations described above did not persist in the IV analysis, suggesting that associations from the observational regression analyses were non-causal. Assessment for endogeneity indicated that IV testing was particularly meaningful for estimating effects of DBP on 25OHD level (p = 0.01), BMI (p = 0.01), and insulin level (p = 0.02). A suggestive causal association between DBP level and stroke/TIA was found, but this association did not survive multiple-testing correction (OR 0.51 [0.32, 0.81], p = 0.004).
In a subgroup analysis, we explored the relationship between DBP and traits using the same IV analysis restricted to CaMos participants with 25OHD levels <50 nmol/l (n = 498). In this subgroup, we found that a similar genotype–phenotype relationship was preserved (−27.0 [95% CI −32.4, −21.6] mg/l change in DBP for each copy of the effect allele, C, at rs2282679; p = 4.8×10⁻²¹; r2 = 0.16, F-statistic = 97.2). Among all the traits tested, higher DBP level was found to be associated only with lower calculated free 25OHD level (−1.1 [95% CI −1.3, −0.9] pmol/l for every 1-SD increase in DBP) in the observational regression analysis; this relationship persisted in the IV analysis (−1.7 [95% CI −2.2, −1.2] pmol/l per 1-SD increase in DBP) and genetic association analysis (0.9 [95% CI 0.6, 1.2] pmol/l per copy of the effect allele).
Single SNP Look-Up from Large-Scale GWAS International Consortia
In order to provide more precise effect estimates in MR analyses for any particular disease or trait, we replicated our findings of no association between rs2282679 and common diseases and traits using data from the large-scale international GWAS consortia outlined in Table 4. Each of these consortia had adequate power to test our findings at smaller effect sizes.

SNP rs2282679 was found to be strongly associated with 25OHD level in SUNLIGHT (n = 33,996, p = 1.9×10−109). However, there was no association between this SNP and other common diseases and traits tested, and, importantly, the confidence intervals for each association were tightly centered at the null. Thus, our findings suggest a lack of causal effect of DBP level on these traits and diseases.
Association of Three Other Vitamin-D-Associated SNPs with Phenotypes
In CaMos, although rs2282679 demonstrated the strongest association with 25OHD across all SNPs tested, two other SNPs involved in vitamin D metabolism (rs12785878 [11q12 near DHCR7] and rs10741657, [11p15 near CYP2R1]) were also found to be associated with 25OHD level, with or without adjustment for age, sex, ethnicity, and season of blood draw. A third SNP, rs6013897 (20q13 near CYP24A1), also previously implicated in vitamin D metabolism, was not significantly associated with 25OHD level (Table S6). Single SNP look-ups in large GWAS meta-analysis results (Table S7) revealed that all three SNPs were strongly associated with 25OHD level in SUNLIGHT (rs12785878: p = 2.1×10⁻²⁷; rs10741657: p = 3.3×10⁻²⁰; rs6013897, p = 6.0×10⁻¹⁰). rs6013897 was also found to be associated with BMD measurements at a threshold below genome-wide significance in GEFOS (p = 3.04×10⁻⁵). We observed no other associations between these SNPs and other calcemic or cardiometabolic traits.
Discussion
Our study documented a strong association between SNP rs2282679 and both serum DBP and 25OHD levels. As this SNP explained a large proportion of the variance in DBP levels, it enabled us to use this polymorphism in causal IV analyses to demonstrate that DBP levels are unlikely to have a causal role in all other tested traits and diseases. These observations, from large sample sizes, suggest that if 25OHD level does influence risk of these diseases, DBP level has little role in mediating this effect.
Each additional copy of the effect allele at rs2282679 lowered DBP concentration by 27.6 mg/l (95% CI 24.8, 30.4; p = 3.25×10−76) and explained 14.1% of its variance. Further, this effect allele was strongly correlated with reduced circulating 25OHD concentration (−4.3 nmol/l [95% CI −5.9, −2.7]; p = 8.0×10⁻⁸) in our study population and explained 1.5% of the variance in 25OHD level; only an additional 1.1% was explained by the other three vitamin-D-related SNPs, and another 3.5% by socio-demographic and environmental factors (Table S6). SNP rs2282679 may thus define genetic susceptibility to vitamin D deficiency in certain individuals and may also partly explain the differential increments in circulating 25OHD in response to vitamin D supplementation and ultraviolet light exposure. This effect allele was common in the population (minor allele frequency = 0.29) and explained a large proportion of the variance in DBP level, which highlights a direct mechanism of action between the gene and circulating levels of the protein and provides an ideal IV for a MR study. Results from our study indicate that DBP was causally responsible for circulating 25OHD level (p = 3.16×10⁻¹⁹).
Given that serum 25OHD concentration has an inverse relationship with PTH concentration, PTH level can be used as a functional readout for 25OHD level. Increased 25OHD levels are associated with increased calcium absorption, which may increase serum calcium and decrease production and secretion of PTH. Increased 25OHD levels may also result in augmented renal and/or parathyroid conversion of 25OHD to 1,25-dihydroxy-vitamin D (1,25OH2D). The consequent increase in either systemic or local production of 1,25OH2D can decrease PTH gene expression, and reduce PTH production [60],[61]. However, while DBP level strongly correlates with 25OHD level, our results indicate that DBP concentration does not influence PTH concentration. We recently reported that, in this largely vitamin-D-sufficient cohort, while total and free 25OHD levels correlated negatively with PTH, this relationship is mainly independent of DBP concentration [61]. In mice with targeted deletion of the Gc gene that completely lack DBP, PTH levels were not different between controls and animals without vitamin D toxicity or prolonged vitamin D deficiency (25OHD ≤6 ng/ml [15 nmol/l]) [23]. Our current MR study supports these findings. A recent study by Powe and colleagues [62] reported that only slightly higher PTH levels were found among black Americans with lower total 25OHD concentrations and DBP concentrations than among white Americans with lower total 25OHD concentrations and DBP concentrations, consistent with our findings. Powe and colleagues also identified that the large differences in 25OHD levels observed between black and white Americans are likely due to differences in DBP levels, which, once accounted for, lead to similar levels of bioavailable 25OHD in the two ethnic groups [62]. While these findings may have considerable impact on definitions of vitamin D deficiency, findings from our study do not provide evidence that differences in DBP levels impact risk of the common diseases tested.
MR studies have several advantages over observational studies. As genetic variants are stable throughout life, reverse causality and other forms of biases commonly associated with observational studies are removed; this strengthens causal associations between exposures and outcomes [63]. Indeed, given that the distribution of the genetic variation in the population is largely a random process (i.e., random assortment at meiosis), conclusions from MR studies can be likened to those from randomized controlled trials. In our study, the point effect estimate of DBP level on 25OHD level (8.39 nmol/l [95% CI 5.55, 11.22]) from our IV analysis was larger than the observational effect estimate (5.03 nmol/l [95% CI 3.92, 6.14]; test for endogeneity p = 0.01), suggesting that circulating 25OHD concentration may depend even more strongly on DBP level than as is seen in observational studies. Conversely, the similar effect estimates from IV and observational analyses for fasting glucose, BMD, calcium, and PTH suggest that these observational associations are unlikely to be biased by confounding or reverse causality. Indeed, this MR analysis has further refined our understanding of the clinical significance of DBP as a biomarker, and demonstrates that this serum protein is not a critical player in a causal pathway potentially linking vitamin D to the common diseases assessed.
While MR is able to strengthen causal inference, it faces potential limitations [49],[64]. Confounding can occur if polymorphisms in linkage disequilibrium with rs2282679 also have phenotypic effects related to the common diseases tested. We were also not able to account for possible pleiotropic effects of GC on physiologic pathways that could have masked tested associations. Null results could also be explained by canalization, i.e., phenotypic effects of genetic variations may be buffered during development [65]. Population stratification can also confound genotype–disease relationships if the association is influenced by factors related to population structure. Notably, adjusting for ethnicity in our regression models did not change the strength of associations. However, given that the overwhelming majority of all populations tested were of European descent, our findings are only applicable to those of European ancestry. Further, all tested populations in international consortia were primarily of European descent, making confounding by population stratification unlikely. We also acknowledge that our results are generalizable only to largely healthy, community-dwelling adults and not to infants, children, pregnanct women, or periods of human growth and development.
Another potential limitation of genetic association studies is unreliable genotype–intermediate phenotype associations [66]. This is unlikely in this case, as not only does rs2282679 explain 14.1% of the variance in DBP level, but it is also strongly associated with DBP level (CaMos, p = 3.3×10−76, n = 2,254; TwinsUK, p = 4.0×10−42, n = 1,674 [26]). While the large variance explained and power anticipated from this single SNP made it an ideal candidate for a genetic instrument for DBP, we acknowledge that this instrument conveys only one aspect of the overall vitamin D status in common diseases, and therefore can assess the causal effect of 25OHD level on common diseases only as mediated by DBP level. Three other SNPs previously implicated in the synthesis or metabolism of vitamin D (rs12785878, rs10741657, and rs6013897) were found to be strongly associated with 25OHD level in SUNLIGHT (rs12785878: p = 2.1×10⁻²⁷; rs10741657: p = 3.3×10⁻²⁰; rs6013897, p = 6.0×10⁻¹⁰), but were not associated with any other calcemic or cardiometabolic traits, except for femoral neck BMD. A large MR study on 25OHD level and blood pressure (n = 146,581) that used SNPs involved only in the synthesis of vitamin D (rs12785878 and rs12794714) as genetic instruments reported a small but significant association with hypertension (OR 0.92 [95% CI 0.87, 0.97]; p = 0.001) and borderline associations with diastolic (−0.29 mm Hg [95% CI −0.52, −0.07] per 10% increase in 25OHD level; p = 0.01) and systolic blood pressure (−0.37 mm Hg [95% CI −0.73, 0.003]; p = 0.052) [67]. However, the clinical implications of these possible effects have yet to be elucidated.
A study limitation is that biochemical information was cross-sectional, which prevents us from examining the impact of biological variability in DBP level over time on common diseases, and that our study has modeled a linear relationship between DBP and common diseases. Although we were able to replicate our MR findings using large GWAS data for the majority of diseases and traits, we were not able to do so for PTH; thus, smaller effects of DBP on PTH level may remain undetected by our study. Further, while stroke and TIA were determined in CaMos by self-report through a single interview question, METASTROKE had GWAS data only on ischemic stroke and its subtypes, not TIA. Hypertension was ascertained in CaMos by self-report and not blood pressure measurements, whereas ICBP provided publically available GWAS data on blood pressure measurements and not hypertension. Observational regression analyses showed that DBP level was associated with BMI (p = 9.1×10⁻⁶); however, this association was absent in IV analysis (p = 0.46), which is consistent with previous large-sale MR studies of BMI and 25OHD level [68] and suggests the presence of an endogenous regressor (p = 0.01). Such observational associations require instrumenting as they are potentially spurious because of unmeasured confounders or affected by reverse causality. Likewise, we provide data demonstrating a lack of causal relationship between DBP level and all tested common diseases and traits, except 25OHD level, from large and well-powered international consortia.
Some evidence suggests that 25OHD level may exert different threshold effects on PTH level and on skeletal outcomes. High serum concentrations of 25OHD (>100 nmol/l) have markedly diminished effects on PTH level [55]. A meta-analysis of effects of vitamin D supplementation by Reid and colleagues showed improvement in BMD at the femoral neck mainly in individuals with baseline 25OHD <50 nmol/l and not >50 nmol/l [69]. It is therefore possible that 25OHD may have an appreciable impact on non-skeletal outcomes only at levels <50 nmol/l. However, we note that among CaMos participants, DBP level has no obvious threshold effect (or any other non-linear relationship) on 25OHD or log-PTH levels (Figures S1 and S2, respectively).
In our subgroup analysis of participants with 25OHD levels <50 nmol/l, among all the traits tested, DBP was causally associated only with calculated free 25OHD level. Importantly, calculated free 25OHD level is assessed using DBP level, and thus this association is to be interpreted with caution. A future study using laboratory-measured bioavailable 25OHD level can be performed to test whether these associations can be replicated in larger cohorts of vitamin-D-deficient participants.
In sum, this MR study, with replication of null findings in large-scale GWAS meta-analyses, demonstrates that while a strong causal relationship exists between serum DBP and 25OHD level, DBP level is not causally associated with any of the calcemic and cardiometabolic common diseases tested. This suggests that if 25OHD does have causal influence on common diseases in the general population, it likely acts in a manner independent of DBP. Our results are generalizable to other vitamin-D-replete populations of community-dwelling healthy adults where the majority have 25OHD levels >50 nmol/l [70],[71]. Three other genetic variants that strongly influence 25OHD level, and influence 25OHD metabolism in ways independent of DBP, also showed no effect upon cardiometabolic disease. It remains to be determined whether 25OHD has a causal effect on these outcomes independent of DBP.
Supporting Information
Zdroje
1. HolickMF, BinkleyNC, Bischoff-FerrariHA, GordonCM, HanleyDA, et al. (2011) Evaluation, treatment, and prevention of vitamin D deficiency: an Endocrine Society clinical practice guideline. J Clin Endocrinol Metab 96 : 1911–1930.
2. HolickMF (2007) Vitamin D deficiency. N Engl J Med 357 : 266–281.
3. ArtazaJN, MehrotraR, NorrisKC (2009) Vitamin D and the cardiovascular system. Clin J Am Soc Nephrol 4 : 1515–1522.
4. GiallauriaF, MilaneschiY, TanakaT, MaggioM, CanepaM, et al. (2012) Arterial stiffness and vitamin D levels: the Baltimore longitudinal study of aging. J Clin Endocrinol Metab 97 : 3717–3723.
5. LaiH, FishmanEK, GerstenblithG, BrinkerJA, TongW, et al. (2012) Vitamin D deficiency is associated with significant coronary stenoses in asymptomatic African American chronic cocaine users. Int J Cardiol 158 : 211–216.
6. TakiishiT, GysemansC, BouillonR, MathieuC (2010) Vitamin D and diabetes. Endocrinol Metab Clin North Am 39 : 419–446.
7. ThrailkillKM, JoCH, CockrellGE, MoreauCS, FowlkesJL (2011) Enhanced excretion of vitamin D binding protein in type 1 diabetes: a role in vitamin D deficiency? J Clin Endocrinol Metab 96 : 142–149.
8. HatseS, LambrechtsD, VerstuyfA, SmeetsA, BrouwersB, et al. (2012) Vitamin D status at breast cancer diagnosis: correlation with tumor characteristics, disease outcome, and genetic determinants of vitamin D insufficiency. Carcinogenesis 33 : 1319–1326.
9. MondulAM, WeinsteinSJ, VirtamoJ, AlbanesD (2012) Influence of vitamin D binding protein on the association between circulating vitamin D and risk of bladder cancer. Br J Cancer 107 : 1589–1594.
10. TheodoratouE, PalmerT, ZgagaL, FarringtonSM, McKeigueP, et al. (2012) Instrumental variable estimation of the causal effect of plasma 25-hydroxy-vitamin D on colorectal cancer risk: a mendelian randomization analysis. PLoS ONE 7: e37662.
11. StokesCS, VolmerDA, GrunhageF, LammertF (2013) Vitamin D in chronic liver disease. Liver Int 33 : 338–352.
12. MakG, HananiaNA (2011) Vitamin D and asthma. Curr Opin Pulm Med 17 : 1–5.
13. ChalmersJD, McHughBJ, DochertyC, GovanJR, HillAT (2013) Vitamin-D deficiency is associated with chronic bacterial colonisation and disease severity in bronchiectasis. Thorax 68 : 39–47.
14. MaxwellCS, CarboneET, WoodRJ (2012) Better newborn vitamin D status lowers RSV-associated bronchiolitis in infants. Nutr Rev 70 : 548–552.
15. MarquesCD, DantasAT, FragosoTS, DuarteAL (2010) The importance of vitamin D levels in autoimmune diseases. Rev Bras Reumatol 50 : 67–80.
16. BenrashidM, MoyersK, MohtyM, SavaniBN (2012) Vitamin D deficiency, autoimmunity, and graft-versus-host-disease risk: implication for preventive therapy. Exp Hematol 40 : 263–267.
17. LevinAD, WadheraV, LeachST, WoodheadHJ, LembergDA, et al. (2011) Vitamin D deficiency in children with inflammatory bowel disease. Dig Dis Sci 56 : 830–836.
18. ErtenS, AltunogluA, CeylanGG, MarasY, KocaC, et al. (2012) Low plasma vitamin D levels in patients with familial Mediterranean fever. Rheumatol Int 32 : 3845–3849.
19. Fernandes de AbreuDA, LandelV, FeronF (2011) Seasonal, gestational and postnatal influences on multiple sclerosis: the beneficial role of a vitamin D supplementation during early life. J Neurol Sci 311 : 64–68.
20. HiraniV (2012) Vitamin D status and pain: analysis from the Health Survey for England among English adults aged 65 years and over. Br J Nutr 107 : 1080–1084.
21. HiraniV, TullK, AliA, MindellJ (2010) Urgent action needed to improve vitamin D status among older people in England!. Age Ageing 39 : 62–68.
22. VerbovenC, RabijnsA, De MaeyerM, Van BaelenH, BouillonR, et al. (2002) A structural basis for the unique binding features of the human vitamin D-binding protein. Nat Struct Biol 9 : 131–136.
23. SafadiFF, ThorntonP, MagieraH, HollisBW, GentileM, et al. (1999) Osteopathy and resistance to vitamin D toxicity in mice null for vitamin D binding protein. J Clin Invest 103 : 239–251.
24. BikleDD, SiiteriPK, RyzenE, HaddadJG (1985) Serum protein binding of 1,25-dihydroxyvitamin D: a reevaluation by direct measurement of free metabolite levels. J Clin Endocrinol Metab 61 : 969–975.
25. NykjaerA, DragunD, WaltherD, VorumH, JacobsenC, et al. (1999) An endocytic pathway essential for renal uptake and activation of the steroid 25-(OH) vitamin D3. Cell 96 : 507–515.
26. WangTJ, ZhangF, RichardsJB, KestenbaumB, van MeursJB, et al. (2010) Common genetic determinants of vitamin D insufficiency: a genome-wide association study. Lancet 376 : 180–188.
27. AhnJ, YuK, Stolzenberg-SolomonR, SimonKC, McCulloughML, et al. (2010) Genome-wide association study of circulating vitamin D levels. Hum Mol Genet 19 : 2739–2745.
28. LuL, ShengH, LiH, GanW, LiuC, et al. (2012) Associations between common variants in GC and DHCR7/NADSYN1 and vitamin D concentration in Chinese Hans. Hum Genet 131 : 505–512.
29. MuindiJR, AdjeiAA, WuZR, OlsonI, HuangH, et al. (2013) Serum vitamin D metabolites in colorectal cancer patients receiving cholecalciferol supplementation: correlation with polymorphisms in the vitamin D genes. Horm Cancer 4 : 242–250.
30. AdamsJS, ChenH, ChunR, RenS, WuS, et al. (2007) Substrate and enzyme trafficking as a means of regulating 1,25-dihydroxyvitamin D synthesis and action: the human innate immune response. J Bone Miner Res 22 (Suppl 2) V20–V24.
31. ChunRF (2012) New perspectives on the vitamin D binding protein. Cell Biochem Funct 30 : 445–456.
32. GommePT, BertoliniJ (2004) Therapeutic potential of vitamin D-binding protein. Trends Biotechnol 22 : 340–345.
33. Lopez-FarreAJ, Mateos-CaceresPJ, SacristanD, AzconaL, BernardoE, et al. (2007) Relationship between vitamin D binding protein and aspirin resistance in coronary ischemic patients: a proteomic study. J Proteome Res 6 : 2481–2487.
34. GibsonDS, NewellK, EvansAN, FinneganS, ManningG, et al. (2012) Vitamin D binding protein isoforms as candidate predictors of disease extension in childhood arthritis. J Proteomics 75 : 5479–5492.
35. BlantonD, HanZ, BierschenkL, Linga-ReddyMV, WangH, et al. (2011) Reduced serum vitamin D-binding protein levels are associated with type 1 diabetes. Diabetes 60 : 2566–2570.
36. RocchiccioliS, AndreassiMG, CecchettiniA, CarpeggianiC, L'AbbateA, et al. (2012) Correlation between vitamin D binding protein expression and angiographic-proven coronary artery disease. Coron Artery Dis 23 : 426–431.
37. GasparriC, CurcioA, TorellaD, GaspariM, CeliV, et al. (2010) Proteomics reveals high levels of vitamin D binding protein in myocardial infarction. Front Biosci (Elite Ed) 2 : 796–804.
38. BaierLJ, DobberfuhlAM, PratleyRE, HansonRL, BogardusC (1998) Variations in the vitamin D-binding protein (Gc locus) are associated with oral glucose tolerance in nondiabetic Pima Indians. J Clin Endocrinol Metab 83 : 2993–2996.
39. SzathmaryEJ (1987) The effect of Gc genotype on fasting insulin level in Dogrib Indians. Hum Genet 75 : 368–372.
40. FangY, van MeursJB, ArpP, van LeeuwenJP, HofmanA, et al. (2009) Vitamin D binding protein genotype and osteoporosis. Calcif Tissue Int 85 : 85–93.
41. AbbasS, LinseisenJ, SlangerT, KroppS, MutschelknaussEJ, et al. (2008) The Gc2 allele of the vitamin D binding protein is associated with a decreased postmenopausal breast cancer risk, independent of the vitamin D status. Cancer Epidemiol Biomarkers Prev 17 : 1339–1343.
42. CaldwellJD, JirikowskiGF (2013) Sex hormone binding globulin and corticosteroid binding globulin as major effectors of steroid action. Steroids 81 : 13–16.
43. LawlorDA, HarbordRM, SterneJA, TimpsonN, Davey SmithG (2008) Mendelian randomization: using genes as instruments for making causal inferences in epidemiology. Stat Med 27 : 1133–1163.
44. JacksonSA, TenenhouseA, RobertsonL (2000) Vertebral fracture definition from population-based data: preliminary results from the Canadian Multicenter Osteoporosis Study (CaMos). Osteoporos Int 11 : 680–687.
45. TraylorM, FarrallM, HollidayEG, SudlowC, HopewellJC, et al. (2012) Genetic risk factors for ischaemic stroke and its subtypes (the METASTROKE collaboration): a meta-analysis of genome-wide association studies. Lancet Neurol 11 : 951–962.
46. EstradaK, StyrkarsdottirU, EvangelouE, HsuYH, DuncanEL, et al. (2012) Genome-wide meta-analysis identifies 56 bone mineral density loci and reveals 14 loci associated with risk of fracture. Nat Genet 44 : 491–501.
47. MorrisAP, VoightBF, TeslovichTM, FerreiraT, SegreAV, et al. (2012) Large-scale association analysis provides insights into the genetic architecture and pathophysiology of type 2 diabetes. Nat Genet 44 : 981–990.
48. International Consortium for Blood Pressure Genome-Wide Association Studies (2011) EhretGB, MunroePB, RiceKM, BochudM, et al. (2011) Genetic variants in novel pathways influence blood pressure and cardiovascular disease risk. Nature 478 : 103–109.
49. DupuisJ, LangenbergC, ProkopenkoI, SaxenaR, SoranzoN, et al. (2010) New genetic loci implicated in fasting glucose homeostasis and their impact on type 2 diabetes risk. Nat Genet 42 : 105–116.
50. YangJ, LoosRJ, PowellJE, MedlandSE, SpeliotesEK, et al. (2012) FTO genotype is associated with phenotypic variability of body mass index. Nature 490 : 267–272.
51. SchunkertH, KonigIR, KathiresanS, ReillyMP, AssimesTL, et al. (2011) Large-scale association analysis identifies 13 new susceptibility loci for coronary artery disease. Nat Genet 43 : 333–338.
52. FanB, LuY, GenantH, FuerstT, ShepherdJ (2010) Does standardized BMD still remove differences between Hologic and GE-Lunar state-of-the-art DXA systems? Osteoporos Int 21 : 1227–1236.
53. LuY, FuerstT, HuiS, GenantHK (2001) Standardization of bone mineral density at femoral neck, trochanter and Ward's triangle. Osteoporos Int 12 : 438–444.
54. BergerC, GoltzmanD, LangsetmoL, JosephL, JacksonS, et al. (2010) Peak bone mass from longitudinal data: implications for the prevalence, pathophysiology, and diagnosis of osteoporosis. J Bone Miner Res 25 : 1948–1957.
55. BergerC, Greene-FinestoneLS, LangsetmoL, KreigerN, JosephL, et al. (2012) Temporal trends and determinants of longitudinal change in 25-hydroxyvitamin D and parathyroid hormone levels. J Bone Miner Res 27 : 1381–1389.
56. LeveyAS, StevensLA, SchmidCH, ZhangYL, CastroAF3rd, et al. (2009) A new equation to estimate glomerular filtration rate. Ann Intern Med 150 : 604–612.
57. BaumCF, SchafferME, StillmanS (2003) Instrumental variables and GMM: estimation and testing. Stata J 3 : 1–31.
58. NordestgaardBG, PalmerTM, BennM, ZachoJ, Tybjaerg-HansenA, et al. (2012) The effect of elevated body mass index on ischemic heart disease risk: causal estimates from a Mendelian randomisation approach. PLoS Med 9: e1001212.
59. BrionMJ, ShakhbazovK, VisscherPM (2013) Calculating statistical power in Mendelian randomization studies. Int J Epidemiol 42 : 1497–1501.
60. Greene-FinestoneLS, BergerC, de GrohM, HanleyDA, HidiroglouN, et al. (2011) 25-hydroxyvitamin D in Canadian adults: biological, environmental, and behavioral correlates. Osteoporos Int 22 : 1389–1399.
61. DastaniZ, BergerC, LangsetmoL, FuL, WongBY, et al. (2014) In healthy adults, biological activity of vitamin D, as assessed by serum PTH, is largely independent of DBP concentrations. J Bone Miner Res 29 : 494–499.
62. PoweCE, EvansMK, WengerJ, ZondermanAB, BergAH, et al. (2013) Vitamin D-binding protein and vitamin D status of black Americans and white Americans. N Engl J Med 369 : 1991–2000.
63. SmithGD, EbrahimS (2003) ‘Mendelian randomization’: can genetic epidemiology contribute to understanding environmental determinants of disease? Int J Epidemiol 32 : 1–22.
64. BrunnerEJ, KivimakiM, WitteDR, LawlorDA, Davey SmithG, et al. (2008) Inflammation, insulin resistance, and diabetes—Mendelian randomization using CRP haplotypes points upstream. PLoS Med 5: e155.
65. HartmanJL4th, GarvikB, HartwellL (2001) Principles for the buffering of genetic variation. Science 291 : 1001–1004.
66. ColhounHM, McKeiguePM, Davey SmithG (2003) Problems of reporting genetic associations with complex outcomes. Lancet 361 : 865–872.
67. VimaleswaranKS, CavadinoA, BerryDJ (2014) LifeLines Cohort Study Investigators (2014) JordeR, et al. (2014) Association of vitamin D status with arterial blood pressure and hypertension risk: a mendelian randomisation study. Lancet Diabetes Endocrinol 2 : 719–729.
68. VimaleswaranKS, BerryDJ, LuC, TikkanenE, PilzS, et al. (2013) Causal relationship between obesity and vitamin D status: bi-directional Mendelian randomization analysis of multiple cohorts. PLoS Med 10: e1001383.
69. ReidIR, BollandMJ, GreyA (2014) Effects of vitamin D supplements on bone mineral density: a systematic review and meta-analysis. Lancet 383 : 146–155.
70. PludowskiP, GrantWB, BhattoaHP, BayerM, PovoroznyukV, et al. (2014) Vitamin D status in central Europe. Int J Endocrinol 2014 : 589587.
71. LipsP, HoskingD, LippunerK, NorquistJM, WehrenL, et al. (2006) The prevalence of vitamin D inadequacy amongst women with osteoporosis: an international epidemiological investigation. J Intern Med 260 : 245–254.
Štítky
Interní lékařstvíČlánek vyšel v časopise
PLOS Medicine
2014 Číslo 10
- Alternativní léčebné možnosti u hypercholesterolemie při intoleranci statinů
- Vliv kombinace nutraceutik na remodelaci levé komory srdeční u osob s metabolickým syndromem
- Nutraceutika a jejich ovlivnění mírného kardiometabolického rizika
- Princip účinku medu v léčbě chronických i infikovaných ran
- Superoxidovaný roztok a jeho využití v léčbě ran
Nejčtenější v tomto čísle
- Critical Appraisal and Data Extraction for Systematic Reviews of Prediction Modelling Studies: The CHARMS Checklist
- Developmental Profiles of Eczema, Wheeze, and Rhinitis: Two Population-Based Birth Cohort Studies
- Maternal Clinical Diagnoses and Hospital Variation in the Risk of Cesarean Delivery: Analyses of a National US Hospital Discharge Database
- Association of Medical Students' Reports of Interactions with the Pharmaceutical and Medical Device Industries and Medical School Policies and Characteristics: A Cross-Sectional Study