
Estimating the causal influence of body mass index on risk of Parkinson disease: A Mendelian randomisation study
Using Mendelian randomization, Nicholas Wood and colleagues examine the association between genetically conferred risk of higher BMI and the risk of Parkinson Disease.
Published in the journal:
. PLoS Med 14(6): e32767. doi:10.1371/journal.pmed.1002314
Category:
Research Article
doi:
https://doi.org/10.1371/journal.pmed.1002314
Summary
Using Mendelian randomization, Nicholas Wood and colleagues examine the association between genetically conferred risk of higher BMI and the risk of Parkinson Disease.
Introduction
The risk of many disease outcomes increases as body mass index (BMI) increases, including cardiovascular disease and cancer [1]. Low BMI has also been associated with excess mortality (e.g., due to lung disease), but it is unknown whether these relationships are causal [1,2].
Parkinson disease (PD) is the second most common neurodegenerative disease worldwide [3]. The population burden is increasing for PD, relative to other diseases, even after population ageing is taken into account, and there is no cure [4]. A wide range of potential risk factors for PD have been described, mainly in observational studies [5,6].
The role of BMI in risk of PD is unclear, with observational studies providing conflicting results. A meta-analysis of case–control studies found significantly lower BMI in patients with PD compared with controls, but reverse causality could explain these findings (i.e., weight loss as a result of PD) [7]. A nested case–control study suggested that weight loss may precede the clinical diagnosis of PD [8]. Other studies have found negative associations between BMI and PD, some have found apparent null associations, and one has found a positive association [9–12].
Ten cohort studies were recently meta-analysed, and the pooled odds ratio (OR) for the association of a 5-kg/m2 higher BMI with risk of PD was 1.00 (95% 0.89–1.12) [13]. However, there was substantial heterogeneity between studies (I2 = 65%; p = 0.003), and individual studies may have been affected by residual confounding, bias, and, again, reverse causality (the latter can occur even in cohort studies, because PD has a long prodromal phase prior to diagnosis).
Mendelian randomisation (MR) is an instrumental variable (IV)–based method to infer causality in observational studies [14]. Gene variants that are associated with intermediate phenotypes or environmental exposures can be used as IVs to estimate the effect of the exposure on a disease outcome (see Fig 1). Random assortment of gene variants during gametogenesis means that potential confounding factors (observed and unobserved) are more likely to be evenly distributed, and the effect estimate that results from IV analysis is likely to be free from residual confounding and reverse causality. Given the difficulties in identifying causal risk factors for PD, MR has great potential to advance aetiological knowledge and identify putative therapeutic targets [15]. Methods are evolving rapidly as more in silico datasets become available in the form of extensive genetic data for a huge range of phenotypes and outcomes. Two-sample MR involves measuring variant–exposure associations in one dataset and variant–outcome associations in a second [16]. However, MR relies on certain assumptions:
The IV is robustly associated with the exposure of interest. This assumption can be checked by calculating an F statistic and R2 value. The IV may explain only a tiny amount of variance in the exposure (R2), and therefore studies often have to be large. As a result of genome-wide association (GWA) studies, there are increasing numbers of genetic variants that account for the variance in a range of exposures and outcomes, allowing instruments of greater strength to be constructed.
The IV is independent of known confounders. In MR studies that have individual-level data, one can check for known confounders and compare the frequency of these between the two levels of the IV. In two-sample MR, the absence of individual-level data about potential confounders can hamper the ability to test this assumption.
The IV is independent of the outcome, given the exposure and confounders. In other words, there must be no alternative path, other than via the exposure, that the IV influences the outcome. This is known as the exclusion restriction criterion. One situation that violates this assumption is horizontal pleiotropy, in which there are alternative pathways through which the IV affects the outcome.
![Directed acyclic graph of instrumental variable analysis using genetic variants as proxies for environmental exposures (adapted from Lawlor et al. [<em class="ref">14</em>]).](https://pl-master.mdcdn.cz/media/cache/media_object_image_large/media/image/9e43446325ddc92cc50ac01f8073f2a4.png)
Here we describe the use of two-sample MR to estimate the causal association between genetically conferred variance in BMI and risk of PD.
Methods
Two-sample MR was undertaken using GWA study data. Ethical approval was not sought for this specific project because all data came from the summary statistics of published GWA studies, and no individual-level data were used.
Genetic variant instruments for body mass index
SNPs from the largest GWA study of BMI to date were identified from the 2015 summary statistic files from the GIANT (Genetic Investigation of Anthropometric Traits) consortium (http://portals.broadinstitute.org/collaboration/giant/index.php/GIANT_consortium) [17]. Data on major and minor alleles for each SNP (after imputation, 2,554,637 variants in 339,224 individuals of European descent), along with allele frequencies, beta coefficients for allele dose and 5-kg/m2 change in BMI (i.e., the change in BMI on a 5-kg/m2 scale per effect allele), p-values, and standard errors (SEs) were extracted.
This large number of variants was “clumped” to obtain a set of index SNPs that were independent of each other and associated with BMI at the genome-wide significance level (i.e., p-value < 5 × 10⁻⁸). Index SNPs were identified by ranking BMI associations from the smallest to largest p-value (but still with a cutoff value of p = 5 × 10⁻⁸). Clumped SNPs were those in linkage disequilibrium (LD) with index SNPs (R2 threshold of 0.001) or within 10,000 kb physical distance, based on a reference dataset (1000 Genomes Project; http://www.internationalgenome.org/). Hence, each index SNP represented a number of clumped SNPs that were all associated with or near to the index SNP, and the index SNPs were all independent of one another (according to the parameters defined here). Independence of index SNPs is important because bias can be introduced if there is LD between them and can result to over-precise estimates in subsequent analysis. Standard code for clumping is available on the PLINK website (http://zzz.bwh.harvard.edu/plink/clump.shtml), and further information is provided in S1 Appendix.
After clumping, there were 78 independent SNPs that were associated with BMI (p < 5 × 10⁻⁸), and together these explained 2.2% of the variance in BMI (R2 = 0.022), as calculated from the summary files from the GIANT consortium [17]. To test the statistical significance of the association of the instrument with BMI, an F statistic was calculated using the following formula, where k is the number of variants and n is the sample size:

Association of body mass index genetic variants with Parkinson disease
PD genotyping data were from the most recent meta-analysis of GWA studies in PD, which related 7,782,514 genetic variants (after imputation) to PD, in up to 13,708 PD cases and 95,282 controls from 15 independent GWA datasets of individuals of European descent; the meta-analysis was undertaken by the International Parkinson Disease Genomics Consortium (IPDGC; http://pdgenetics.org/) [18]. We extracted the per-allele log-OR of PD together with its SE for each of the independent, genome-wide significant BMI SNPs identified from the GIANT consortium. It was possible to do this for 76 of the 78 BMI SNPs; for one SNP (rs1016287) a suitable proxy in high LD was available (rs887912; R2 = 1.0), but for another SNP (rs2245368), no suitable proxy (with R2 > 0.9) could be found, leaving 77 variants available for IV analysis. Three SNPs (rs1558902, rs17001654, and rs4256980) were palindromic, resulting in potential strand ambiguity. Allele frequencies for these were compared between the BMI and PD datasets to ensure that effect estimates were recorded with respect to the same effect allele.
Two-sample Mendelian randomisation methods
Two-sample MR was undertaken using previously described methods and as summarised below [19,20]. Wald ratios (βIV) were calculated for each of the 77 SNPs by dividing the per-allele log-OR of PD (βZY) by the per-allele difference in mean BMI for each SNP (βZX):

Individual Wald ratios and 95% CIs were compiled in a forest plot. Heterogeneity in Wald ratios was tested using Cochran’s Q and quantified using the I2 test. A “leave one out” sensitivity analysis was undertaken to identify variants with disproportionate effects, again using the IVW method.
To establish that violations of the third assumption of IV analysis were not biasing the estimate of the causal association (i.e., that there was not an aggregate unbalanced horizontal pleiotropic effect), MR–Egger regression was used. MR–Egger regression is similar to IVW regression, except that the intercept is not constrained to pass through the origin [20]. Substantial heterogeneity in the IVW estimate indicates that alternative pathways may exist from some of the SNPs to the outcome (known as horizontal pleiotropy), but this does not necessarily bias the estimate. However, a non-zero intercept from the MR–Egger regression suggests that pleiotropic effects tend to be in the direction of the intercept term, which will bias IVW estimates. A statistical hypothesis test can be performed to see if there is evidence of the intercept being different from zero, indicating overall unbalanced pleiotropy. The slope of the MR–Egger regression provides the estimate of the effect of BMI on PD when the third assumption is relaxed. The estimate is correct providing an additional assumption holds, the InSIDE (instrument strength independent of direct effect) assumption. This assumption states that the associations between genetic variants and the exposure are independent of the direct effects of the variants on the outcome [20].
In the absence of unbalanced pleiotropy, the IV estimates for individual SNPs ought to be symmetrically distributed around the point estimate, which, if centred on the IVW estimate, suggests that the result is not systematically biased. This can be demonstrated using a funnel plot of the individual variant effects plotted against the inverse of their SE.
We also repeated the IVW and MR–Egger analyses using the original 97 independent variants reported by the GIANT consortium (i.e., without the clumping step described above) [17]. Similar to the analyses with the 77 clumped variants, two variants were not available in the IPDGC data. The same proxy was used for one, and no proxy was found for the other, leaving 96 variants in the instrument.
Power calculations were undertaken using the proportion of variance in BMI explained by the 77 independent SNPs (R2 = 0.022) and the methods described by Brion and colleagues [21]. There was 92% power to detect a relative 20% difference in PD risk for a 5-kg/m2 difference in BMI (i.e., an OR of at least 0.80 or 1.20) in the IPDGC cases and controls with an alpha of 5% (p-value ≤ 0.05). Power reduced to 38% to detect a relative difference in risk of 10%. These power calculations assumed no heterogeneity.
Frailty analysis
Studies of disorders that are strongly influenced by age (such as neurodegenerative disease) may be prone to bias if selective mortality has occurred [22]. For example, if people with high BMI died prematurely before being diagnosed with PD, then bias could occur because individuals with lower BMI live longer, resulting in a greater risk of being diagnosed with PD. Such an induced association would not reflect any biological link between BMI and PD. We performed simulations to estimate the likely effect that our MR analysis would show due to survival bias, assuming that BMI was not related to PD. The objective was to see if the likely magnitude of the survival bias was large enough to explain the MR results estimated from the real data. We performed simulations where a large sample (n = 500,000) was generated with data on BMI, SNPs influencing BMI, age, mortality status, and PD status. The variables were related using the following model:
Individuals were randomly assigned genotypes for each of 77 SNPs, with allele frequencies corresponding those in the MR analysis.
BMI values for each individual were simulated using their genotype values and the effect size (in standard deviation units) of each SNP, and a random value to create a population variance of one.
An age variable was generated for all individuals to match the distribution of ages in the PD meta-analysis.
Alive/dead status was simulated for individuals as a function of their age and BMI. Baseline age-related mortality rates and mortality rates for varying BMI levels were obtained from Davey Smith and colleagues [2]. These were used to generate a Gompertz–Makeham mortality curve, and individuals had their alive/dead status sampled as a function of the probability of death due to the survival curve.
PD status was simulated as a function of age-related diagnosis rates obtained from Driver et al. [23]; therefore, PD status was a function of age only, and unrelated to BMI level.
A subset of 13,708 simulated individuals with PD and 95,282 without PD, all of whom survived the mortality function, were then retained, based on the distribution of ages of individuals in the Nalls et al. PD GWA study [18]. Observational associations and MR were performed on these individuals to gauge the extent to which an association between BMI and PD was induced artificially by frailty effects.
The entire process was repeated 1,000 times to obtain a distribution of the effect size that was due to frailty effects only.
Full details about the simulations are available in S1 Appendix.
All analyses were undertaken in R (version 3.2.3).
Results
Table 1 shows the 77 variants selected for the analysis, with the effect alleles and frequencies, the magnitude of the effect on BMI, and strength of the association with PD. Further information on each variant, including regional genes and functions, are given in S1 and S2 Tables in S1 Appendix. The per-allele results of the IV analysis are provided in S3 Table in S1 Appendix. The F statistic for the instrument and its association with BMI was 99, which is large. This means that weak instrument bias was unlikely.

Using the IVW method to pool results from individual SNPs, genetically conferred higher BMI was found to be associated with a reduced risk of PD. The OR of PD per 5-kg/m2 higher BMI was 0.82 (95% CI 0.69–0.98; p = 0.029). There was minimal evidence of heterogeneity between variants (Q statistic = 95.5; I2 = 20.4%; p = 0.065; see Fig 2 and S3 Table in S1 Appendix). For the observed OR of 0.82, the estimated statistical power was 85% when the alpha was set at 5%.

Results from a “leave one out” analysis demonstrated that no single SNP was driving the IVW point estimate (see S4 Table in S1 Appendix). For example, after removal of the rs1558902 SNP, in the FTO locus, which has a strong magnitude of association with BMI, the OR of PD per 5-kg/m2 higher BMI was 0.84 (95% CI 0.70–1.00).
The effect estimated from MR–Egger regression was 0.76 (95% CI 0.51–1.14; p = 0.177), with an intercept of 0.002 (95% CI −0.008 to 0.013; p = 0.654). A funnel plot (see S1 Fig in S1 Appendix) suggested that individual variants were symmetrically distributed around the point estimate. Together these findings provide evidence against the possibility that systematic bias in the IVW estimate may have arisen through overall unbalanced horizontal pleiotropy.
We repeated the analysis using the original set of “un-clumped” variants reported by the GIANT consortium (96 variants in total) [17]. This reanalysis did not alter the observed effect of genetically estimated BMI on risk of PD (IVW OR 0.80, 95% CI 0.67–0.97; see S2 Fig in S1 Appendix).
We performed simulations to obtain estimates of effect sizes that would be induced by survival bias alone, under the null hypothesis that BMI is not biologically related to PD. If the effect sizes obtained from these simulations were similar in magnitude to the effect sizes we estimated from the real data, it would suggest that survival bias was sufficient to explain the results. Simulations using empirical BMI - and age-related mortality rates demonstrated that a likely influence of frailty on biasing the MR analysis of BMI and risk of PD was present, but smaller than the estimated inverse influence of BMI on PD from the empirical MR analysis (see Fig 3). The mean induced effect due to frailty alone in the IVW analysis was an OR of 0.97 per 5-kg/m2 higher BMI (95% CI 0.92–1.03), compared to our empirical estimate of the OR of PD per 5-kg/m2 higher BMI of 0.82 (95% CI 0.69–0.98).

Discussion
This study provides MR evidence that higher BMI could protect against the risk of developing PD. Simulation studies performed to ascertain the effect of survivor bias showed that survivor bias could be a contributing factor but did not explain all of the effect. To our knowledge, this is the first MR study of this association and was undertaken in a very large sample. Genetic elements expected to lead to a lifetime elevation in BMI of 5 kg/m2 were associated with a lower risk of PD, indicating a causal influence of BMI on PD (OR 0.82). Whilst there was minimal evidence of heterogeneity across individual SNP estimates, the MR–Egger analysis supported our main study findings, with an intercept value close to zero and a point estimate for the effect that was similar to that of the main analysis (see S3 Fig in S1 Appendix). MR–Egger regression has less statistical power than an equivalent IVW meta-analysis, and hence the confidence intervals for this analysis were wider and included the null value.
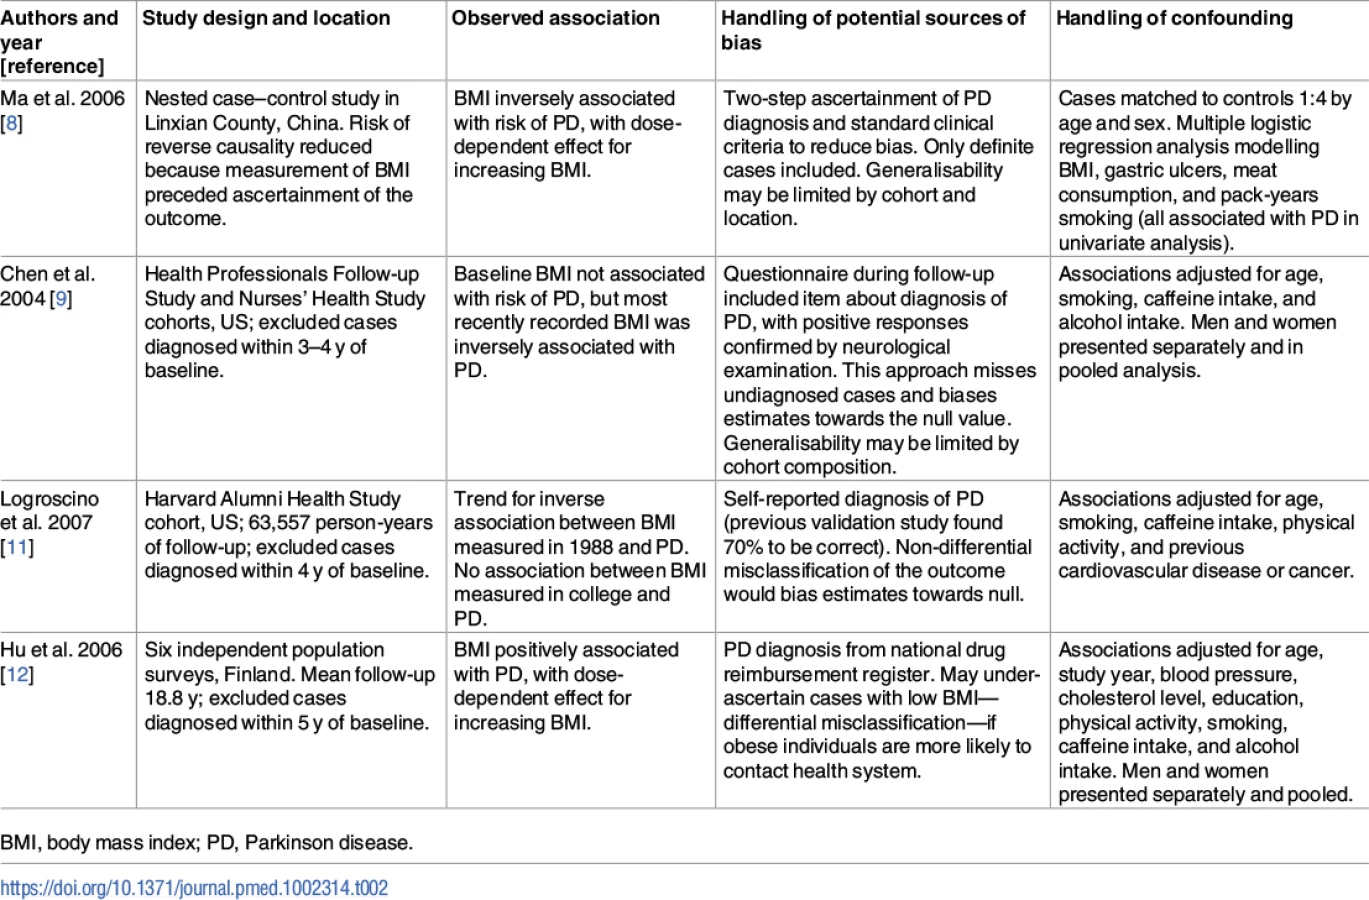
These findings shed additional light on an issue for which the evidence to date has been mixed. Prior to PD diagnosis, observational studies have found conflicting results with regard to the association between BMI and risk of PD [8–12]. The conflicting results may be due to study-specific biases, differential adjustment for confounding factors, and use of different cutoffs to define the exposure (see Table 2). A recent meta-analysis of these and additional studies concluded that there was no robust observational association [13]. There was substantial heterogeneity between the effect estimates of individual studies (I2 = 65%; p = 0.003), raising the question as to whether it was appropriate to perform meta-analysis. Three of these studies did not set out specifically to investigate the effect of BMI on the risk of PD [8,24,25]. Two of the studies showed a clear negative association between higher BMI and the risk of PD [8,11]. Many of the studies used self-report questionnaires to ascertain PD, which is likely to have resulted in under-ascertainment of the outcome and bias towards the null. These factors could have had a strong influence on the overall results of the meta-analysis.
Recently, a similar direction and magnitude of effect of higher BMI on risk of PD was reported from the United Kingdom Clinical Practice Research Datalink. In a cohort of nearly 2 million, underweight people had a 15% excess risk of PD compared with normal weight people, and overweight and obese people had a 12% and 17% reduction in risk, respectively [10].
The mechanism through which higher BMI may reduce the risk of PD is not immediately apparent, but researchers have recently reported on possible neuroprotective benefits arising in those with higher BMI, particularly relating to preservation of cognitive function and neural networks, explored using functional imaging [26]. Higher BMI affects levels of circulating and central insulin, which in turn may play a beneficial role with respect to neurodegeneration [27]. Theories such as these require substantial further exploration.
Weight loss is widely recognised in patients with a diagnosis of PD [7]. The mechanisms underlying body weight reduction in this context are easier to understand and are multifactorial, including intrinsic factors of the disease as well as disruption of both peripheral and central regulatory mechanisms of body weight, feeding behaviour, and energy metabolism [28]. Vitally, however, the mechanisms that drive risk of PD may not be the same as those that underlie progression once disease has occurred, and the MR study presented here is designed to investigate only the former.
There are a number of candidate genes (see S1 and S2 Tables in S1 Appendix) that are located in close proximity to SNPs included as IVs, which is intriguing and raises the possibility of pleiotropic pathways (i.e., not via BMI). BDNF, coding for Brain-Derived Neurotrophic Factor, is a gene that has previously been implicated in PD, and BDNF has been discussed as a potential therapeutic agent in neurodegenerative disease but has previously been unsuccessful in clinical trials in patients with amyotrophic lateral sclerosis [29–31]. PARK2, coding for the Ubiquitin E3 ligase Parkin, is mutated in rare autosomal recessive juvenile-onset parkinsonism cases, and is notable for not having been identified in a GWA study for PD [18,32]. Finally, the RPTOR gene (encoding Raptor, a regulator of the kinase mTOR) is of interest given the links between the mTOR pathway, macroautophagy, and PD [33]. For each of these examples, proof that these genes are directly linked to causation at these loci requires further research.
The finding of higher BMI reducing the risk of PD seemingly conflicts with the observation from a cohort study that physical activity may be a protective factor for PD [34]. Again, cohort studies such as this may be biased by confounding or reverse causality, and the association with physical activity may be driven simply by the fact that people with undiagnosed PD may undertake less activity as a result of occult disease. However, evidence of an effect of physical activity on BMI may be weaker than one might intuitively expect [35,36]. There may be true inverse causal associations for both BMI and physical activity with risk of PD, and physical activity may protect primarily through mechanisms that are independent of BMI. An MR study (or randomised controlled trial) of physical activity and risk of PD could be used to explore this further, if robust genetic variants could be identified to account for variability in this behaviour.
An MR study to determine an association between genetically conferred variance in BMI (alongside other potentially modifiable risk factors) and Alzheimer disease was recently reported [37]. The authors observed no similar protective effect to that which we observed for PD, but their instrument used only 32 variants. They did observe a reduction in risk of Alzheimer disease for increasing blood pressure, but did not undertake a similar frailty analysis to that which we conducted.
Our frailty simulations sought to explore the extent to which our MR results could be explained by frailty effects alone. The influence of frailty effects should be an important consideration in epidemiological studies dealing with later life events [22]. We found that the effect of BMI on mortality and the age disparity between the cases and controls in the PD GWA study was unlikely to be sufficient to explain our MR estimate, particularly given that PD has a relatively early onset compared to some other neurological disorders (median age 60 y old) [3].
Strengths and weaknesses
MR uses an IV approach to assess causal relationships between environmental exposures/intermediate phenotypes and disease outcomes, while minimising or eliminating the possibility of bias due to residual confounding or reverse causality. One key assumption is that the instrument affects PD risk through its effect on a specific phenotype/exposure (here this was BMI), and does not have a direct effect on PD risk independently of this (the exclusion restriction criterion, or assumption number three from the Introduction). We tested this assumption using MR–Egger regression and found no evidence of violation of this assumption.
This analysis was undertaken using summary statistics from the two largest datasets for BMI and PD. The use of different datasets to ascertain variant–exposure and variant–outcome associations, so-called two-sample MR, has methodological advantages over analysis undertaken in a single dataset, but also some limitations [38]. First, the data are available without having to undertake measurement of each association in turn, saving both time and cost. Second, statistical power is high because very large sample sizes can be achieved using this method. Third, if bias did arise in the analysis due to weak instruments, it would tend to be biased towards the null (i.e., give rise to conservative estimates), whereas in one-sample MR the estimate tends to be biased towards the confounded observational study estimate [16]. The first assumption of MR is that the instrument under study is strongly associated with the exposure. Here, the first-stage F statistic was large (99), and so weak instrument bias is unlikely. Furthermore, samples are assumed to be completely independent. The cohorts contributing to both the GIANT and IPDGC consortia are listed in S5 and S6 Tables in S1 Appendix. If there was some overlap in the controls from the two consortia, then an F statistic of this magnitude would mitigate potential bias.
Our frailty analysis used demographic information to model the induced bias due to the combination of BMI influencing mortality and cases being on average younger than controls in the PD GWA study. Alternative mechanisms of frailty may operate. For example, because BMI reduces longevity, individuals with high BMI who survive longer potentially over-represent unmeasured factors that increase longevity. If these factors, in turn, also influence risk of PD, then bias could be introduced into our MR estimates. This mechanism can influence observational associations also.
One weakness of our approach is that two-sample MR using aggregate data (as done here) does not currently allow one to examine non-linear relationships between exposures and outcomes. The association between BMI and most health-related outcomes tends to be U - or J-shaped, with very low weight and above average weight both resulting in adverse outcomes [1]. Here, in the MR analysis, BMI was modelled as a continuous variable, and linearity assumed. The use of aggregate data also means that we were not able to test differences of effect in subgroups. There is evidence to suggest that the causal effect of BMI on some outcomes, including socioeconomic status, may differ between men and women [39]. Using this design, we cannot test whether effects of BMI on PD differ by sex. In addition, lack of information about potential confounding factors for the relationship of BMI and PD means that associations between the variants and smoking/alcohol behaviours could not be tested (assumption number two from the Introduction). Another limitation of this study is that it does not offer insight into the mechanisms by which BMI is causally related to PD. Finally, two-sample MR assumes that both samples come from the same population, but with no overlap. If they come from separate populations, the magnitude of the estimated causal effect could be biased. We took steps to ensure that both samples were of individuals of European ancestry.
In this large two-sample MR study exploring the association between genetically determined higher BMI and risk of PD, we observed a possible protective effect exerted by a potentially modifiable factor. MR should be seen as one tool to explore causal questions, but not as a definitive answer. However, robust empirical evidence to support a protective role of higher BMI in risk of PD may be hard to obtain. It is plausible that our finding could be replicated in large cohort studies such as the UK Biobank, which gathered information on a wide range of exposures and disease outcomes, along with genotyping data, on more than half a million older people in the UK [40]. Our study offers the best evidence to date that higher BMI may convey relative protection against PD, in support of clinical observation and some of the pre-existing observational studies. However, the apparent protective influence of higher BMI could be at least partially induced by survival bias in the PD GWA study, as demonstrated in the frailty simulations.
Although BMI is a potentially modifiable risk factor for PD, the negative health impacts of raising BMI are likely to be significant, and should be taken into account. Expected negative effects would include increased risk of type 2 diabetes mellitus, ischaemic heart disease, and cancer. Causal associations have been demonstrated between higher BMI and many cancers, and have been explored for BMI and cardiovascular disease [41,42]. Assuming replication of a negative association between BMI and PD, a great deal of further work would be required (including mechanistic insights) before recommending this as a potential intervention against PD, given the wider public health effects.
Supporting Information
Zdroje
1. Prospective Studies Collaboration. Body-mass index and cause-specific mortality in 900 000 adults: collaborative analyses of 57 prospective studies. Lancet. 2009; 373 : 1083–96. doi: 10.1016/S0140-6736(09)60318-4 19299006
2. Davey Smith G, Sterne JAC, Fraser A, Tynelius P, Lawlor DA, Rasmussen F. The association between BMI and mortality using offspring BMI as an indicator of own BMI: large intergenerational mortality study. BMJ. 2009;339:b5043. doi: 10.1136/bmj.b5043 20028778
3. Lees AJ, Hardy J, Revesz T. Parkinson’s disease. Lancet. 2009;373 : 2055–66. doi: 10.1016/S0140-6736(09)60492-X 19524782
4. GBD 2013 Mortality and Causes of Death Collaborators. Global, regional, and national age-sex specific all-cause and cause-specific mortality for 240 causes of death, 1990–2013: a systematic analysis for the Global Burden of Disease Study 2013. Lancet. 2015;385 : 117–71. doi: 10.1016/S0140-6736(14)61682-2 25530442
5. Noyce AJ, Bestwick JP, Silveira-Moriyama L, Hawkes CH, Giovannoni G, Lees AJ, et al. Meta-analysis of early nonmotor features and risk factors for Parkinson disease. Ann Neurol. 2012;72 : 893–901. doi: 10.1002/ana.23687 23071076
6. Noyce AJ, Lees AJ, Schrag A-E. The prediagnostic phase of Parkinson’s disease. J Neurol Neurosurg Psychiatry. 2016;87 : 871–8. doi: 10.1136/jnnp-2015-311890 26848171
7. van der Marck MA, Dicke HC, Uc EY, Kentin UC, Borm GF, Bloem BR, et al. Body mass index in Parkinson’s disease: a meta-analysis. Parkinsonism Relat Disord. 2012;18 : 263–7. doi: 10.1016/j.parkreldis.2011.10.016 22100523
8. Ma L, Zhang L, Gao XH, Chen W, Wu YP, Wang Y, et al. Dietary factors and smoking as risk factors for PD in a rural population in China: a nested case-control study. Acta Neurol Scand. 2006;113 : 278–81. doi: 10.1111/j.1600-0404.2005.00571.x 16542169
9. Chen H, Zhang SM, Schwarzschild MA, Hernán MA, Willett WC, Ascherio A. Obesity and the risk of Parkinson’s disease. Am J Epidemiol. 2004;159 : 547–55. 15003958
10. Qizilbash N, Gregson J, Johnson ME, Pearce N, Douglas I, Wing K, et al. Body mass index and risk of Parkinson’s disease in a cohort of two million people over two decades. Pharmacoepiol Drug Saf. 2016;25(Suppl 3):105.
11. Logroscino G, Sesso HD, Paffenbarger RS, Lee I-M. Body mass index and risk of Parkinson’s disease: a prospective cohort study. Am J Epidemiol. 2007;166 : 1186–90. doi: 10.1093/aje/kwm211 17709328
12. Hu G, Jousilahti P, Nissinen A, Antikainen R, Kivipelto M, Tuomilehto J. Body mass index and the risk of Parkinson disease. Neurology. 2006;67 : 1955–9. doi: 10.1212/01.wnl.0000247052.18422.e5 17159100
13. Wang Y-L, Wang Y-T, Li J-F, Zhang Y-Z, Yin H-L, Han B. Body mass index and risk of Parkinson’s disease: a dose-response meta-analysis of prospective studies. PLoS ONE. 2015;10(6):e0131778. doi: 10.1371/journal.pone.0131778 26121579
14. Lawlor DA, Harbord RM, Sterne JAC, Timpson N, Davey Smith G. Mendelian randomization: using genes as instruments for making causal inferences in epidemiology. Stat Med. 2008;27 : 1133–63. doi: 10.1002/sim.3034 17886233
15. Noyce AJ, Nalls MA. Mendelian randomization—the key to understanding aspects of Parkinson’s disease causation? Mov Disord. 2015;31 : 478–83. doi: 10.1002/mds.26492 26695521
16. Pierce BL, Burgess S. Efficient design for Mendelian randomization studies: subsample and 2-sample instrumental variable estimators. Am J Epidemiol. 2013;178 : 1177–84. doi: 10.1093/aje/kwt084 23863760
17. Locke AE, Kahali B, Berndt SI, Justice AE, Pers TH, Day FR, et al. Genetic studies of body mass index yield new insights for obesity biology. Nature. 2015;518 : 197–206. doi: 10.1038/nature14177 25673413
18. Nalls MA, Pankratz N, Lill CM, Do CB, Hernandez DG, Saad M, et al. Large-scale meta-analysis of genome-wide association data identifies six new risk loci for Parkinson’s disease. Nat Genet. 2014;46 : 989–93. doi: 10.1038/ng.3043 25064009
19. Johnson T. Efficient calculation for multi-SNP genetic risk scores. Vienna: Comprehensive R Archive Network; 2012 [cited 2016 Aug 1]. Available from: http://cran.r-project.org/web/packages/gtx/vignettes/ashg2012.pdf.
20. Bowden J, Davey Smith G, Burgess S. Mendelian randomization with invalid instruments: effect estimation and bias detection through Egger regression. Int J Epidemiol. 2015;44 : 512–25. doi: 10.1093/ije/dyv080 26050253
21. Brion MJA, Shakhbazov K, Visscher PM. Calculating statistical power in Mendelian randomization studies. Int J Epidemiol. 2013;42 : 1497–501. doi: 10.1093/ije/dyt179 24159078
22. Mayeda ER, Tchetgen EJ, Power MC, Weuve J, Jacqmin-Gadda H, Marden JR, et al. A simulation platform for quanitifying survival bias: an application to research on determinants of cognitive decline. Am J Epidemiol. 2016;184 : 378–87. doi: 10.1093/aje/kwv451 27578690
23. Driver JA, Logroscino G, Gaziano JM, Kurth T. Incidence and remaining lifetime risk of Parkinson disease in advanced age. Neurology. 2009;72 : 432–8. doi: 10.1212/01.wnl.0000341769.50075.bb 19188574
24. Kyrozis A, Ghika A, Stathopoulos P, Vassilopoulos D, Trichopoulos D, Trichopoulou A. Dietary and lifestyle variables in relation to incidence of Parkinson’s disease in Greece. Eur J Epidemiol. 2013;28 : 67–77. doi: 10.1007/s10654-012-9760-0 23377703
25. Driver JA, Smith A, Buring JE, Gaziano JM, Kurth T, Logroscino G. Prospective cohort study of type 2 diabetes and the risk of Parkinson’s disease. Diabetes Care. 2008;31 : 2003–5. doi: 10.2337/dc08-0688 18599528
26. Hsu CL, Voss MW, Best JR, Handy TC, Madden K, Bolandzadeh N, et al. Elevated body mass index and maintenance of cognitive function in late life: exploring underlying neural mechanisms. Front Aging Neurosci. 2015;7 : 155. doi: 10.3389/fnagi.2015.00155 26347646
27. Craft S, Watson GS. Insulin and neurodegenerative disease: shared and specific mechanisms. Lancet Neurol. 2004;3 : 169–78. doi: 10.1016/S1474-4422(04)00681-7 14980532
28. De Pablo-Fernández E, Breen DP, Bouloux PM, Barker RA, Foltynie T, Warner TT. Neuroendocrine abnormalities in Parkinson’s disease. J Neurol Neurosurg Psychiatry. 2017;88(2):176–85. doi: 10.1136/jnnp-2016-314601 27799297
29. Howells DW, Porritt MJ, Wong JYF, Batchelor PE, Kalnins R, Hughes AJ, et al. Reduced BDNF mRNA expression in the Parkinson’s disease substantia nigra. Exp Neurol. 2000;166 : 127–35. doi: 10.1006/exnr.2000.7483 11031089
30. Nagahara AH, Tuszynski MH. Potential therapeutic uses of BDNF in neurological and psychiatric disorders. Nat Rev Drug Discov. 2011;10 : 209–19. doi: 10.1038/nrd3366 21358740
31. BDNF Study Group. A controlled trial of recombinant methionyl human BDNF in ALS: the BDNF Study Group (phase III). Neurology. 1999;52 : 1427–33. 10227630
32. Pickrell AM, Youle RJ. The roles of PINK1, parkin, and mitochondrial fidelity in Parkinson’s disease. Neuron. 2015;85 : 257–73. doi: 10.1016/j.neuron.2014.12.007 25611507
33. Bové J, Martínez-Vicente M, Vila M. Fighting neurodegeneration with rapamycin: mechanistic insights. Nat Rev Neurosci. 2011;12 : 437–52. doi: 10.1038/nrn3068 21772323
34. Xu Q, Park Y, Huang X, Hollenbeck A, Blair A, Schatzkin A, et al. Physical activities and future risk of Parkinson disease. Neurology. 2010;75 : 341–8. doi: 10.1212/WNL.0b013e3181ea1597 20660864
35. Pontzer H, Durazo-Arvizu R, Dugas LR, PLange-Rhule J, Bovet P, Forrester TE, et al. Constrained total energy expenditure and metabolic adaptation to physical activity in adult humans. Curr Biol. 2016;26 : 410–7. doi: 10.1016/j.cub.2015.12.046 26832439
36. Richmond RC, Davey Smith G, Ness AR, den Hoed M, McMahon G, Timpson NJ. Assessing causality in the association between child adiposity and physical activity levels: a Mendelian randomization analysis. PLoS Med. 2014;11(3):e1001618. doi: 10.1371/journal.pmed.1001618 24642734
37. Østergaard SD, Mukherjee S, Sharp SJ, Proitsi P, Lotta LA, Day F, et al. Associations between potentially modifiable risk factors and Alzheimer disease: a Mendelian randomization study. PLoS Med. 2015;12(6):e1001841. doi: 10.1371/journal.pmed.1001841 26079503
38. Lawlor DA. Commentary: two-sample Mendelian randomization: opportunities and challenges. Int J Epidemiol. 2016;43(3):908–15.
39. Tyrrell J, Jones SE, Beaumont R, Astley CM, Lovell R, Yaghootkar H, et al. Height, body mass index, and socioeconomic status: Mendelian randomisation study in UK Biobank. BMJ. 2016;352:i582. doi: 10.1136/bmj.i582 26956984
40. Sudlow C, Gallacher J, Allen N, Beral V, Burton P, Danesh J, et al. UK Biobank: an open access resource for identifying the causes of a wide range of complex diseases of middle and old age. PLoS Med. 2015;12(3):e1001779. doi: 10.1371/journal.pmed.1001779 25826379
41. Lauby-Secretan B, Scoccianti C, Loomis D, Grosse Y, Bianchini F, Straif K, et al. Body fatness and cancer—viewpoint of the IARC working group. N Engl J Med. 2016;375 : 794–8. doi: 10.1056/NEJMsr1606602 27557308
42. Holmes MV, Dale CE, Zuccolo L, Silverwood RJ, Guo Y, Ye Z, et al. Association between alcohol and cardiovascular disease: Mendelian randomisation analysis based on individual participant data. BMJ. 2014;349:g4164. doi: 10.1136/bmj.g4164 25011450
Štítky
Interní lékařstvíČlánek vyšel v časopise
PLOS Medicine
2017 Číslo 6
- Alternativní léčebné možnosti u hypercholesterolemie při intoleranci statinů
- Vliv kombinace nutraceutik na remodelaci levé komory srdeční u osob s metabolickým syndromem
- Nutraceutika a jejich ovlivnění mírného kardiometabolického rizika
- Princip účinku medu v léčbě chronických i infikovaných ran
- Superoxidovaný roztok a jeho využití v léčbě ran
Nejčtenější v tomto čísle
- Mammographic density and ageing: A collaborative pooled analysis of cross-sectional data from 22 countries worldwide
- Vaccination to prevent human papillomavirus infections: From promise to practice
- A Collection on the prevention, diagnosis, and treatment of sexually transmitted infections: Call for research papers
- Elimination of mother-to-child transmission of HIV and Syphilis (EMTCT): Process, progress, and program integration