
Mammographic density and ageing: A collaborative pooled analysis of cross-sectional data from 22 countries worldwide
Valerie McCormack and colleagues reveal reduced breast density with increased age in women from different ethnic groups; however increased breast density in young women is a cancer risk.
Published in the journal:
. PLoS Med 14(6): e32767. doi:10.1371/journal.pmed.1002335
Category:
Research Article
doi:
https://doi.org/10.1371/journal.pmed.1002335
Summary
Valerie McCormack and colleagues reveal reduced breast density with increased age in women from different ethnic groups; however increased breast density in young women is a cancer risk.
Introduction
Mammographic density (MD), a measure of the amount of radiopaque fibroglandular as opposed to fat tissue in the breast, is amongst the strongest of breast cancer risk factors [1–3]. Parallels have been drawn between life-course trajectories of MD and Pike’s model for the rate of breast tissue ageing [1–4]. The latter model hypothesizes that Clemmesen’s hook (the slowing of the rate of increase of age-specific breast cancer incidence rates after menopause, S1 Fig) is due to a reduction in the rate of breast tissue ageing in postmenopausal women [4–6]. MD also declines during the menopausal transition and with ageing; thus, MD may be a tissue-specific marker of the biological processes underlying the rate of breast tissue ageing and, ultimately, the shape of the breast cancer incidence–age curve [2,7,8]. The nature and drivers of the cumulative MD profile thus become of interest to inform which periods in life MD reductions may be best targeted to.
MD associations with ageing have been examined in longitudinal studies [8–12] and inferred from cross-sectional studies [13–15]. Many found non-linear declines with increasing age [8,10–12], often steepest during the perimenopausal period, and some suggested that MD plateaus by age 65 years [11,12]. The majority of these studies were conducted at screening ages (predominantly 50–70 years) and in countries with high breast cancer incidence rates. However, whilst Clemmesen’s hook has been observed in countries spanning the range of breast cancer incidence rates (as shown for selected international populations in S1 Fig), it is not known how MD changes with age in women from countries beyond westernised populations. Studying whether the MD–age association holds internationally will shed light on whether the association is likely to be driven by an intrinsic biology or is a consequence of, or specific to, westernised lifestyles.
The International Consortium on Mammographic Density (ICMD) is an international pooling consortium of cross-sectional individual-level epidemiologic and MD data on over 11,000 breast-cancer-free women from 22 diverse countries. In this consortium, we examined differences in MD by menopausal status and age across 4 decades of life.
Methods
Ethics approvals for ICMD were obtained from the International Agency for Research on Cancer (IEC 12–34). Each individual participating study had received local ethical approval at the time of the original conduct of the study and again to contribute to the consortium.
The ICMD methodology and contributing studies are discussed in detail elsewhere [16]. In brief, the consortium pooled individual-level epidemiologic and MD data on 11,755 women without breast cancer from 27 studies (listed in S1 Text) in 22 countries that span low to high breast cancer incidence rates. To enhance heterogeneity, 7 studies contributed multiple ethnic groups, e.g., Chinese, Malay, and Indian women in both Singapore and Malaysia, totalling 40 ethnicity - and location-specific ‘population groups’. From each population group, we sought to include a random selection of 200 pre - and 200 postmenopausal women aged 35 years or older at the time of mammography. These sample sizes were based on calculations to allow, within each population group and menopause stratum, estimation of mean percent MD (PD) within 1% at a 95% confidence level, assuming a stratum-specific standard deviation (SD) of 7% (for which n = 180). An additional 10% (rounded to n = 20) was added to account for potential later exclusions (e.g., missing data, poor image quality). Population groups were categorised into broad ethnic groups as follows: (i) East Asian (Japanese, Korean, and Chinese), (ii) mestizo (Mexican and Chilean) and Hawaiian, (iii) South Asian (Indian and Malay), (iv) white (European and of European descent), (v) Eastern Mediterranean (Iranian, Turkish, Egyptian, Israeli Arab, and Israeli Jewish) and (vi) black (Kenyan, black South African, and black women in the UK and US). Mammograms were originally taken as part of organised screening (n = 13 studies), opportunistic or community-based screening (n = 8), mammography trials (n = 3), or research (n = 3). We also extracted the best estimate of the age-standardised incidence rate (ASR per 100,000) for breast cancer from Cancer Incidence in Five Continents, GLOBOCAN, or used another estimate [17,18] for each population group. From these ASR estimates, population groups were categorised as originating from a source population with low (ASR < 50), medium (ASR 50–69), or high (ASR ≥ 70) breast cancer incidence rate.
ICMD harmonised data from each study on sociodemographic and lifestyle factors, including height and weight to calculate body mass index (BMI, in kg/m2), ideally obtained at the time of mammography. For menopausal status, study-specific definitions were used, as provided in S1 Table. In brief, postmenopausal at the time of mammography was defined as no longer having menstrual periods (n = 7 studies) or no periods for the past 6 or 12 months (n = 15), self-reported postmenopausal (n = 3), or a combination of age, menstruation, hormone replacement therapy (HRT), and hysterectomy/oophorectomy history (n = 2). Perimenopausal women were excluded from ICMD sample selection in 10 studies, were not defined separately in 13 studies, and were included and categorised separately in 4 studies (2.7% of all women). For consistency, the latter were reclassified as premenopausal for analyses. Menopausal variables were ascertained at or after mammography for 22 studies. For 4 of the remaining studies, menopausal status was assumed not to have changed as it was ascertained less than 1 year before mammography, on average. For 1 study, in which risk factors were ascertained via questionnaire an average of 2.8 years before mammography, a premenopausal woman at the time of the questionnaire was considered postmenopausal at the time of mammography if her age at mammography exceeded the study’s mean age at menopause.
In ICMD, MD was read centrally in Cumulus [19] on digitised film-screen, raw digital, or processed digital images, by 1 of 3 experienced readers (VM, IdSS, NB). For each woman, 1 image (craniocaudal or mediolateral oblique view) was read. Images were randomly allocated to batches, and batches were randomly allocated to readers, as previously described [16]. Readings included 3% within-reader, within-batch repeats and 5% between-reader repeats. MD measures obtained were dense area, non-dense area, and breast area (dense area + non-dense area), all in square centimetres, and PD (PD = 100 × dense area/breast area). PD and dense and non-dense areas that were read on processed images were first corrected to a raw-image equivalent using published equations [20].
After excluding poor-quality images and suspected tumours (n = 288), women with no BMI data (n = 2) or with extreme BMIs (>3.8 SD from her population group mean, n = 42), 11,423 women were included, 11,232 of whom had PD data, 11,375 dense-area readings, and 11,184 non-dense-area and breast-area readings. Differences in the numbers of women with different MD metrics arose because, in some mammograms, dense area could be estimated but the breast edge was not visible (thus PD, non-dense area, and breast area were missing), and, for 78 images from 1 study, PD could be estimated, but uncertainties in the original pixel size prevented the calculation of absolute areas.
Statistical methods
We analysed PD and dense, non-dense, and breast area after square-root transforming each measure to improve normality of residuals. The use of the square-root transformation of MD in regression models means that absolute differences in areas are smaller at the lower end of the PD range. For example, an increase in √PD from 4 to 5 (change in √PD of 1) is, on the original scale, an increase from 42 to 52, or an absolute increase of 9 (from 16 to 25), but the same change in √PD of 1 from 7 to 8 is, on the original scale, an increase from 72 to 82, or an absolute increase of 15 (from 49 to 64). To aid the interpretation on the square-root scale, √MD can be interpreted by considering areas as squares, thus regression model beta-coefficients represent differences in the width, in centimetres, of the side of the square. Similarly, as PD (percent) is the dense area per 100 cm2, √PD is the width of a dense square within a 10 cm × 10 cm square, and therefore beta-coefficients for √PD represent differences in the dense square width, within a 10 cm × 10 cm square.
We examined cross-sectional differences in √MD measures by age and menopausal status using 2 approaches. First, we examined associations by population group and combined estimates using a random effects meta-analysis. Population group estimates were obtained from a multi-level linear regression model to account for repeat MD readings between readers and between batches for the same woman. The percentage of variation in regression estimates across population groups that was due to heterogeneity was examined using the I2 statistic [21], for which percentages of 0%, <30%, 30%–60%, and >60% were roughly considered as no, low, moderate, and large heterogeneity, respectively. Second, we pooled all ICMD data and analysed them in a single model by extending the multi-level model to a third level to account for within-population-group correlations. For both approaches, explanatory variables included fixed effects for the 2 primary variables of interest, age (linear) and menopausal status (binary), as well as BMI (linear + quadratic), ever use of HRT (coded as never, past, current, ever [some studies did not distinguish past and current use], or unknown), parity (continuous), age at first birth (categorical: <20, 20 to <25, 25 to <30, ≥30 years), and reader (categorical). All analyses were based on participants with non-missing data for all variables, as completeness was high (>99%), as per eligibility for inclusion. For pooled analyses (the second approach), factors with between-study variation were additionally adjusted for, i.e., mammogram view and image type. The pooled analysis was also used to examine associations with age in 5-year bands, and linear associations with age were compared to the best-fitting fractional polynomial models.
Interactions of age and menopausal status with demographic and lifestyle factors were tested using likelihood ratio tests. We also examined effect modification by ‘breast area for BMI’, a proxy for a woman’s breast size independent of her BMI, which we generated as the residual of the regression of √breast area on BMI (linear and quadratic terms) and mammography view. Sensitivity analyses excluding women with very early or late menopause, those under 40 or over 70 years, and women with self-reported versus measured BMI were also conducted.
Results
The 11,423 ICMD women ranged in age from 35 to 85 years at mammography, with at least 500 women in each 5-year age category from 35 to 70 (Table 1). Mean age at mammography was 45.6 (SD 4.9) in premenopausal women and 57.5 years (SD 6.4) in the 59% of women who were postmenopausal. East Asian women had both the smallest mean BMI and the smallest mean breast area for BMI (√breast area 0.2 to 1.2 cm smaller than ICMD average) (S2 Fig), and black women had the largest mean breast area for BMI (√breast area 0.5 to 1.3 cm larger than ICMD average). Crude trends for PD and dense area with age were inverse, held across most population groups, and appeared steeper around age 50 years than at either extreme of the age range studied (Figs 1 and S3).


Menopause
Menopausal differences showed no or low inconsistency across population groups for PD (I2 = 16.5%) and dense (I2 = 26.5%), non-dense (I2 = 0%), and breast area (I2 = 0%) (Figs 2A, S4A, S5A and S6A). The combined effect estimates for the menopausal difference showed lower PD and smaller dense area in postmenopausal compared to premenopausal women of the same age, but larger non-dense area and slightly larger breast area. These differences did not differ by ASR category (Fig 2A; p = 0.31 for PD). The findings from the pooled analyses closely matched the meta-analytic results, but confidence intervals (CIs) were narrower (Tables 2 and S2): the √PD difference was −0.46 cm (95% CI: −0.53, −0.39), which was driven by a smaller √dense area (difference −0.55 cm [95% CI: −0.65, −0.45]) and larger √non-dense area (difference +0.32 cm [95% CI: 0.21, 0.43]). However, in contrast to the meta-analysis combined estimate, breast area was not significantly larger in postmenopausal compared to premenopausal women (0.04 cm [95% CI: −0.07, 0.14]) (S2 Table).
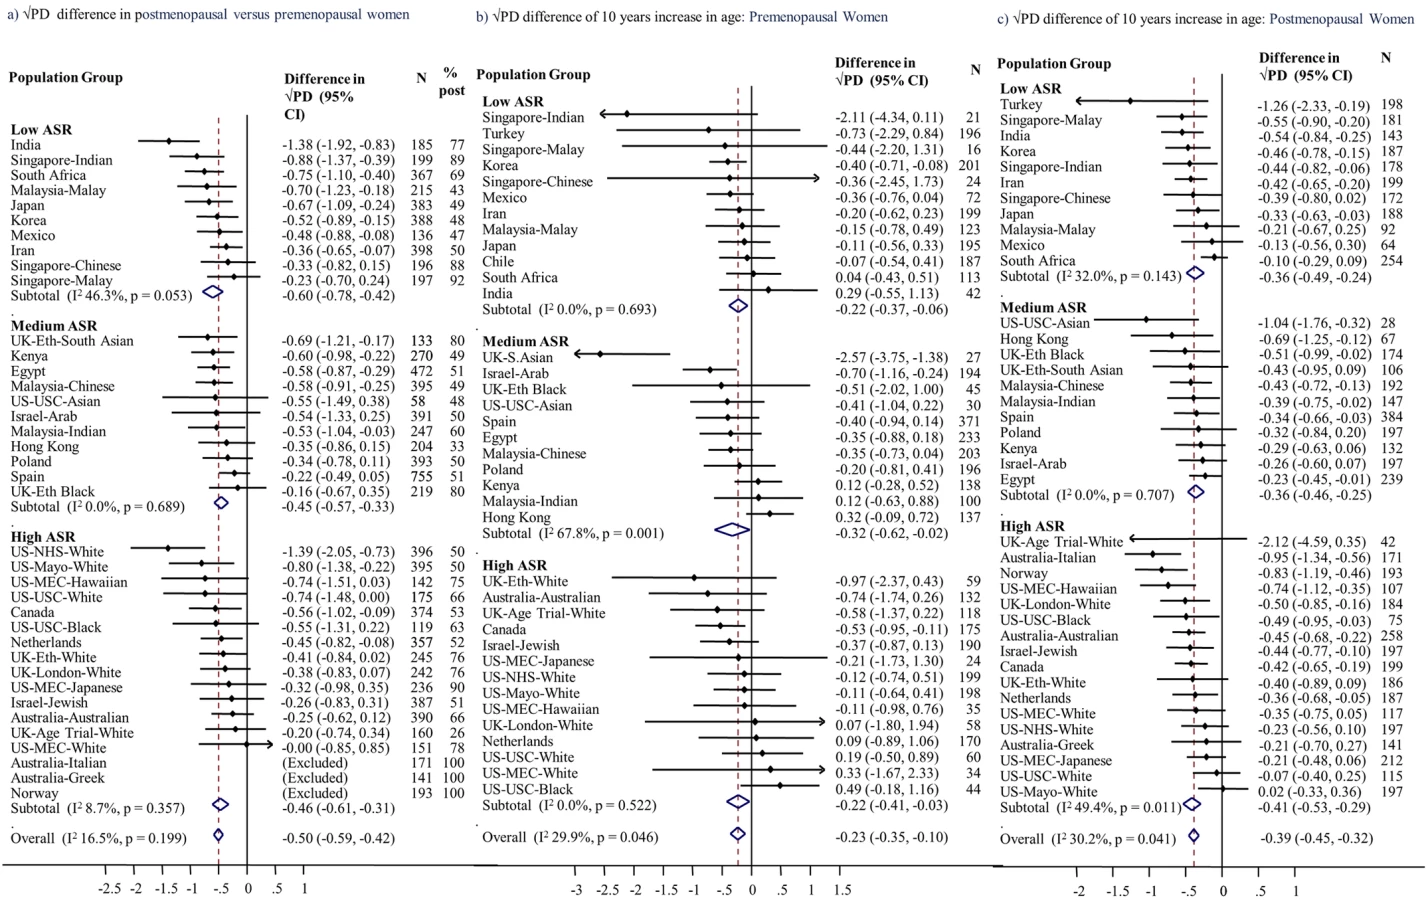

The menopause-associated PD difference held across the subgroups of women examined. Where effect modification was present, the associations differed in magnitude, but not direction (Tables 2 and S2). For PD and dense area, interactions were found with parity, age at first birth, HRT use, BMI, and breast area for BMI (e.g., tests for interaction with PD, p = 0.11, 0.04, 0.08, 0.005, and 0.06, respectively; Table 2), and were independent of each other. The magnitude of the menopause-associated difference in dense area, and consequently in PD, was larger in women with lower breast cancer risk profiles, i.e., larger in women who had had an early age at first birth (difference in √dense area of −0.84 cm if <20 years and −0.30 cm if ≥30 years at first birth; Table 2), in women with higher parity, and in never and past HRT users (and null in current users). Across the broad ethnic groups, menopause–MD associations were of a similar magnitude, except for a larger decline in √PD (−0.75 cm [95% CI: −0.93, −0.57]) in the South Asian and Malay group. For effect modification by BMI, in contrast to the aforementioned interactions, whose effects on PD and dense area were in similar directions, the largest menopause-associated differences in dense area occurred in women with a BMI ≥ 30 kg/m2, whilst these women tended to have the smallest menopause-associated differences in PD (Table 2). Amongst women with a BMI ≥ 35 kg/m2, postmenopausal women had smaller breast areas than premenopausal women, in contrast to findings of no difference in other categories (S2 Table).
Age
Meta-analyses (Fig 2B and 2C) and pooled analyses (Table 3) showed very similar age–MD associations. For a 10-year increase in age, the difference in √PD was −0.24 cm among premenopausal women and −0.38 cm among postmenopausal women (p for interaction by menopausal status = 0.15). These associations reflect similar inverse √dense area–age associations (−0.27 and −0.32 cm for pre - and postmenopausal women). However, whereas in premenopausal women PD differences occurred without a difference in breast area, in postmenopausal women √breast area was 0.34 cm (95% CI: 0.24, 0.39) larger per 10-year age increase (S3 and S4 Tables; S5B and S5C Fig). PD–age associations had low inconsistency across population groups (I2 ~ 30%) and across ASR categories; in postmenopausal women, all point estimates were negative.

Fig 3 shows overall and group-specific fitted associations of MD measures with age, including a main effect of menopausal status and a menopause-by-age interaction term to allow for different age associations (slopes) in pre - and postmenopausal women. Predictions were made by age, assuming premenopausal up to age 50 years and postmenopausal thereafter; thus, the change at age 50 years represents menopausal difference. In contrast to the multiple effect modifiers found for the PD–menopause difference, MD–age associations did not differ substantially between women grouped by most reproductive factors (S3 and S4 Tables; Fig 3). In Fig 3 the few exceptions include a smaller age-associated PD difference in current and ever users of HRT compared to never users (p for interaction = 0.045; S4 Table), which appeared to be driven by a differential association with dense area (p = 0.007) and not with non-dense or breast area (p = 0.46 and 0.23, respectively). Additionally, among premenopausal women, there was some evidence that the inverse √dense area–age association was stronger in nulliparous than parous women (−0.68 versus −0.25 overall, p for interaction = 0.06), and whilst there were no differences by ethnicity in premenopausal women, in postmenopausal women the PD–age slope was shallowest for black women (Fig 3).

Further examination of MD–age associations using the best-fitting flexible fractional polynomials revealed that such non-linear models were not a better fit than the simplest linear models for PD (p = 0.42), dense area (p = 0.90), and breast area (p = 0.09) in premenopausal women and for all 4 MD measures in postmenopausal women (p = 0.23, 0.66, 0.53, and 0.91 for PD, dense, non-dense, and total breast area, respectively), thus suggesting that there is no plateauing of MD within this age range. For non-dense area in premenopausal women, a fractional polynomial model had a better fit than a linear model (p = 0.008), as the positive association with age was not seen until around age 45 years. In sensitivity analyses, the PD–age association in premenopausal women was attenuated from −0.24 to −0.18 if older premenopausal women (>50 years) were excluded, and postmenopausal PD–age associations were stronger (increased from −0.38 to −0.47) when women over age 65 years were excluded (estimates are provided here and do not appear in tables).
Ageing and the menopause
In postmenopausal women, there is sufficient variability in age at menopause (IQR 45 to 52 years) to analyse the impact of age-adjusted years since menopause, which was independently associated with √PD (−0.10 per 10 years [95% CI: −0.17, −0.04]), an effect that was present up to 15 years after menopause (Table 2). After adjusting for years since menopause, the PD–age association reduced from −0.38 to −0.29 per 10 years, but remained significant.
Discussion
Main findings
Across diverse populations of breast-cancer-free women worldwide, we assessed how MD is related to age and menopausal status. Overall, despite inevitable differences between contributing studies, we found consistency in the direction of associations of age and menopausal status with PD and its component tissues across ICMD women. Assuming that inferences from these cross-sectional data reflect within-woman changes, the greatest reduction in MD occurred upon menopausal transition, when dense area declined from a mean of 16.0 to 12.5 cm2, equivalent to 15 to 20 years of ageing. This difference in PD between post - and premenopausal women of the same age was present up to 15 years after the menopause and may be greater in women with lower breast cancer risk profiles (early age at first birth, high parity). PD also decreased with increasing age both among premenopausal and postmenopausal women. In premenopausal women, these declines were entirely due to breast compositional changes, i.e., due to a decline in dense area and an equal but opposite increase in non-dense area. However, in postmenopausal women, PD reductions were also accompanied by increasing breast area and continued beyond 70 years of age.
Comparison to other studies
The large decrease in MD at menopause after adjusting for age is largely consistent with previous observations in westernised countries, either from within-woman or between-woman comparisons [2,8–10,12,15]. Boyd et al. [2] examined differences in breast area before and after menopause and found no significant change, indicating that lower PD after menopause may be due a compositional change alone. Only 1 longitudinal study reported a decline in PD at menopause that was non-significant, although in this study the largest age-related decline did occur around the age of menopause (between ages 45 and 55 years) [11].
Comparisons of age-related changes have been more variable. In ICMD, we found no strong evidence of different PD–age or dense area–age slopes in pre - and postmenopausal women, in agreement with the full longitudinal data from 1 of the ICMD studies, the Melbourne Collaborative Cohort Study/Australian Breast Cancer Family Registry [22], but differing from studies that reported steeper MD declines in either premenopausal [14] or postmenopausal women [9,11]. In addition, there was no strong evidence of non-linear MD–age trends in ICMD, but 3 longitudinal studies have found that PD (and dense area, where examined) declines most rapidly around ages 45 to 55 or 60 years [8,11,12], including the Melbourne study, which also observed a possible plateau after 65 years of age [11,12,22].
Biological plausibility
The remarkable consistency of the age and menopausal effects on MD across diverse female populations spanning all continents suggests that these associations reflect a biological process common to all women. The extent of the decline in MD may be modified by ‘external’ factors, such as reproductive or other lifestyle or environmental factors. These observations lend credibility to the hypothesis that the sharp decline in MD over the menopause is a phenotypic marker of the decline in the rate of breast tissue ageing [4], which results in Clemmesen’s hook in the age–breast cancer incidence curves across the world. However, this simple parallel ignores the well-established molecular and aetiological heterogeneity of breast cancer [5]. Notably, although it has previously been hypothesized that the hormonal drivers of PD would result in it being a stronger risk marker for oestrogen receptor (ER)–positive than ER-negative breast cancer, a large differential in the MD-breast cancer association by tumour subtype does not appear to be present [23]. This finding should perhaps not be surprising, if the menopausal decline in PD, observed universally here, is related to the incidence curves of breast cancer with age, which feature a much stronger menopausal decline in the age-acceleration of incidence rates for ER-negative tumours than for ER-positive tumours [5,24]. At the tissue level, changes involving the dense area arise from changes in stromal tissue and/or in epithelial tissue, whilst changes in PD are additionally affected by changes in adipose tissue in the breast. Declining dense area likely reflects involution of terminal duct lobular units. X-rays of histological tissue show that these units have raised concentrations of radiologically dense areas and that these areas also decline with age [25]. Two additional observations link MD, terminal duct lobular units, and breast cancer risk: breast carcinoma arises within epithelial tissue and the radiologically dense tissue seen on a mammogram [26], and, within cohorts with benign breast disease, greater terminal duct lobular unit involution is predictive of subsequent breast cancer risk [27].
At a systemic level, a hormonal pathway is most certainly implicated in MD changes that occur during the menopausal transition. Several reproductive hormones decline at different stages of the transition [28], some of which may contribute to the MD decline. Combined exogenous oestrogen and progesterone are known to increase PD [29], whilst in premenopausal women, endogenous oestrogen levels are positively associated with PD [30]. The shallower age-related declines in PD in premenopausal women compared to postmenopausal women in our study may reflect similar hormonal pathways. Further, in postmenopausal women only, an increase in breast area also contributed to the decreasing PD. This is likely to reflect a true increase in breast volume as breast area and thickness were positively correlated in ICMD (r = 0.18).
Strengths and limitations
The present study is greatly enhanced by the heterogeneity of the study populations included in ICMD, in terms of a wide range of BMI values, reproductive characteristics, ages (40-year age range), and ethnicities and their associated range of breast sizes and composition, making this, to our knowledge, the largest multi-ethnic, multi-country study of MD to date. The consistent findings are likely to reflect intrinsic biological processes and should therefore apply to the general population of women worldwide. Our separate analyses of tissue components revealed important differences in the drivers of changes in breast tissue composition at different life stages. However, inherent to the consortial nature of ICMD is the fact that we relied on existing data; thus, some sample sizes were smaller, not all studies included women spanning the full age range, and there is variability in image types and exposure variable definitions. Menopause was included as binary variable due to the limitations of the data, but may occur over many months or years. The definition of menopausal status also varied, from simple self-reports to complex algorithms, measured at or some time before or after mammography. Potential misclassification bias might attenuate the estimate of the menopausal effect but is unlikely to affect within-population group estimates of the menopause difference. Additionally, including some perimenopausal women would also underestimate a menopausal effect. In the 31% of women with self-reported anthropometry, possible underreporting of weight and overestimation of height, particularly in older women, would lead to an underestimation of BMI [31]; thus, part of the increase of breast area postmenopausally may be due to incomplete adjustment for BMI. In addition, the validity of BMI as a measure of total body adiposity across such diverse populations is uncertain.
Women in ICMD were recruited from a range of settings, including some that were not population-based screening; thus, there is likely an overrepresentation of symptomatic or high-risk women. Nevertheless, the present findings rely on the representativeness of the associations and not of the sample populations; thus, any lack of representativeness of study populations would affect results only if there was an age-related pattern to representativeness. In a similar manner, cross-sectional associations may only partially reflect within-woman changes, as birth cohort effects on MD, through factors unadjusted for, may confound associations. These findings should be verified with longitudinal data in which within-woman changes can be examined.
Implications
There are broader implications of the profile of MD with ageing. Similar to the reduced sensitivity of mammography in younger women than in older women in organised screening programs [32], because of the former group’s higher average breast density, this problem is also likely to affect the performance of mammography as part of the diagnostic work-up of symptomatic breast cancers. Low - and middle-income countries may be disproportionately affected by this issue, because of the young population structures and thus younger average age at breast cancer diagnosis. Further, if MD reflects the rate of breast tissue ageing, the parallel to Pike’s model suggests that cumulative MD to a given age is the pertinent marker of breast cancer risk. Indeed, cumulative density has been shown to be highly correlated with age-related breast cancer risk [11], and women whose MD decreases substantially over time may be at lower risk of breast cancer than those who maintain the same density [10,33]. More efficient and cost-effective stratified approaches to population-based breast cancer screening using MD-based risk scores have been suggested [34]. Placing a woman in a particular MD-based risk stratum would be aided by the fact that MD displays a high level of tracking within a woman over time, at least postmenopausally [12], but it is not known whether risk predictions might be improved if earlier life periods, before MD tracking is established, were included.
Finally, based on the current findings that MD is in general highest earlier in life, primary prevention efforts might best be targeted to younger ages, reducing breast density earlier in life, leading to a lower cumulative MD across life. Studies of breast density in girls or younger women that use MRI or dual-energy X-ray absorptiometry (DXA) imaging are fewer. They have found suggestions of increased breast density associated with greater birth size [35], duration of use of hormonal contraceptives [36], higher testosterone levels [37], and lower childhood BMI, independent of current BMI [38]. At adult ages, the potential actions needed to lower breast density for a reduction in breast cancer risk, apart from the known pregnancy-associated effects, include lowering alcohol intake [39], whilst the protective effect of physical activity does not appear to be mediated through MD [40]. Further, in high-risk women and in women with ductal carcinoma in situ, tamoxifen reduces breast cancer risk through a reduction in MD [41]. Given the relatively low uptake of such oral chemoprevention therapies, other risk-lowering options for women with high breast cancer risk and raised MD may come from the ongoing trials of oral low dose and topical tamoxifen [42]. The consistency of the MD–ageing associations internationally is suggestive of an intrinsic shared biology, which might also extend to other modifiable determinants of MD.
Supporting Information
Zdroje
1. Boyd NF, Rommens JM, Vogt K, Lee V, Hopper JL, Yaffe MJ, et al. Mammographic breast density as an intermediate phenotype for breast cancer. Lancet Oncol. 2005;6(10):798–808. doi: 10.1016/S1470-2045(05)70390-9 16198986
2. Boyd N, Martin L, Stone J, Little L, Minkin S, Yaffe M. A longitudinal study of the effects of menopause on mammographic features. Cancer Epidemiol Biomarkers Prev. 2002;11(10 Pt 1):1048–53. 12376506
3. McCormack VA, dos Santos Silva I. Breast density and parenchymal patterns as markers of breast cancer risk: a meta-analysis. Cancer Epidemiol Biomarkers Prev. 2006;15(6):1159–69. doi: 10.1158/1055-9965.EPI-06-0034 16775176
4. Pike MC, Krailo MD, Henderson BE, Casagrande JT, Hoel DG. ‘Hormonal’ risk factors, ‘breast tissue age’ and the age-incidence of breast cancer. Nature. 1983;303(5920):767–70. 6866078
5. Anderson WF, Matsuno R. Breast cancer heterogeneity: a mixture of at least two main types? J Natl Cancer Inst. 2006;98(14):948–51. doi: 10.1093/jnci/djj295 16849671
6. Clemmesen J. Carcinoma of the breast; results from statistical research. Br J Radiol. 1948;21(252):583–90. 18099749
7. Butler LM, Gold EB, Greendale GA, Crandall CJ, Modugno F, Oestreicher N, et al. Menstrual and reproductive factors in relation to mammographic density: the Study of Women’s Health Across the Nation (SWAN). Breast Cancer Res Treat. 2008;112(1):165–74. doi: 10.1007/s10549-007-9840-0 18066689
8. Kelemen LE, Pankratz VS, Sellers TA, Brandt KR, Wang A, Janney C, et al. Age-specific trends in mammographic density: the Minnesota Breast Cancer Family Study. Am J Epidemiol. 2008;167(9):1027–36. doi: 10.1093/aje/kwn063 18385204
9. Busana MC, De Stavola BL, Sovio U, Li J, Moss S, Humphreys K, et al. Assessing within-woman changes in mammographic density: a comparison of fully versus semi-automated area-based approaches. Cancer Causes Control. 2016;27(4):481–91. doi: 10.1007/s10552-016-0722-9 26847236
10. Lokate M, Stellato RK, Veldhuis WB, Peeters PH, van Gils CH. Age-related changes in mammographic density and breast cancer risk. Am J Epidemiol. 2013;178(1):101–9. doi: 10.1093/aje/kws446 23703889
11. Maskarinec G, Pagano I, Lurie G, Kolonel LN. A longitudinal investigation of mammographic density: the multiethnic cohort. Cancer Epidemiol Biomarkers Prev. 2006;15(4):732–9. doi: 10.1158/1055-9965.EPI-05-0798 16614116
12. McCormack VA, Perry NM, Vinnicombe SJ, Dos Santos Silva I. Changes and tracking of mammographic density in relation to Pike’s model of breast tissue aging: a UK longitudinal study. Int J Cancer. 2010;127(2):452–61. doi: 10.1002/ijc.25053 19924817
13. Maskarinec G, Nagata C, Shimizu H, Kashiki Y. Comparison of mammographic densities and their determinants in women from Japan and Hawaii. Int J Cancer. 2002;102(1):29–33. doi: 10.1002/ijc.10673 12353230
14. Rice MS, Bertrand KA, Lajous M, Tamimi RM, Torres G, Lopez-Ridaura R, et al. Reproductive and lifestyle risk factors and mammographic density in Mexican women. Ann Epidemiol. 2015;25(11):868–73. doi: 10.1016/j.annepidem.2015.08.006 26475982
15. Stone J, Warren RM, Pinney E, Warwick J, Cuzick J. Determinants of percentage and area measures of mammographic density. Am J Epidemiol. 2009;170(12):1571–8. doi: 10.1093/aje/kwp313 19910376
16. McCormack VA, Burton A, dos-Santos-Silva I, Hipwell JH, Dickens C, Salem D, et al. International Consortium on Mammographic Density: methodology and population diversity captured across 22 countries. Cancer Epidemiol. 2016;40 : 141–51. doi: 10.1016/j.canep.2015.11.015 26724463
17. Ferlay J, Soerjomataram I, Dikshit R, Eser S, Mathers C, Rebelo M, et al. Cancer incidence and mortality worldwide: sources, methods and major patterns in GLOBOCAN 2012. Int J Cancer. 2015;136(5):E359–86. doi: 10.1002/ijc.29210 25220842
18. Ibrahim AS, Khaled HM, Mikhail NN, Baraka H, Kamel H. Cancer incidence in Egypt: results of the national population-based cancer registry program. J Cancer Epidemiol. 2014;2014 : 437971. doi: 10.1155/2014/437971 25328522
19. Byng JW, Boyd NF, Fishell E, Jong RA, Yaffe MJ. The quantitative analysis of mammographic densities. Phys Med Biol. 1994;39(10):1629–38. 15551535
20. Burton A, Byrnes G, Stone J, Tamimi RM, Heine J, Vachon C, et al. Mammographic density assessed on paired raw and processed digital images and on paired screen-film and digital images across three mammography systems. Breast Cancer Res. 2016;18(1):130. doi: 10.1186/s13058-016-0787-0 27993168
21. Higgins JP, Thompson SG, Deeks JJ, Altman DG. Measuring inconsistency in meta-analyses. BMJ. 2003;327(7414):557–60. doi: 10.1136/bmj.327.7414.557 12958120
22. Krishnan K, Baglietto L, Stone J, Simpson JA, Severi G, Evans CF, et al. Longitudinal study of mammographic density measures that predict breast cancer risk. Cancer Epidemiol Biomarkers Prev. 2017;26(4):651–60. doi: 10.1158/1055-9965.EPI-16-0499 28062399
23. Antoni S, Sasco AJ, dos Santos Silva I, McCormack V. Is mammographic density differentially associated with breast cancer according to receptor status? A meta-analysis. Breast Cancer Res Treat. 2013;137(2):337–47. doi: 10.1007/s10549-012-2362-4 23239150
24. Dickens C, Duarte R, Zietsman A, Cubasch H, Kellett P, Schuz J, et al. Racial comparison of receptor-defined breast cancer in Southern African women: subtype prevalence and age-incidence analysis of nationwide cancer registry data. Cancer Epidemiol Biomarkers Prev. 2014;23(11):2311–21. doi: 10.1158/1055-9965.EPI-14-0603 25143359
25. Gierach GL, Patel DA, Pfeiffer RM, Figueroa JD, Linville L, Papathomas D, et al. Relationship of terminal duct lobular unit involution of the breast with area and volume mammographic densities. Cancer Prev Res (Phila). 2016;9(2):149–58.
26. Pinto Pereira SM, McCormack VA, Hipwell JH, Record C, Wilkinson LS, Moss SM, et al. Localized fibroglandular tissue as a predictor of future tumor location within the breast. Cancer Epidemiol Biomarkers Prev. 2011;20(8):1718–25. doi: 10.1158/1055-9965.EPI-11-0423 21693627
27. Figueroa JD, Pfeiffer RM, Brinton LA, Palakal MM, Degnim AC, Radisky D, et al. Standardized measures of lobular involution and subsequent breast cancer risk among women with benign breast disease: a nested case-control study. Breast Cancer Res Treat. 2016;159(1):163–72. doi: 10.1007/s10549-016-3908-7 27488681
28. Burger HG, Hale GE, Dennerstein L, Robertson DM. Cycle and hormone changes during perimenopause: the key role of ovarian function. Menopause. 2008;15(4 Pt 1):603–12. doi: 10.1097/gme.0b013e318174ea4d 18574431
29. Greendale GA, Reboussin BA, Slone S, Wasilauskas C, Pike MC, Ursin G. Postmenopausal hormone therapy and change in mammographic density. J Natl Cancer Inst. 2003;95(1):30–7. 12509398
30. Walker K, Fletcher O, Johnson N, Coupland B, McCormack VA, Folkerd E, et al. Premenopausal mammographic density in relation to cyclic variations in endogenous sex hormone levels, prolactin, and insulin-like growth factors. Cancer Res. 2009;69(16):6490–9. doi: 10.1158/0008-5472.CAN-09-0280 19679547
31. Spencer EA, Appleby PN, Davey GK, Key TJ. Validity of self-reported height and weight in 4808 EPIC-Oxford participants. Public Health Nutr. 2002;5(4):561–5. doi: 10.1079/PHN2001322 12186665
32. Boyd NF, Guo H, Martin LJ, Sun L, Stone J, Fishell E, et al. Mammographic density and the risk and detection of breast cancer. N Engl J Med. 2007;356(3):227–36. doi: 10.1056/NEJMoa062790 17229950
33. Kerlikowske K, Ichikawa L, Miglioretti DL, Buist DS, Vacek PM, Smith-Bindman R, et al. Longitudinal measurement of clinical mammographic breast density to improve estimation of breast cancer risk. J Natl Cancer Inst. 2007;99(5):386–95. doi: 10.1093/jnci/djk066 17341730
34. Schousboe JT, Kerlikowske K, Loh A, Cummings SR. Personalizing mammography by breast density and other risk factors for breast cancer: analysis of health benefits and cost-effectiveness. Ann Intern Med. 2011;155(1):10–20. doi: 10.7326/0003-4819-155-1-201107050-00003 21727289
35. Denholm R, De Stavola B, Hipwell JH, Doran SJ, Busana MC, Eng A, et al. Pre-natal exposures and breast tissue composition: findings from a British pre-birth cohort of young women and a systematic review. Breast Cancer Res. 2016;18(1):102. doi: 10.1186/s13058-016-0751-z 27729066
36. Dorgan JF, Klifa C, Deshmukh S, Egleston BL, Shepherd JA, Kwiterovich PO Jr, et al. Menstrual and reproductive characteristics and breast density in young women. Cancer Causes Control. 2013;24(11):1973–83. doi: 10.1007/s10552-013-0273-2 23933948
37. Jung S, Stanczyk FZ, Egleston BL, Snetselaar LG, Stevens VJ, Shepherd JA, et al. Endogenous sex hormones and breast density in young women. Cancer Epidemiol Biomarkers Prev. 2015;24(2):369–78. doi: 10.1158/1055-9965.EPI-14-0939 25371447
38. Pettee Gabriel K, Klifa C, Perez A, Kriska AM, High RR, Snetselaar L, et al. Adolescent and young adult exposure to physical activity and breast density. Med Sci Sports Exerc. 2013;45(8):1515–23. doi: 10.1249/MSS.0b013e318289a7f8 23377838
39. Ziembicki S, Zhu J, Tse E, Martin LJ, Minkin S, Boyd NF. The association between alcohol consumption and breast density: a systematic review and meta-analysis. Cancer Epidemiol Biomarkers Prev. 2017;26(2):170–8. doi: 10.1158/1055-9965.EPI-16-0522 27672053
40. Yaghjyan L, Colditz GA, Wolin K. Physical activity and mammographic breast density: a systematic review. Breast Cancer Res Treat. 2012;135(2):367–80. doi: 10.1007/s10549-012-2152-z 22814722
41. Cuzick J, Warwick J, Pinney E, Duffy SW, Cawthorn S, Howell A, et al. Tamoxifen-induced reduction in mammographic density and breast cancer risk reduction: a nested case-control study. J Natl Cancer Inst. 2011;103(9):744–52. doi: 10.1093/jnci/djr079 21483019
42. Lazzeroni M, Serrano D, Dunn BK, Heckman-Stoddard BM, Lee O, Khan S, et al. Oral low dose and topical tamoxifen for breast cancer prevention: modern approaches for an old drug. Breast Cancer Res. 2012;14(5):214. doi: 10.1186/bcr3233 23106852
Štítky
Interní lékařstvíČlánek vyšel v časopise
PLOS Medicine
2017 Číslo 6
- Alternativní léčebné možnosti u hypercholesterolemie při intoleranci statinů
- Vliv kombinace nutraceutik na remodelaci levé komory srdeční u osob s metabolickým syndromem
- Nutraceutika a jejich ovlivnění mírného kardiometabolického rizika
- Princip účinku medu v léčbě chronických i infikovaných ran
- Superoxidovaný roztok a jeho využití v léčbě ran
Nejčtenější v tomto čísle
- Mammographic density and ageing: A collaborative pooled analysis of cross-sectional data from 22 countries worldwide
- Vaccination to prevent human papillomavirus infections: From promise to practice
- A Collection on the prevention, diagnosis, and treatment of sexually transmitted infections: Call for research papers
- Elimination of mother-to-child transmission of HIV and Syphilis (EMTCT): Process, progress, and program integration