
Prevalence of sexually transmitted infections and bacterial vaginosis among women in sub-Saharan Africa: An individual participant data meta-analysis of 18 HIV prevention studies
In a meta-analysis of observational studies and randomized trials, Elizabeth A. Torrone and colleagues provide estimates of STI and BV prevalence among populations of sub-Saharan African women.
Published in the journal:
. PLoS Med 15(2): e32767. doi:10.1371/journal.pmed.1002511
Category:
Research Article
doi:
https://doi.org/10.1371/journal.pmed.1002511
Summary
In a meta-analysis of observational studies and randomized trials, Elizabeth A. Torrone and colleagues provide estimates of STI and BV prevalence among populations of sub-Saharan African women.
Introduction
Sexually transmitted infections (STIs) and bacterial vaginosis (BV) are widespread globally. These conditions have important sexual, reproductive, and maternal-child health consequences, including genital symptoms, pregnancy complications, infertility, enhanced HIV transmission, and psychosocial effects. The World Health Organization (WHO) estimated that, in 2012, there were 357 million new episodes of 4 curable STIs (chlamydia, gonorrhea, syphilis, and trichomoniasis) [1] and 417 million people had infection with herpes simplex virus type 2 (HSV-2) [2]. Global estimates of BV occurrence are limited [3].
The WHO Global Health Sector Strategy on Sexually Transmitted Infections 2016–2021 (Global Strategy), provides goals, targets, and priority actions for stemming the STI epidemic [4]. As data on STI burden are critical for efforts to prevent, control, and manage STIs, the first strategic direction of the Global Strategy is to increase information, including STI prevalence estimates, for focused public health action. Estimating the global burden of STIs is hampered by the limited availability of STI diagnostic testing and surveillance and a paucity of high-quality published studies of STI prevalence in low - and middle-income countries (LMICs), for both general and key populations. Given these limitations, a WHO Consultation on Methods for Improved Global STI Estimates highlighted the importance of exploring potential data available through clinical research studies and trial networks to improve estimates [5], because many studies gather baseline data on STIs, even when estimating STI prevalence is not a primary study objective.
In one collection of such studies, investigators used combined data from 18 prospective HIV prevention studies in sub-Saharan Africa in an individual participant data (IPD) meta-analysis to examine the association between hormonal contraceptive (HC) use and HIV acquisition [6]. Although the main objective of these studies was not to estimate STI/BV prevalence, all of them captured information on at least some STIs or BV. The 18 studies in the HC-HIV IPD dataset include more than 37,000 women in 9 countries in sub-Saharan Africa [7–33] and present a unique opportunity to explore prevalence of selected sexually transmitted and reproductive tract infections.
In the current study, we used IPD meta-analysis to estimate the prevalence of selected STIs and BV, and the prevalence of co-infections, among women in sub-Saharan Africa participating in these 18 studies. We selected STIs included in the majority of the studies (chlamydia, gonorrhea, trichomoniasis, syphilis, and HSV-2), and present STI/BV prevalence by age, region, and population type.
Methods
We followed a protocol and a prespecified analysis plan (S3 Text). We report our findings in accordance with the Preferred Reporting Items for Systematic Reviews and Meta-Analyses (PRISMA) (S1 Text) and provide a checklist of items specific to IPD meta-analyses (S2 Text). PRISMA checklists for previous IPD analyses of these data are also available [6,34]. The US Centers for Disease Control and Prevention, WHO, and the Protection of Human Subjects Committee of FHI 360 determined that the research was exempt from ethical review. All included studies had relevant country-specific institutional ethical review and regulatory board approvals, and all participants within each study provided written informed consent for study participation. All principal investigators agreed to share their data for the present meta-analysis.
Study eligibility and inclusion criteria
The collection of studies included in the current analysis started as the Vaginal Practices Research Partnership, in which investigators combined data from 10 cohort studies and HIV prevention trials in sub-Saharan Africa in an IPD meta-analysis to examine associations of women’s intravaginal practices and acquisition of HIV [34]. Data from 8 additional studies were then added for the evaluation of the association between HC and HIV acquisition [6]. The final 18 studies in the HC-HIV IPD meta-analysis included HIV-negative women recruited from general populations and groups of women identified to be at higher-risk of HIV infection, such as women engaging in transactional sex. Women were not randomly sampled. Initial inclusion and exclusion criteria for the IPD meta-analysis of HC and HIV acquisition are listed in S1 Table. In general, studies had to include women between the ages of 15 and 49 years, measure HIV prospectively at multiple time points, and measure HC use.
To minimize the risk of measurement bias, additional inclusion criteria for the current IPD meta-analysis to estimate STI/BV prevalence were applied separately for chlamydia, gonorrhea, trichomoniasis, syphilis, HSV-2, and BV. To be included, the study had to have (1) measured the STI/BV at baseline as part of its protocol, (2) provided information about both the diagnostic test and the test result, and (3) tested at least 80% of all participants in the study for the STI/BV or tested at least 80% of a randomly selected sample of enrolled participants. Studies were excluded from prevalence estimation for a specific STI/BV if (1) the study design required the STI/BV diagnosis in question for study inclusion (e.g., participants required to be HSV-2 antibody positive) or (2) >10% of those tested for the STI/BV had indeterminate test results.
Data collection, data management, and data items
The investigators of each eligible study gave us permission to use their data in the STI meta-analysis. We included variables at both study and individual level. Study-level variables included country, study design, population types, study aims, recruitment period, and diagnostic procedures. Individual-level variables included sociodemographic variables (age, education, marital status, employment status, number of live births) and sexual behavior variables (condom use at last sex, age at first sex, coital frequency, number of lifetime partners, new partners, concurrent partners, and contraceptive use). The study team worked closely with the data managers and investigators of the individual studies to clarify issues about variable definition and missing, incomplete, or implausible data.
Definition of prevalent STI or BV
Prevalent STI was defined, based on the baseline study visit, as a positive test result by prespecified tests for each pathogen: Chlamydia trachomatis (chlamydia)—nucleic acid amplification test (NAAT), enzyme immunoassay (EIA) test, or hybrid capture test; Neisseria gonorrhoeae (gonorrhea)—NAAT or culture; Trichomonas vaginalis (trichomoniasis)—NAAT, InPouch (BioMed Diagnostics, White City, OR) culture, or wet mount; HSV-2 infection—type-specific serologic test; Treponema pallidum (syphilis)—any rapid plasma reagin (RPR) and a treponemal test (Treponema pallidum hemagglutination assay [TPHA], Treponema pallidum particle agglutination assay [TPPA], or Determine Rapid Syphilis TP Assay [Abbott Laboratories, Tokyo, Japan]). A subset of studies recorded RPR titer, and for these studies, we defined high-titer, active syphilis as an RPR titer ≥ 1 : 8 and a positive treponemal test [35]. Prevalent BV diagnosis was based on Nugent score ≥ 7 or Ison-Hay grade ≥ grade III.
Stratification of prevalence estimates
We initially selected 5 factors likely to influence STI/BV prevalence for stratification: participant age, region, population type, time period, and pregnancy status. After preliminary examination of the available data, we stratified prevalence estimates only by participant age, region, and study population type. We decided not to stratify studies by time period or pregnancy status given limited sample size.
We categorized age as 15–24 years or 25–49 years, according to individual participant age at the baseline visit. We defined 3 regions (based on geographical location of the study): South Africa, Eastern Africa (Kenya, Uganda, Tanzania, Rwanda), and Southern Africa (Zambia, Zimbabwe, Malawi, Botswana). Studies that were conducted in more than 1 region were split into sub-studies that included only a single region. We defined 3 study population types (based on enrollment and inclusion criteria for each study): clinic/community-based populations, higher-risk populations, and HIV-discordant couples. Clinics were family planning and reproductive health clinics and enrolled women regardless of symptom status. Community-based settings included enrollment at community meetings or house-to-house visits. Higher-risk populations included studies where participants were recruited from bars or other recreational facilities like guesthouses and hotels that were considered high-risk venues for acquiring HIV infection, or were recruited because they engaged in transactional sex. Studies of HIV-discordant couples included the HIV-negative partners of HIV-discordant partnerships. Studies that included participants from multiple population types were split into multiple sub-studies for analysis.
Analysis
Descriptive analysis
Participant characteristics (sociodemographic characteristics, risk behaviors, etc.) were compared across the strata of participant age, region, and population type.
Prevalence estimation and meta-analysis
Using individual-level participant data, we used 2-stage meta-analysis to derive summary estimates of the mean prevalence of each infection according to the prespecified strata of age group, region, and study population type. In the first stage, we used the data from participants in each individual study to obtain the proportion infected and standard error on the logit scale. Some strata contained 1 or more studies with 0 infections, for which the logarithm is undefined. For all studies in these strata, we used the observed proportion and estimated the standard error using the exact binomial confidence limits. In the second stage, we used a random-effects model to pool the log odds of infection across studies, weighted by the variability of the estimate of the individual studies. The pooled log odds and 95% confidence interval (CI) were then transformed to obtain summary prevalence estimates on the natural scale. We generated forest plots in R and inspected them visually to compare prevalence estimates across strata, and combined strata if estimates were similar. We used the I2 statistic to describe the percentage of variability in prevalence estimates resulting from between-study heterogeneity rather than sampling error. We applied approximate categories of I2 values to determine low heterogeneity (I2 < 50%), mild or moderate heterogeneity (I2 from 50% to 75%), and high heterogeneity (I2 > 75%) and used these categories in the interpretation of summary estimates of prevalence [36].
Prevalence of co-infection
We investigated the prevalence of co-infection among women tested for each combination of infections (e.g., tested for both HSV-2 and gonorrhea). For each infection, we estimated the prevalence of co-infection with an additional infection (e.g., among women with HSV-2, the prevalence of gonorrhea) among women tested for both infections. Co-infection prevalence was estimated for each stratum using the methods described above.
Results
All 18 potentially eligible studies included testing for at least 1 STI and/or BV testing at baseline. Test technologies varied across studies (S2 Table). Five studies included multiple geographic regions and/or population types and were split into separate sub-studies for analysis, resulting in a total of 26 studies/sub-studies (hereafter referred to as “studies”) (Table 1). There were 10 studies in South Africa that were conducted among clinic/community-based populations (N = 9) and HIV-discordant couples (N = 1). Nine studies were conducted in Southern Africa (N = 5) or Eastern Africa (N = 4) among clinic/community-based populations (N = 7) and HIV-discordant couples (N = 2). Seven studies were conducted in Eastern Africa among higher-risk populations. Sample sizes of included studies ranged from 138 to 5,654.

Prevalence estimates from studies of HIV-discordant couples were similar to those from studies of clinic/community-based populations, so we combined these population types (subsequently referred to as “clinic/community-based studies”). In addition, prevalence estimates from clinic/community-based studies in Southern and Eastern Africa were similar, and these groups were combined (subsequently referred to as “Southern/Eastern Africa”). Our main results are presented by age group (15–24 and 25–49 years) for South African clinic/community-based populations, Southern/Eastern African clinic/community-based populations, and Eastern African higher-risk populations. Participant characteristics and STI/BV prevalence estimates according to the initial stratification variables for age, region, and population type are shown in S3 Table and S1–S8, S11–S18 Figs.
Participant characteristics
Among 15–24-year-old participants, sociodemographics varied across the 3 region/population types (Table 2). For example, among participants recruited from clinic/community settings, participants in studies from South Africa were more likely to be unmarried (92.1%) compared with participants in studies in Southern/Eastern Africa (14.3%). As expected, participants in Eastern Africa higher-risk population studies were more likely to be sex workers and to report 2 or more recent sex partners compared with participants in clinic/community-based studies. Among 25–49-year-old participants, there were similar differences in sociodemographics and sexual behaviors across the 3 region/population types (Table 3).


Prevalence estimates
Chlamydia
Among women aged 15–24 years in clinic/community-based populations in South Africa, estimated chlamydia prevalence ranged from 8.0% to 20.6% (summary estimate: 15.1% [95% CI: 12.7%, 17.8%]; I2 = 82.3%), which was similar to estimated prevalence in the higher-risk populations in Eastern Africa, which ranged from 5.0% to 15.8% (summary estimate: 10.3% [95% CI: 7.4%, 14.1%]; I2 = 75.7%) (Fig 1). Prevalence was lower in the clinic/community-based populations in Southern/Eastern Africa, with a summary average estimate of 2.7% (95% CI: 1.5%, 3.9%; I2 = 81.1%).

Summary estimates of chlamydia prevalence were lower among women aged 25–49 years than among women aged 15–24 years in all region/population types (Fig 2). In the clinic/community-based populations in Southern/Eastern Africa, the summary estimate of prevalence among 25–49-year-old women was 1.2% (95% CI: 0.8%, 1.7%; I2 = 61.7%). In the higher-risk populations in Eastern Africa, the summary estimate of prevalence was 6.2% (95% CI: 4.7%, 8.2%; I2 = 73.4%).

Gonorrhea
For women aged 15–24 years in clinic/community-based populations in South Africa, estimates of gonorrhea prevalence ranged from 1.4% to 8.9% in individual studies, and the summary estimate was 4.6% (95% CI: 3.3%, 6.4%; I2 = 82.8%) (Fig 3). The summary estimate of gonorrhea prevalence in clinic/community-based populations in Southern/Eastern Africa was 1.7% (95% CI: 1.2%, 2.6%; I2 = 55.2%). In the higher-risk populations in Eastern Africa, estimates in individual studies ranged from 5.2% to 15.2%, with a summary estimate of 8.2% (95% CI: 5.8%, 11.6%; I2 = 80.7%). As for chlamydia, prevalence of gonorrhea among women aged 25–49 years was generally lower than among women aged 15–24 years across all strata, and heterogeneity in all strata was high (Fig 4).


Syphilis, overall (high, low, and unknown titer infection)
Among 15–24-year-old women, the summary estimate of syphilis prevalence overall (i.e., proportion of participants with a positive RPR and positive treponemal test) was less than 2% in clinic/community populations in both South Africa (1.5% [95% CI: 1.0%, 2.2%]; I2 = 57.7%) and Southern/Eastern Africa (1.4% [95% CI: 1.0%, 1.9%]; I2 = 25.8%), and higher among higher-risk populations in Eastern Africa (8.4% [95% CI: 6.8%, 10.3%]; I2 = 46.3%) (Fig 5).

Among 25–49-year-olds in clinic/community populations in South Africa, the summary estimate of syphilis prevalence overall among 25–49-year-old women (4.3% [95% CI: 2.5%, 7.2%]; I2 = 94.8%) was higher than that among younger women (1.5%) (Fig 6). In clinic/community populations in Southern/Eastern Africa, the summary estimate of syphilis prevalence overall (2.0% [95% CI: 1.4%, 2.6%]; I2 = 61.8%) was similar to the summary estimate among younger women (1.4%). In the higher-risk populations in Eastern Africa, the summary estimate among older women (7.5% [95% CI: 5.5%, 10.1%]; I2 = 85.8%) was similar to prevalence among younger women (8.4%).

Syphilis, high-titer infection
Among 15–24-year-olds, the prevalence of high-titer, active infectious syphilis (i.e., participants with an RPR titer ≥ 1 : 8 and a positive treponemal test, among those with RPR titers) mirrored that of overall syphilis, but with low or no between-study heterogeneity (Fig 7). The summary estimate of prevalence in clinic/community populations in South Africa was 0.4% (95% CI: 0.3%, 0.5%; I2 = 0%) and in Southern/Eastern Africa was 1.1% (95% CI: 0.3%, 1.9%; I2 = 42.5%). Among higher-risk populations in Eastern Africa, the summary estimate was 4.5% (95% CI: 3.6%, 5.5%; I2 = 0%). Point estimates for women aged 25–49 years were similar to those in younger populations, but were more heterogeneous (Fig 8).


The 17 studies included in the estimation of high-titer, active infectious syphilis prevalence are a subgroup of the studies included in the estimation of overall syphilis prevalence; summary estimates of overall syphilis prevalence limited to these 17 studies are provided in S9 and S10 Figs.
Trichomoniasis
For both age groups, there was high heterogeneity in estimates of trichomoniasis prevalence across all strata (Figs 9 and 10). For example, among 15–24-year-olds in higher-risk populations in Eastern Africa, estimates ranged from 6.6% to 29.7% (summary estimate: 12.7% [95% CI: 7.5%, 20.6%]; I2 = 93.1%), and among 25–29-year-olds in the South African clinic/community-based populations, estimates ranged from 1.9% to 28.6% (summary estimate: 8.6% [95% CI: 6.5%, 11.5%]; I2 = 95.2%).


HSV-2
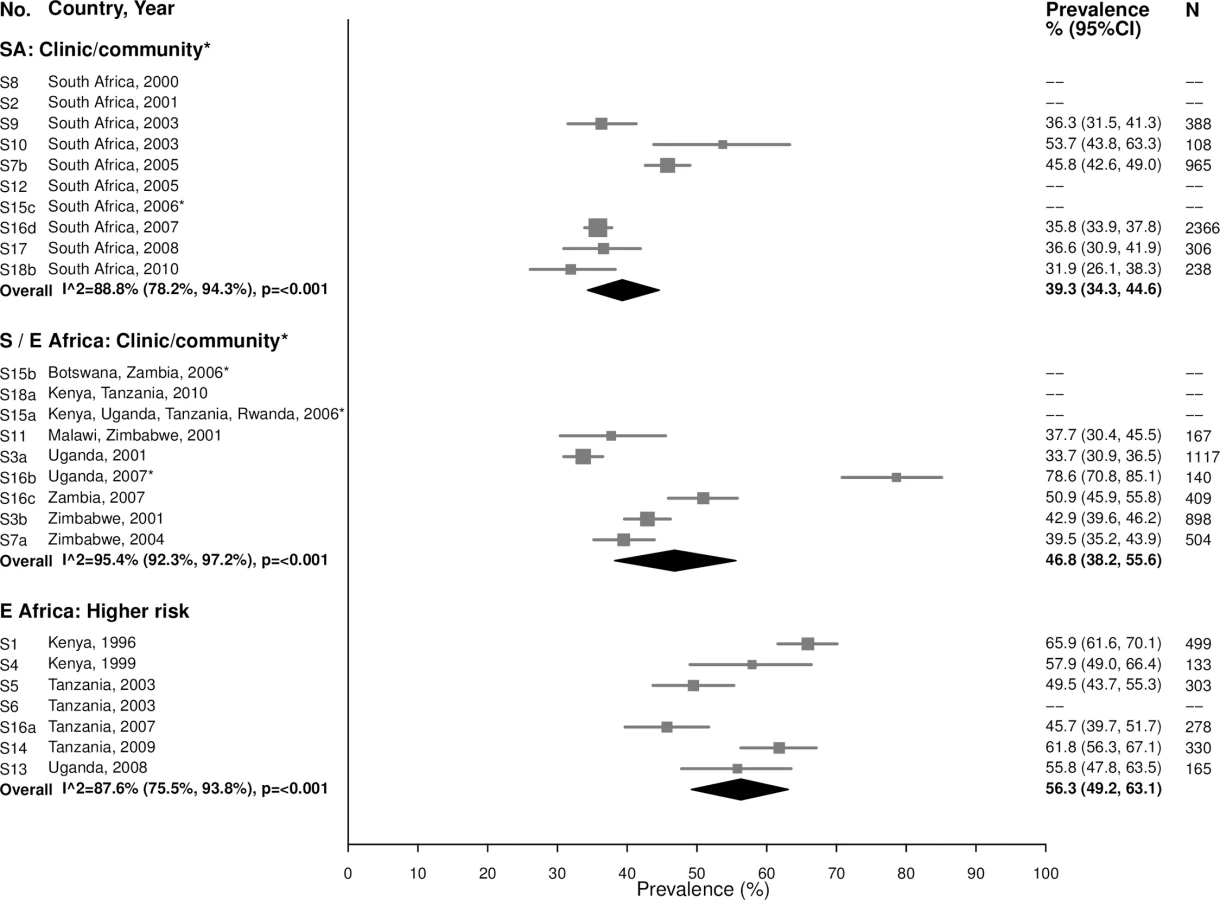
In general, HSV-2 prevalence was high among 15–24-year-olds, ranging from 31.9% to 53.7% in the South African clinic/community-based populations (summary estimate: 39.3% [95% CI: 34.3%, 44.6%]; I2 = 88.8%), 33.7% to 78.6% in Southern/Eastern African clinic/community-based populations (summary estimate: 46.8% [95% CI: 38.2%, 55.6%]; I2 = 95.4%), and 45.7% to 65.9% in the higher-risk populations in Eastern Africa (summary estimate: 56.3% [95% CI: 49.2%, 63.1%]; I2 = 87.6%) (Fig 11).
As expected due to the lifelong nature of HSV-2 infection, prevalence of HSV-2 was even higher among women aged 25–49 years (Fig 12). In the South African clinic/community-based populations, the summary estimate was 77.8% (95% CI: 75.6%, 79.9%; I2 = 49.2%), similar to summary estimates in Southern/Eastern African clinic/community-based populations (70.0% [95% CI: 61.8%, 77.1%]; I2 = 97.2%) and in the higher-risk populations in Eastern Africa (83.3% [95% CI: 79.3%, 86.6%]; I2 = 86.2%) (Fig 12).

Bacterial vaginosis
Among 15–24-year-olds in the South African clinic/community-based populations, the summary estimate for BV prevalence was 42.1% (95% CI: 35.6%, 49.0%; I2 = 90.0%), similar to the summary estimates in Southern/Eastern African clinic/community-based populations (35.2% [95% CI: 27.7%, 43.6%]; I2 = 93.3%) and in the higher-risk populations in Eastern Africa (49.5% [95% CI: 42.2%, 56.8%]; I2 = 90.0%) (Fig 13). Prevalence was similar among women aged 25–49 years, with high heterogeneity across studies (Fig 14).


Prevalence estimates for co-infection
Patterns of co-infection among women tested for at least 2 infections at baseline varied across STI/BV combinations (Tables 4–9). In general, women with a specific infection had a higher prevalence of another infection than women without this infection. For example, the overall estimated prevalence of chlamydia among young women in South African clinic/community-based populations was 15.1%, but chlamydia prevalence among women infected with another infection ranged from 16.3% (among women with HSV-2) to 38.7% (among women with gonorrhea; Table 4). For some infections, differences were not prominent. For example, the overall prevalence of high-titer, active syphilis among older women in South African clinic/community-based populations did not vary substantially by co-infection status (Table 5). Heterogeneity across studies varied widely by STI/BV combination; overall, 60% of estimates had low heterogeneity, 15% had mild/moderate heterogeneity, and 25% had high heterogeneity.
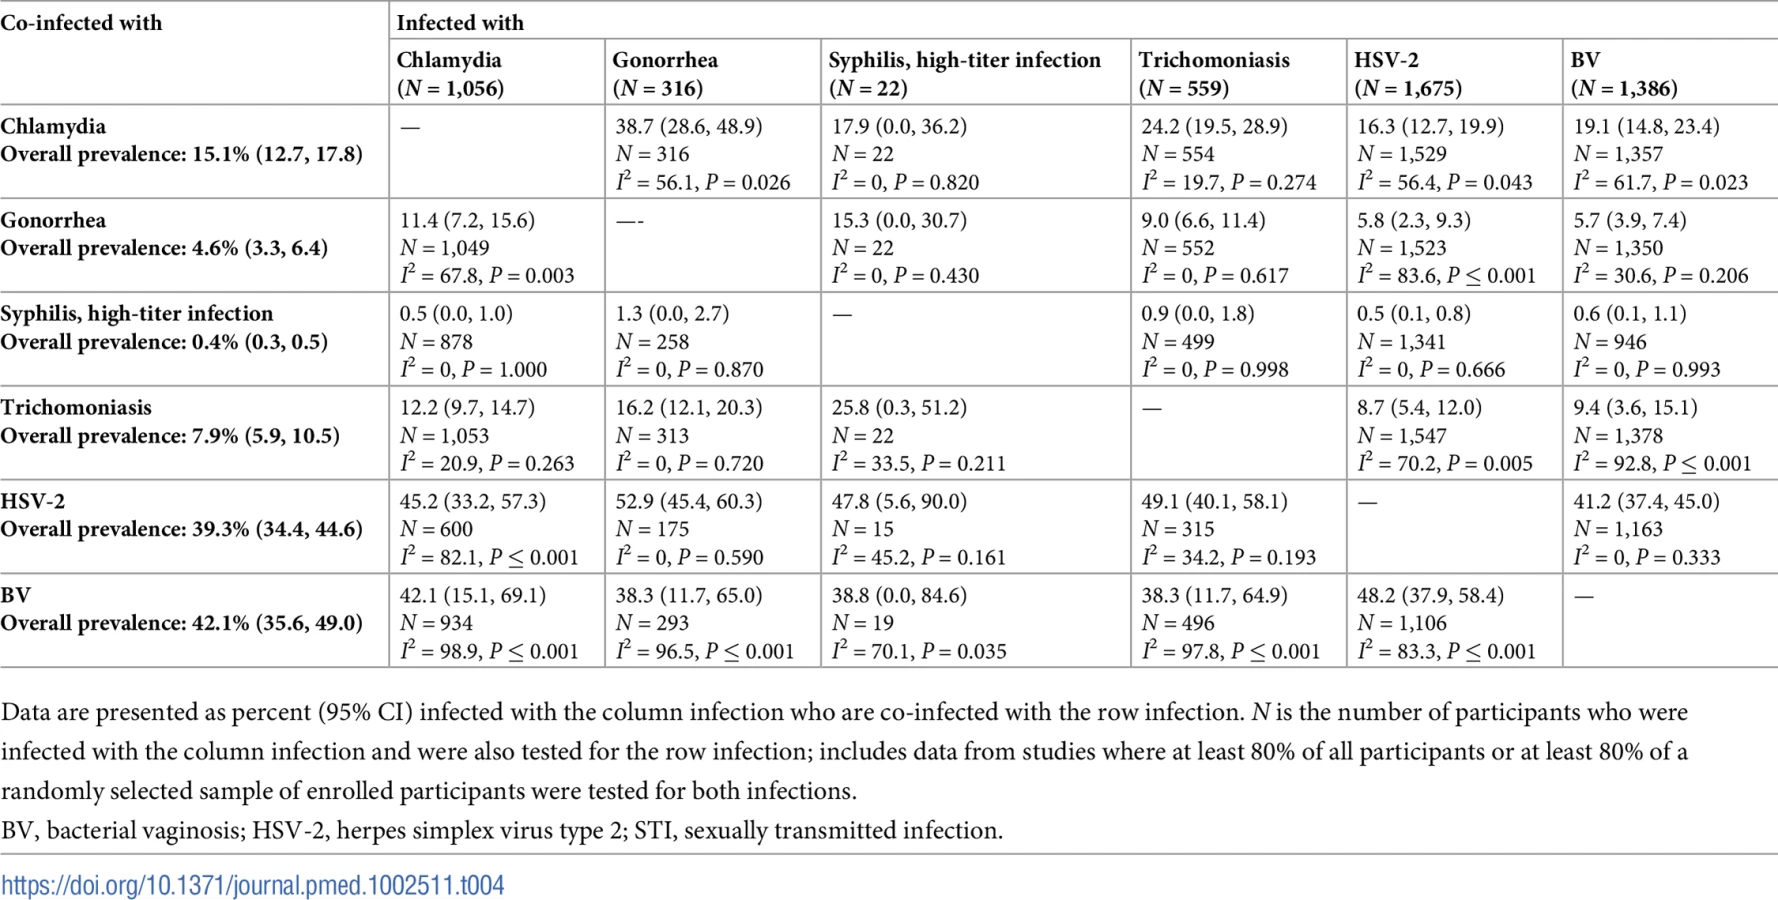


Some of the most striking findings were related to chlamydia/gonorrhea co-infection. Among women with chlamydia at baseline, the estimated prevalence of co-infection with gonorrhea was about 10%–20%. Among women with gonorrhea at baseline, estimated prevalence of co-infection with chlamydia varied by population type and age group: estimated co-infection prevalence was about 30%–40% among younger and older women in South African clinic/community-based populations (Tables 4 and 5) and was lower (about 10%) among older women in Southern/Eastern African clinic/community-based populations (Table 7) and older women in higher-risk populations in Eastern Africa (Table 9).
Discussion
In this IPD meta-analysis, we combined data from 18 prospective HIV prevention studies representing over 37,000 women in sub-Saharan Africa to estimate prevalence of chlamydia, gonorrhea, syphilis, trichomoniasis, HSV-2, and BV. We observed age-, region - and population-specific patterns in the prevalence of these infections, including higher prevalence of STIs among younger (15–24-year-old) than older (25–49-year-old) women, generally higher STI prevalence in clinic/community-based populations in South Africa than among similar populations elsewhere in Southern/Eastern Africa, and notably greater prevalence among higher-risk populations for certain STIs (e.g., gonorrhea and syphilis), but not for others (e.g., HSV-2 and BV, which had high prevalence across all population types).
A major strength of this analysis is that it provides important information on STI and BV prevalence that would not otherwise be readily available through literature searches of published data. Few of our included studies had published detailed results about STI or BV. None of the data from the included studies were identified through the literature search process used to generate the 2008 and 2012 WHO global curable STI estimates [1,37], because they included only higher-risk populations, they were published outside the time frames of the literature searches, they were not identified in the searches, or the published papers did not provide enough information (e.g., estimates not stratified by age group, sex, or country/region) to include in the WHO estimates. One study that initially did not have enough STI information in the published paper to include in the WHO 2012 estimates was later identified during this STI IPD meta-analysis and subsequently incorporated [30,31]. Combining STI/BV data from a large number of studies allowed us to estimate prevalence by age and population type more precisely for distinct regions within sub-Saharan Africa.
While this IPD meta-analysis provides a unique opportunity to strengthen understanding of the epidemiology of STIs/BV among sub-Saharan African women, several limitations need to be considered. First, the studies included in the HC-HIV meta-analysis dataset were not specifically selected to assess STI/BV prevalence, and should be considered a convenience sample of studies. There may have been additional studies from the region that did not meet inclusion criteria for the HC-HIV meta-analysis, but contained STI/BV data, including data for men. In addition, the women in these studies were not randomly sampled from the populations they represent. Women enrolled from clinical settings in particular may be more likely to be symptomatic or recently exposed to an STI, which would tend to overestimate STI prevalence. Some studies only enrolled women in clinic/community settings who reported recent sexual activity or more than 1 partner in the recent past [33]. Conversely, because all included studies were prospective evaluations of HIV acquisition, women included in this baseline evaluation were all HIV-negative. Thus, we may have underestimated STI/BV prevalence in communities with high HIV prevalence (such as in South Africa), where HIV-negative women may be at lower STI/HIV risk than others in their communities. Reassuringly, the prevalences of curable STIs we observed in clinic/community-based populations, especially in Southern/Eastern Africa, were similar to WHO 2012 estimates for African women (which were limited to general populations) [1]. Another limitation of this meta-analysis is that it included some studies that are more than 15 years old. Summary estimates could be biased if prevalence has changed over time. Evidence of temporal trends in the prevalence of STIs/BV in LMICs is limited, in part due to lack of standardized surveillance systems and differing methodology for repeated sets of regional estimates [1]. Available data from a few large studies have not shown clear evidence of changing epidemiology over the last two decades, beyond methodological issues in the estimation process [1–3]. Aside from syphilis—for which available rapid diagnostic tests and concerted efforts to screen and treat pregnant women to avert mother-to-child transmission have resulted in likely declines over time [1,38]—the other STIs and BV lack clearly effective population-level interventions in these settings. This provides confidence that even though some studies in this IPD meta-analysis are older, the data provide a general idea of the overall STI epidemic in these regions. Future research could combine these data with additional data points to further the understanding of global trends over time.
We observed high heterogeneity across studies when calculating summary estimates for STI/BV prevalence in some populations. Observed heterogeneity can reflect differences in study design, setting, sample size, and recruitment strategies between studies. We present summary estimates irrespective of the degree of between-study heterogeneity to facilitate the comparison of overall patterns between the population groups for each infection; however, observed heterogeneity should be taken into account when interpreting findings. For example, differences in test technology might explain some of the heterogeneity for some infections. We attempted to minimize this by excluding studies with less accurate tests for a particular STI or BV (e.g., studies that diagnosed BV based only on Amsel clinical criteria [39]). For some STIs, however, results from diagnostic tests with varying levels of sensitivity and specificity were included. Some of the most noticeable heterogeneity was observed among trichomoniasis estimates, for which a large number of studies used only wet mount, which is notably insensitive [40]. For HSV-2, although all included studies used EIAs, some studies used EIAs with lower specificity [41]. For chlamydia and gonorrhea, prevalence estimates were relatively consistent across studies despite some high I2 values. For syphilis estimates, heterogeneity was less pronounced. To refine prevalence estimates, future work could consider additional investigation into heterogeneity by diagnostic test type. Finally, studies that were conducted in multiple regions or among multiple population types were split into sub-studies; it is possible that estimates from these sub-studies are not independent.
We observed several patterns that highlight important features of the STI/BV epidemics in sub-Saharan Africa, which address the first strategic direction of the Global Strategy for STIs: “information for focused action: the who and the where.” In terms of the “who,” across all populations and regions, STI prevalence was generally higher among younger than older women, except for the prevalence of antibodies to HSV-2, which increased with age. Higher STI prevalence among young people has been observed worldwide and highlights the need for global efforts to improve sexual and reproductive health in adolescent girls and young women [42–44]. Additionally, we found that women who were in HIV-discordant partnerships had similar STI prevalence as women recruited from clinic/community-based populations, perhaps reflecting that although these participants may be at higher risk for HIV transmission than the general population, their risk for STIs/BV may be similar to that of clinic/community-based populations, given that they are in stable relationships.
As for the “where,” we found that women enrolled from clinic or community-based settings in South Africa had particularly high prevalence of STIs. In many cases, STI prevalence in South African women was similar to or greater than that of populations in Eastern Africa that were recruited from settings thought to be higher risk for HIV, such as women who report transactional sex. These findings are consistent with other studies in South Africa showing high prevalence of infections like chlamydia and gonorrhea [45,46]. This is particularly concerning given the likely increased risk of HIV acquisition posed by these inflammatory STIs [47,48]. Because of variability in how studies measured sexual behavior, we were unable to fully explore reasons for differences in STI prevalence across regions. South African women in the included studies were, however, less likely to be married or living with a partner compared with Southern/Eastern African women, although they were more likely than other groups to report condom use at last sex [49,50]. Additional work, such as research that incorporates anthropological and other qualitative methodologies, could help elucidate the cultural and behavioral drivers of observed differences between these populations.
The estimated prevalence of chlamydia in clinic/community populations in Southern/Eastern Africa was very similar to estimates from high-income countries in Europe and in the United States, including countries with well-established chlamydia control programs [51,52]. HSV-2 and BV prevalence was relatively high across all regions and population types. Gonorrhea and syphilis, on the other hand, were primarily concentrated among women recruited from settings thought to be at higher risk for HIV, which in this study were all in Eastern Africa. This suggests that targeting interventions to both populations and geographic regions may be important in addressing 2 of the 3 main areas of intervention focus for the Global Strategy: first, controlling the spread and impact of gonorrhea, particularly to stem the threat of gonococcal antimicrobial resistance [53], and, second, dramatically reducing mother-to-child transmission of syphilis and HIV [54]. The third main area of intervention focus of the Global Strategy is fully utilizing HPV vaccines; however, too few studies in the HC-HIV dataset collected information on HPV infection for us to evaluate this important STI.
Implications
Innovative approaches to obtaining better data on the STI burden are critical for developing and implementing prevention interventions, and monitoring evidence of program impact. Global STI management guidelines are currently being updated [55], and key decisions about the use of syndromic management (the use of presumptive treatment for symptomatic people without the use of laboratory tests) are dependent on accurate STI and BV prevalence data in different settings [56]. Our assessment of co-infections among the STIs can also help guide decision-making related to treatment. These prevalence data can also provide critical inputs to guide decision-making about STI prevention and control programs in different settings, e.g., congenital syphilis elimination efforts, the role of STI laboratory testing and treatment, including screening, and potential cost-effectiveness.
STI prevalence data also allow more accurate assessment of the need and potential impact of future interventions. A global roadmap for accelerating development of new STI vaccines outlined how better data on STI burden in LMICs are critical for assessing more accurately the predicted impact of STI vaccines, developing investment cases for vaccine development, and guiding future vaccine implementation and evaluation [57,58]. Work on a vaccine against HSV is well underway [59], which is crucial given the HSV-2 prevalence of roughly 70%–80% among 25–49-year-old women in this analysis and the notable increased risk of HIV due to HSV [60]. Proof-of-principle findings from a study of how the meningococcal B vaccine might impact gonorrhea are also intriguing [61]. Given augmentation of HIV risk with all STIs as well as BV, and other major reproductive health outcomes such as infertility, not only STI vaccines but multipurpose prevention technologies such as vaginal microbicides and the role of expanded screening through point-of-care tests should also be explored [60,62].
Collecting better information on STI prevalence and incidence is the first key strategic direction of the new Global Strategy [4]. Given resource and logistical constraints, de novo dedicated STI prevalence studies may not be realistic in many settings, particularly in sub-Saharan Africa, where the impact of STIs and their consequences may be greatest [63]. This IPD meta-analysis leverages existing STI data to fill this unmet need and offers a new approach to obtaining critically needed information on the epidemiology of STIs in LMICs. In addition to seeking opportunities to add STI laboratory testing to surveillance studies and clinical trials from the outset, this methodology can be applied to other regions and populations, including men, to further inform global estimates of STI and BV burden.
Supporting Information
Zdroje
1. Newman L, Rowley J, Vander Hoorn S, Wijesooriya NS, Unemo M, Low N, et al. Global estimates of the prevalence and incidence of four curable sexually transmitted infections in 2012 based on systematic review and global reporting. PLoS ONE. 2015;10(12):e0143304. doi: 10.1371/journal.pone.0143304 26646541
2. Looker KJ, Magaret AS, Turner KM, Vickerman P, Gottlieb SL, Newman LM. Global estimates of prevalent and incident herpes simplex virus type 2 infections in 2012. PLoS ONE. 2015;10(1):e114989. doi: 10.1371/journal.pone.0114989 25608026
3. Kenyon C, Colebunders R, Crucitti T. The global epidemiology of bacterial vaginosis: a systematic review. Am J Obstet Gynecol. 2013;209(6):505–23. doi: 10.1016/j.ajog.2013.05.006 23659989
4. World Health Organization. Global health sector strategy on sexually transmitted infections 2016–2021: towards ending STIs. Geneva: World Health Organization; 2016 Jul [cited 2017 Aug 3]. Available from: http://apps.who.int/iris/bitstream/10665/246296/1/WHO-RHR-16.09-eng.pdf?ua=1.
5. World Health Organization. Meeting report: consultation on methods for improved global sexually transmitted infections estimates. November 11–12, 2013, Geneva, Switzerland. Geneva: World Health Organization; 2014 Mar.
6. Morrison CS, Chen PL, Kwok C, Baeten JM, Brown J, Crook AM, et al. Hormonal contraception and the risk of HIV acquisition: an individual participant data meta-analysis. PLoS Med. 2015;12(1):e1001778. doi: 10.1371/journal.pmed.1001778 25612136
7. Baeten JM, Benki S, Chohan V, Lavreys L, McClelland RS, Mandaliya K, et al. Hormonal contraceptive use, herpes simplex virus infection, and risk of HIV-1 acquisition among Kenyan women. AIDS. 2007;21(13):1771–7. doi: 10.1097/QAD.0b013e328270388a 17690576
8. Martin HL Jr, Nyange PM, Richardson BA, Lavreys L, Mandaliya K, Jackson DJ, et al. Hormonal contraception, sexually transmitted diseases, and risk of heterosexual transmission of human immunodeficiency virus type 1. J Infect Dis. 1998;178(4):1053–9. 9806034
9. Myer L, Denny L, Wright TC, Kuhn L. Prospective study of hormonal contraception and women’s risk of HIV infection in South Africa. Int J Epidemiol. 2007;36(1):166–74. doi: 10.1093/ije/dyl251 17175547
10. Myer L, Denny L, de Souza M, Wright TC Jr, Kuhn L. Distinguishing the temporal association between women’s intravaginal practices and risk of human immunodeficiency virus infection: a prospective study of South African women. Am J Epidemiol. 2006;163(6):552–60. doi: 10.1093/aje/kwj071 16443804
11. Morrison CS, Chen PL, Kwok C, Richardson BA, Chipato T, Mugerwa R, et al. Hormonal contraception and HIV acquisition: reanalysis using marginal structural modeling. AIDS. 2010;24(11):1778–81. doi: 10.1097/QAD.0b013e32833a2537 20588106
12. Morrison CS, Skoler-Karpoff S, Kwok C, Chen PL, van de Wijgert J, Gehret-Plagianos M, et al. Hormonal contraception and the risk of HIV acquisition. AIDS. 2007;21(1):85–95. doi: 10.1097/QAD.0b013e3280117c8b 17148972
13. Kaul R, Kimani J, Nagelkerke NJ, Fonck K, Ngugi EN, Keli F, et al. Monthly antibiotic chemoprophylaxis and incidence of sexually transmitted infections and HIV-1 infection in Kenyan sex workers: a randomized controlled trial. JAMA. 2004;291(21):2555–62. doi: 10.1001/jama.291.21.2555 15173146
14. Vallely A, Kasindi S, Hambleton IR, Knight L, Chirwa T, Balira R, et al. Microbicides development program, Tanzania-baseline characteristics of an occupational cohort and reattendance at 3 months. Sex Transm Dis. 2007;34(9):638–43. doi: 10.1097/OLQ.0b013e3180325120 17717482
15. Watson-Jones D, Baisley K, Weiss HA, Tanton C, Changalucha J, Everett D, et al. Risk factors for HIV incidence in women participating in an HSV suppressive treatment trial in Tanzania. AIDS. 2009;23(3):415–22. doi: 10.1097/QAD.0b013e32831ef523 19114859
16. Watson-Jones D, Weiss HA, Rusizoka M, Changalucha J, Baisley K, Mugeye K, et al. Effect of herpes simplex suppression on incidence of HIV among women in Tanzania. N Engl J Med. 2008;358(15):1560–71. doi: 10.1056/NEJMoa0800260 18337596
17. McCoy SI, Zheng W, Montgomery ET, Blanchard K, van der Straten A, de Bruyn G, et al. Oral and injectable contraception use and risk of HIV acquisition among women in sub-Saharan Africa. AIDS. 2013;27(6):1001–9. doi: 10.1097/QAD.0b013e32835da401 23698064
18. Padian NS, van der Straten A, Ramjee G, Chipato T, de Bruyn G, Blanchard K, et al. Diaphragm and lubricant gel for prevention of HIV acquisition in southern African women: a randomised controlled trial. Lancet. 2007;370(9583):251–61. doi: 10.1016/S0140-6736(07)60950-7 17631387
19. Kleinschmidt I, Rees H, Delany S, Smith D, Dinat N, Nkala B, et al. Injectable progestin contraceptive use and risk of HIV infection in a South African family planning cohort. Contraception. 2007;75(6):461–7. doi: 10.1016/j.contraception.2007.02.002 17519153
20. Delany-Moretlwe S, Rees H. Tshireletso study for women’s health. Microbicide feasibility study. Protocol. Hillbrow (South Africa): University of Witwatersrand Reproductive Health Research Unit; 2010.
21. McGrath N, Chimbwete C, Bennish M, Cassol S, Sturm W, Nunn A, et al. A feasibility study in preparation for phase III microbicide trials in the Hlabisa sub-district, South Africa. Southampton: University of Southampton; 2014 [cited 2018 Jan 29]. Available from: https://cdn.southampton.ac.uk/assets/imported/transforms/content-block/UsefulDownloads_Download/461D68EEDFED4C43B06EE08C8DF75A22/nuala%20mcgrath%20protocol%205.0.pdf#_ga=2.114160135.1656362442.1517285454-818325345.1517285454.
22. Kumwenda N, Kemewenda J, Kafulafula G, Makanani B, Taulo F, Nkhoma C, et al. HIV-1 incidence among women of reproductive age in Malawi. Int J STD AIDS. 2008;19 : 339–41. doi: 10.1258/ijsa.2007.007165 18482966
23. Kumwenda N, Hoffman I, Chirenje M, Kelly C, Coletti A, Ristow A, et al. HIV incidence among women of reproductive age in Malawi and Zimbabwe. Sex Transm Dis. 2006;33(11):646–51. doi: 10.1097/01.olq.0000223283.27142.9f 16773032
24. Morrison CS, Skoler-Karpoff S, Kwok C, Chen PL, van de Wijgert J, Gehret-Plagianos M, et al. Hormonal contraception and the risk of HIV acquisition among women in South Africa. AIDS. 2012;26(4):497–504. doi: 10.1097/QAD.0b013e32834fa13d 22156973
25. Skoler-Karpoff S, Ramjee G, Ahmed K, Altini L, Plagianos MG, Friedland B, et al. Efficacy of Carraguard for prevention of HIV infection in women in South Africa: a randomised, double-blind, placebo-controlled trial. Lancet. 2008;372(9654):1977–87. doi: 10.1016/S0140-6736(08)61842-5 19059048
26. Vandepitte J, Bukenya J, Weiss HA, Nakubulwa S, Francis SC, Hughes P, et al. HIV and other sexually transmitted infections in a cohort of women involved in high-risk sexual behavior in Kampala, Uganda. Sex Transm Dis. 2011;38(4):316–23. 23330152
27. Kapiga SH, Ewings FM, Ao T, Chilongani J, Mongi A, Baisley K, et al. The epidemiology of HIV and HSV-2 infections among women participating in microbicide and vaccine feasibility studies in Northern Tanzania. PLoS ONE. 2013;8(7):e68825. doi: 10.1371/journal.pone.0068825 23874780
28. Heffron R, Donnell D, Rees H, Celum C, Mugo N, Were E, et al. Use of hormonal contraceptives and risk of HIV-1 transmission: a prospective cohort study. Lancet Infect Dis. 2012;12(1):19–26. doi: 10.1016/S1473-3099(11)70247-X 21975269
29. Celum C, Wald A, Lingappa JR, Magaret AS, Wang RS, Mugo N, et al. Acyclovir and transmission of HIV-1 from persons infected with HIV-1 and HSV-2. N Engl J Med. 2010;362(5):427–39. doi: 10.1056/NEJMoa0904849 20089951
30. Crook AM, Ford D, Gafos M, Hayes R, Kamali A, Kapiga S, et al. Injectable and oral contraceptives and risk of HIV acquisition in women: an analysis of data from the MDP301 trial. Hum Reprod. 2014;29(8):1810–7. doi: 10.1093/humrep/deu113 24838704
31. McCormack S, Ramjee G, Kamali A, Rees H, Crook AM, Gafos M, et al. PRO2000 vaginal gel for prevention of HIV-1 infection (Microbicides Development Programme 301): a phase 3, randomised, double-blind, parallel-group trial. Lancet. 2010;376(9749):1329–37. doi: 10.1016/S0140-6736(10)61086-0 20851460
32. Abdool Karim Q, Abdool Karim SS, Frohlich JA, Grobler AC, Baxter C, Mansoor LE, et al. Effectiveness and safety of tenofovir gel, an antiretroviral microbicide, for the prevention of HIV infection in women. Science. 2010;329(5996):1168–74. doi: 10.1126/science.1193748 20643915
33. Van Damme L, Corneli A, Ahmed K, Agot K, Lombaard J, Kapiga S, et al. Preexposure prophylaxis for HIV infection among African women. N Engl J Med. 2012;367(5):411–22. doi: 10.1056/NEJMoa1202614 22784040
34. Low N, Chersich MF, Schmidlin K, Egger M, Francis SC, van de Wijgert JH, et al. Intravaginal practices, bacterial vaginosis, and HIV infection in women: individual participant data meta-analysis. PLoS Med. 2011;8(2):e1000416. doi: 10.1371/journal.pmed.1000416 21358808
35. Samoff E, Koumans EH, Gibson JJ, Ross M, Markowitz LE. Pre-treatment syphilis titers: distribution and evaluation of their use to distinguish early from late latent syphilis and to prioritize contact investigations. Sex Transm Dis. 2009;36(12):789–93. doi: 10.1097/OLQ.0b013e3181b3566b 19773682
36. Higgins JP, Thompson SG, Deeks JJ, Altman DG. Measuring inconsistency in meta-analyses. BMJ. 2003;327(7414):557–60. doi: 10.1136/bmj.327.7414.557 12958120
37. World Health Organization. Global incidence and prevalence of selected sexually transmitted infections—2008. Geneva: World Health Organization; 2012 [cited 2017 Sep 23]. Available from: http://www.who.int/reproductivehealth/publications/rtis/stisestimates/en/.
38. Wijesooriya NS, Rochat RW, Kamb ML, Turlapati P, Temmerman M, Broutet N, et al. Global burden of maternal and congenital syphilis in 2008 and 2012: a health systems modelling study. Lancet Glob Health. 2016;4(8):e525–33. doi: 10.1016/S2214-109X(16)30135-8 27443780
39. Rabe LK, Kelly CW, Hillier SL. A comparison of the diagnosis of bacterial vaginosis by Amsel’s Clinical Criteria and the Vaginal Gram Staining Nugent score in HPTN 035. Microbicides 2008 Conference; 2008 Feb 24–27; New Delhi, India.
40. Patil MJ, Nagamoti JM, Metgud SC. Diagnosis of trichomonas vaginalis from vaginal specimens by wet mount microscopy, In Pouch TV culture system, and PCR. J Glob Infect Dis. 2012;4(1):22–5. doi: 10.4103/0974-777X.93756 22529623
41. van Dyck E, Buve A, Weiss HA, Glynn JR, Brown DW, De Deken B, et al. Performance of commercially available enzyme immunoassays for detection of antibodies against herpes simplex virus type 2 in African populations. J Clin Microbiol. 2004;42(7):2961–5. doi: 10.1128/JCM.42.7.2961-2965.2004 15243045
42. Abdool Karim Q, Baxter C, Birx D. Prevention of HIV in adolescent girls and young women: key to an AIDS-free generation. J Acquir Immune Defic Syndr. 2017;75(Suppl 1):S17–26.
43. Moodley D, Moodley P, Sebitloane M, Soowamber D, McNaughton-Reyes HL, Groves AK, et al. High prevalence and incidence of asymptomatic sexually transmitted infections during pregnancy and postdelivery in KwaZulu Natal, South Africa. Sex Transm Dis. 2015;42(1):43–7. doi: 10.1097/OLQ.0000000000000219 25504300
44. Giuliano AR, Botha MH, Zeier M, Abrahamsen ME, Glashoff RH, van der Laan LE, et al. High HIV, HPV, and STI prevalence among young Western Cape, South African women: EVRI HIV prevention preparedness trial. J Acquir Immune Defic Syndr. 2015;68(2):227–35. doi: 10.1097/QAI.0000000000000425 25415290
45. Pettifor AE, Rees HV, Kleinschmidt I, Steffenson AE, MacPhail C, Hlongwa-Madikizela L, et al. Young people’s sexual health in South Africa: HIV prevalence and sexual behaviors from a nationally representative household survey. AIDS. 2005;19(14):1525–34. 16135907
46. World Health Organization, UNDP/UNFPA/UNICEF/WHO/World Bank Special Programme of Research, Development and Research Training in Human Reproduction. The importance of sexual and reproductive health and rights to prevent HIV in adolescent girls and young women in eastern and southern Africa. Geneva: World Health Organization; 2017 [cited 2017 Aug 3]. Available from: http://www.who.int/reproductivehealth/publications/linkages/hiv-prevention-adolescent-girls-young-women/en/.
47. Hayes R, Watson-Jones D, Celum C, van de Wijgert J, Wasserheit J. Treatment of sexually transmitted infections for HIV prevention: end of the road or new beginning? AIDS. 2010;24(Suppl 4):S15–26.
48. Kyongo JK, Crucitti T, Menten J, Hardy L, Cools P, Michiels J, et al. Cross-sectional analysis of selected genital tract immunological markers and molecular vaginal microbiota in sub-Saharan African women, with relevance to HIV risk and prevention. Clin Vaccine Immunol. 2015;22(5):526–38. doi: 10.1128/CVI.00762-14 25761460
49. Marston M, Slaymaker E, Cremin I, Floyd S, McGrath N, Kasamba I, et al. Trends and patterns in marriage and time spent single and sexually active in sub Saharan Africa, a comparative analysis of six community based cohort studies. Sex Transm Infect. 2009;85(Suppl 1):i64–71.
50. Hosegood V, McGrath N, Moultrie T. Dispensing with marriage: marital and partnership trends in rural KwaZulu-Natal, South Africa 2000–2006. Demogr Res. 2009;20 : 279–312. doi: 10.4054/DemRes.2009.20.13 25729322
51. Torrone E, Papp J, Weinstock H, Centers for Disease Control and Prevention (CDC). Prevalence of Chlamydia trachomatis genital infection among persons aged 14–39 years—United States, 2007–2012. MMWR Morb Mortal Wkly Rep. 2014;63(38):834–8. 25254560
52. Sonnenberg P, Clifton S, Beddows S, Field N, Soldan K, Tanton C, et al. Prevalence, risk factors, and uptake of interventions for sexually transmitted infections in Britain: findings from the National Surveys of Sexual Attitudes and Lifestyles (Natsal). Lancet. 2013;382(9907):1795–806. doi: 10.1016/S0140-6736(13)61947-9 24286785
53. World Health Organization. Global action plan to control the spread and impact of antimicrobial resistance in Neisseria gonorrhoeae. Geneva: World Health Organization; 2012 [cited 2017 Aug 3]. Available from: http://www.who.int/reproductivehealth/publications/rtis/9789241503501/en/.
54. World Health Organization. Investment case for eliminating mother-to-child transmission of syphilis: promoting better maternal and child health and stronger health systems. Geneva: World Health Organization; 2012 [cited 2017 Aug 3]. Available from: http://www.who.int/reproductivehealth/publications/rtis/9789241504348/en/.
55. World Health Organization. Guidelines for the management of sexually transmitted infections. Geneva: World Health Organization; 2004 [cited 2017 Aug 3]. Available from: http://www.who.int/hiv/pub/sti/pub6/en/.
56. Garrett NJ, McGrath N, Mindel A. Advancing STI care in low/middle-income countries: has STI syndromic management reached its use-by date? Sex Transm Infect. 2017;93(1):4–5. doi: 10.1136/sextrans-2016-052581 27084840
57. Gottlieb SL, Low N, Newman LM, Bolan G, Kamb M, Broutet N. Toward global prevention of sexually transmitted infections (STIs): the need for STI vaccines. Vaccine. 2014;32(14):1527–35. doi: 10.1016/j.vaccine.2013.07.087 24581979
58. Broutet N, Fruth U, Deal C, Gottlieb SL, Rees H, participants of the 2013 STI Vaccine Technical Consultation. Vaccines against sexually transmitted infections: the way forward. Vaccine. 2014;32(14):1630–7. doi: 10.1016/j.vaccine.2014.01.053 24480024
59. Johnston C, Gottlieb SL, Wald A. Status of vaccine research and development of vaccines for herpes simplex virus. Vaccine. 2016;34(26):2948–52. doi: 10.1016/j.vaccine.2015.12.076 26973067
60. Looker KJ, Elmes JAR, Gottlieb SL, Schiffer JT, Vickerman P, Turner KME, et al. The effect of HSV-2 infection on subsequent HIV acquisition: an updated systematic review and meta-analysis. Lancet Infect Dis. 2017;17(12):1303–16. doi: 10.1016/S1473-3099(17)30405-X 28843576
61. Petousis-Harris H, Paynter J, Morgan J, Saxton P, McArdle B, Goodyear-Smith F, et al. Effectiveness of a group B outer membrane vesicle meningococcal vaccine against gonorrhoea in New Zealand: a retrospective case-control study. Lancet. 2017;390(10102):1603–10. doi: 10.1016/S0140-6736(17)31449-6 28705462
62. Fox J, Fidler S. Sexual transmission of HIV-1. Antiviral Res. 2010 Jan;85(1):276–85. doi: 10.1016/j.antiviral.2009.10.012 19874852
63. Chico RM, Mayaud P, Ariti C, Mabey D, Ronsmans C, Chandramohan D. Prevalence of malaria and sexually transmitted and reproductive tract infections in pregnancy in sub-Saharan Africa: a systematic review. JAMA. 2012;307(19):2079–86. doi: 10.1001/jama.2012.3428 22665107
Štítky
Interní lékařstvíČlánek vyšel v časopise
PLOS Medicine
2018 Číslo 2
- Alternativní léčebné možnosti u hypercholesterolemie při intoleranci statinů
- Vliv kombinace nutraceutik na remodelaci levé komory srdeční u osob s metabolickým syndromem
- Nutraceutika a jejich ovlivnění mírného kardiometabolického rizika
- Princip účinku medu v léčbě chronických i infikovaných ran
- Superoxidovaný roztok a jeho využití v léčbě ran
Nejčtenější v tomto čísle
- The potential impact of case-area targeted interventions in response to cholera outbreaks: A modeling study
- Prevalence of sexually transmitted infections among young people in South Africa: A nested survey in a health and demographic surveillance site
- Susceptibility of to azithromycin and ceftriaxone in China: A retrospective study of national surveillance data from 2013 to 2016
- Perfluoroalkyl substances and changes in body weight and resting metabolic rate in response to weight-loss diets: A prospective study