
The potential impact of case-area targeted interventions in response to cholera outbreaks: A modeling study
In a modeling study, Andrew Azman and colleagues investigate the potential value of targeted interventions for control of cholera outbreaks.
Published in the journal:
. PLoS Med 15(2): e32767. doi:10.1371/journal.pmed.1002509
Category:
Research Article
doi:
https://doi.org/10.1371/journal.pmed.1002509
Summary
In a modeling study, Andrew Azman and colleagues investigate the potential value of targeted interventions for control of cholera outbreaks.
Introduction
With over 130,000 cases and 2,400 deaths reported globally in 2016, cholera continues to be a major public health threat, particularly in sub-Saharan Africa [1]. These numbers likely represent an underestimate of the true burden due to poor access to health care, insensitive surveillance systems, and political sensitivities around reporting cases and deaths [2,3]. Cities in sub-Saharan Africa are regularly struck by cholera outbreaks, causing disruption and hindering social and economic development [4,5]. These cities may act as local, national, and/or international hubs of disease spread due to regular travel and migration, and quickly controlling cholera outbreaks in these areas may significantly reduce the number of cholera cases both within the cities and elsewhere.
The cornerstone of cholera prevention and control is improved access to safe water, sanitation, and hygiene (WaSH) and appropriate case management. WaSH includes a heterogeneous mix of interventions, ranging from provision of safe water through infrastructure or point-of-use water treatment (POUWT) tools to latrine building and hygiene behavior change measures [6]. Antibiotics have been used to shorten the duration of shedding in cholera cases and, in some instances, to provide short-term prophylaxis for household contacts, although their prophylactic use is not part of current guidelines by WHO, Médecins Sans Frontières (MSF), the US Centers for Disease Control and Prevention, or icddr,b [7,8]. Recently, oral cholera vaccines (OCVs) have been added to this arsenal and are widely available as a result of the global cholera vaccine stockpile and the addition of new, affordable WHO-prequalified vaccines to the stockpile [9,10]. However, supply of these vaccines remains limited, and countries must often contend with fewer doses than needed to cover the population at risk [11]. OCVs have been shown to be safe, immunogenic, and protective, with 2-dose protection (the standard regimen) lasting at least 3 years, and single-dose protection at least 6 months [12,13], a similar time scale to many cholera epidemics.
These tools are used preventively [14] in areas deemed at high risk for cholera transmission, or reactively in response to a cholera outbreak [15–17]. Control measures are typically given to the population at-large through mass campaigns within high-risk areas, although targeted interventions to households or neighborhoods of cases, including delivery of OCV, antibiotics, and POUWT [7,8,18–20], are common. In Haiti and other countries, efforts to establish rapid response teams tasked with implementing highly targeted interventions are currently underway [21]. The benefits of this type of approach remain unclear, and there is little understanding about when in an epidemic these interventions may have a greater impact than more traditional community-wide interventions, how large an area to target around case households, or the best mix of interventions.
Spatiotemporal clustering of cholera cases—at distances ranging from tens to hundreds of meters—has been observed during numerous cholera outbreaks in endemic and epidemic areas [22–28]. A previous analysis showed that suspected cholera cases were significantly clustered up to distances of at least 200 m from incident case households within the first 5 days of a case presenting for care during epidemics in 2 urban African settings in Chad and the Democratic Republic of the Congo [29]. This clustering has been attributed to common risk factors in those living close to one another, in addition to the risk of transmission often being higher the closer one lives to an infected individual. Intervention strategies targeting disease hotspots [30], particularly vulnerable neighborhoods and camps [31] and other communities, have been successfully applied in the past. Limited literature exists, however, on reactive case-area targeted interventions (CATIs), which take advantage of the inherent spatiotemporal clustering of cholera cases by targeting people living within a given distance around reported cholera cases. Such a strategy could not only present efficient alternatives to reactive mass intervention campaigns in outbreak situations, where resources may be limited or their availability delayed, but may also be used as a complementary approach to mass campaigns when cholera incidence is low, such as during the initial phase or declining tail of an epidemic.
Here we aim to understand the potential impact of CATIs on epidemic cholera using computational transmission models fit to data from a 2011 cholera epidemic in Chad. We aim to provide practical guidance on the best mix of interventions (OCV, POUWT, and/or prophylactic antibiotics), ring size, and timing to maximize efficiency and impact.
Methods
Case study and data
During the 2011 cholera epidemic in N’Djamena, Chad, field staff from MSF collected the household coordinates of all suspected cholera cases presenting at the main cholera treatment center starting on June 22 by visiting people at their home (S1 Fig). From August—when the case load began to increase rapidly—through the end of the epidemic in December, household coordinates were collected for every third patient. To minimize potential selection biases, every third patient was identified at the cholera treatment center by an epidemiologist from MSF/Epicentre (NN) who then provided the address to a team of data collectors who visited each household. The resulting dataset, combining the overall epidemic curve of suspected cholera cases (citywide) with GPS coordinates of patient’s homes, has been described previously [29] (S2 Fig). The epidemic totaled 4,352 reported cases (within a population of 993,500) and lasted for 232 days. The attack rate varied between 11.6 and 59.6 per 10,000 among the 10 districts (arrondissements) of the city (S2 Fig). As these data were originally collected for operational purposes, this study did not have a prospective protocol, and it was deemed to be exempt research by the Johns Hopkins Bloomberg School of Public Health Institutional Review Board.
Quantification of spatiotemporal clustering
To quantify the spatiotemporal clustering of cholera cases, we used the τ statistic, a measure of the relative risk that a person living at a given distance from a known cholera case also becomes a case compared to any person in the entire population becoming a case within the same time frame [32–36] (S1 Text). In the presence of spatiotemporal clustering at a particular distance and time, τ is greater than 1.
Epidemiological model
We developed an individual-based, spatially explicit stochastic model (S1 Text) and calibrated it to the 2011 cholera outbreak in N’Djamena. All 993,500 inhabitants of the city were assigned a geographical location according to the population density estimated using remotely sensed built-up density as a proxy [37,38] (S2 Fig). Demographic processes, like births and deaths, were assumed to be negligible during the short time course of the outbreak. In the model, each individual’s state (e.g., susceptible, exposed, infectious, or recovered) is tracked during the outbreak (Fig 1A). Susceptible individuals are exposed to a spatially distributed force of infection originating from infectious individuals and decreasing with distance (Fig 1B). The force of infection is modulated by rainfall, which has been shown to be an important environmental driver of cholera epidemics in several settings [39–43]. Exposed individuals can become either symptomatically infected, after an incubation period with a mean duration of 2 days [44], or mildly/asymptomatically infected, in which case it is assumed that they do not significantly contribute to the force of infection [45,46]. Symptomatic infection lasts for an average of 5 days before individuals recover [47].

The 4 free parameters of our model are the ratio of symptomatic to asymptomatic infections, a kernel-independent transmission rate, a shape parameter of the power-law transmission kernel, and a coefficient governing the influence of rainfall. Model calibration was performed using an approximate Bayesian computation population Monte Carlo (ABC-PMC) approach (S1 Text) [48]. Specifically, we calibrated the model to the number of newly reported cases per day (i.e., the epidemic curve; Fig 2A) and the spatiotemporal clustering of the case households, as captured by the τ statistic. We estimated τ at 3 different representative distance windows (15 to 45 m, 45 to 105 m, and 105 to 225 m)—chosen to fit the spatial discretization of the model domain—and focused on cases occurring within 5 days after each case (Fig 2B). For simplicity and interpretability, we used the sum of squared errors as a goodness of fit measure for both criteria. The calibration was run with 512 particles, which were accepted if the sums of squared errors of both criteria were lower than predefined thresholds adapted after every calibration step (S1 Text).

Intervention strategies
To evaluate the benefits (e.g., averted symptomatic cases) and resource needs (e.g., number of people targeted and number of clusters targeted through CATI) of different types of interventions, we simulated a total of 111 scenarios (and several sensitivity analyses), combining different intervention types, modes of allocation, and intervention starting times (S1 Table). Out of an initial 1,000 epidemics simulated without interventions, the ones with at least 10 new cholera cases during the week preceding the initiation time (833, 836, and 829 for interventions starting on day 50, 130, and 180 of the epidemic, respectively) were resimulated for every intervention scenario. This threshold of 10 was selected through trial and error to ensure that simulated epidemics reflected those where interventions were likely to be put in place (e.g., in epidemics with clear evidence of ongoing transmission) and to reduce the number of comparisons where the differences between uncontrolled and intervention simulations was largely a result of stochastic effects rather than the interventions. Simulations were run up to 1 year from the first cases to stay within the realm of historic outbreak durations. For each intervention scenario we then computed the median and interquartile range for the number of averted cases and the number of epidemic days reduced, over all simulations. These interquartile ranges (or prediction intervals) capture the uncertainty related to the model parameters (intervention - and disease-transmission-related parameters) and stochastic variations. Note that, using this method, some simulations may generate a higher number of cases and/or a longer epidemic with interventions than without, because the course of the simulated epidemic trajectories is subject to stochastic processes.
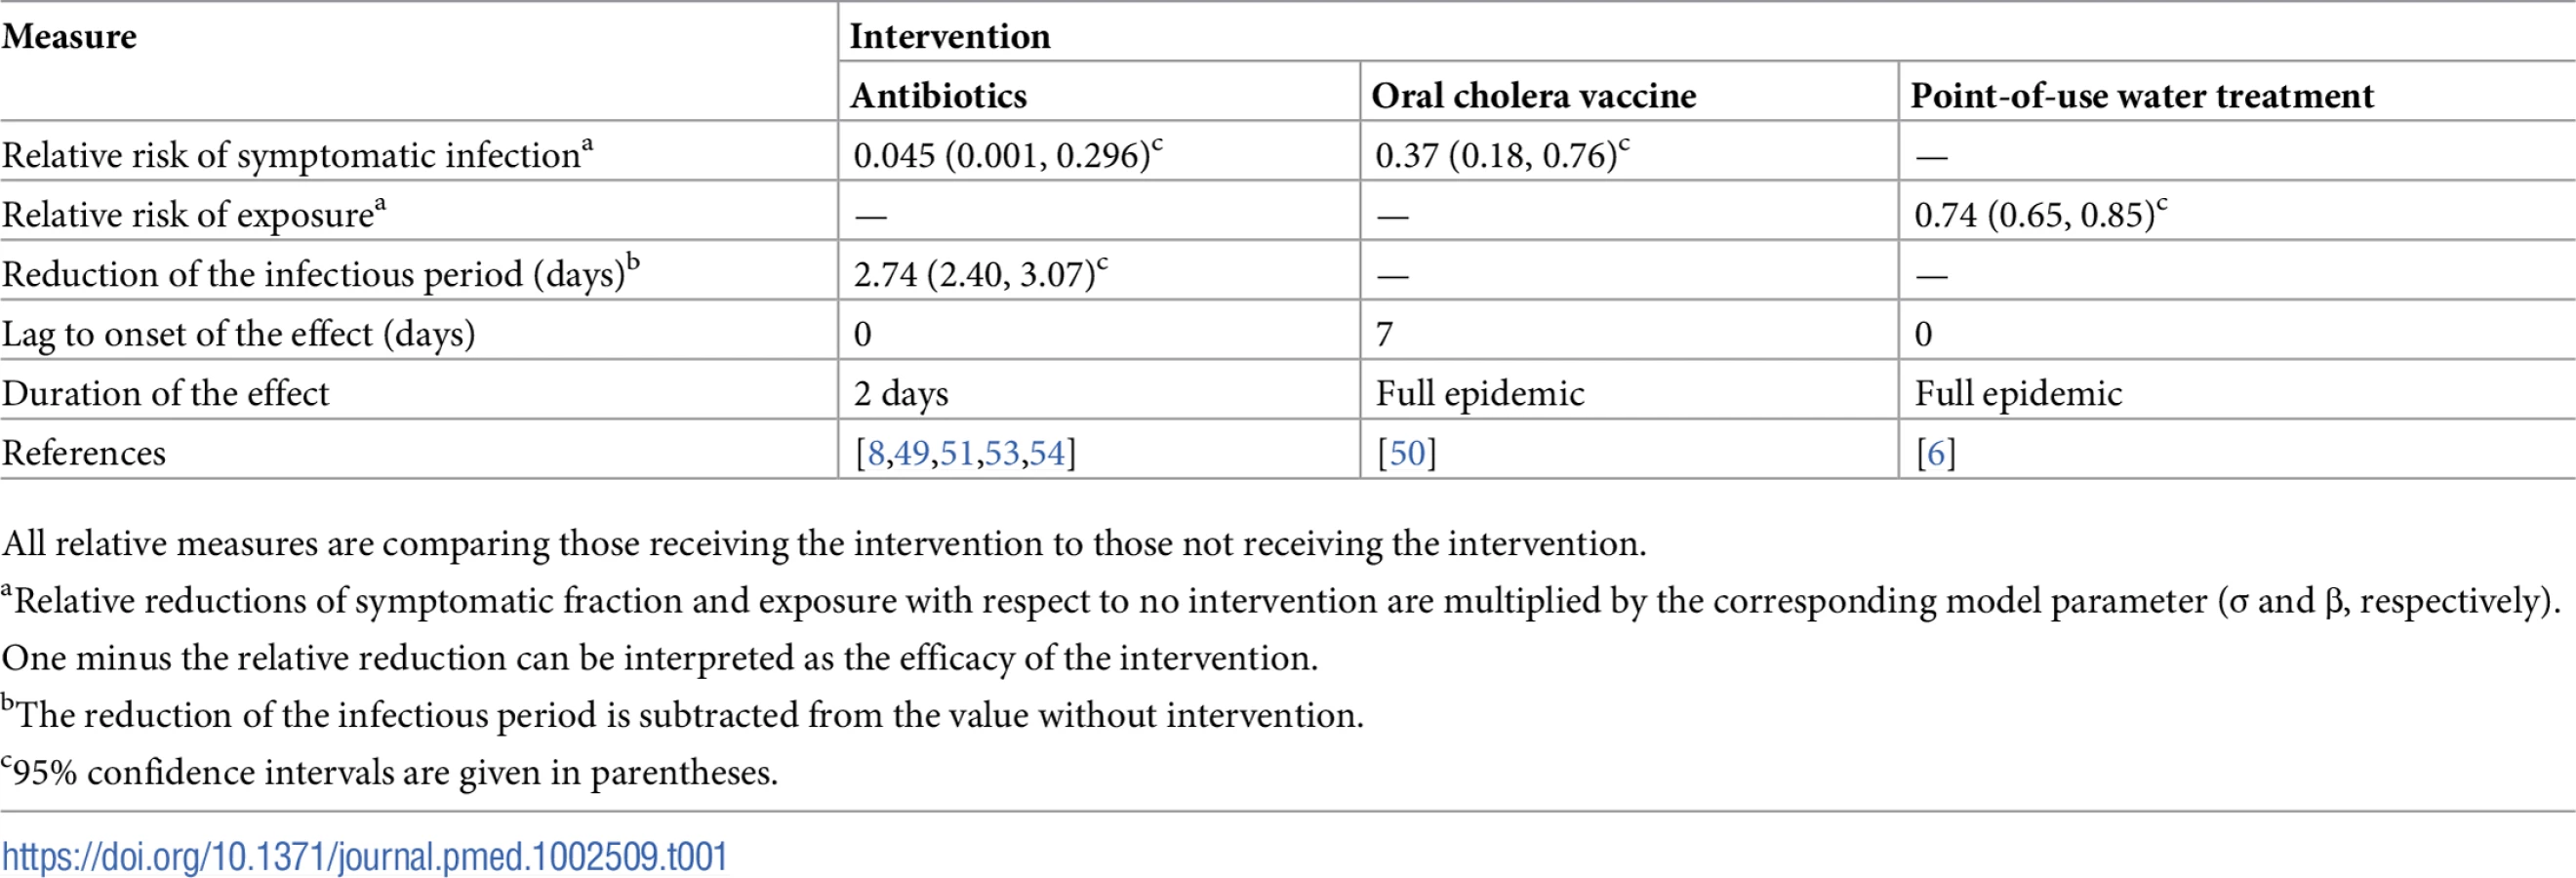
We evaluated 3 types of interventions both individually and in combination: the administration of a single dose of antibiotics (e.g., azithromycin), the administration of a single dose of OCV, and a POUWT intervention (Fig 1A). We reconstructed probability distributions (S14 Fig) for each of the intervention effects, with mean effect sizes and measures of variability derived from the literature (Table 1), and drew from these distributions in simulations. A detailed description of the effects of the 3 types of interventions and their implementation is given in S1 Text. Antibiotics and OCV were assumed to reduce an individual’s probability of becoming symptomatic if infected [49,50]. In addition, we assumed that antibiotics reduce a symptomatic individual’s infectious period [51]. Given the limited cholera-specific effectiveness data for POUWT (or any WaSH intervention [52]), we based our estimate of effectiveness on a meta-analysis of POUWT interventions in urban/peri-urban areas on all cause diarrhea [6]. We assumed that POUWT leads to a 26% reduction in exposure to Vibrio cholerae and thus reduces the probability of getting infected [6]. While we assumed that antibiotics and POUWT provide immediate protection, we considered OCV to be fully effective after a lag of 7 days (with 0 efficacy before), based on the design of a clinical trial assessing its efficacy [50]. The effects of antibiotics were assumed to last for 2 days [53], whereas protection from OCV and POUWT was assumed to last through the end of each epidemic. In our main analyses, a person can receive prophylactic antibiotics only once during the entire epidemic even if they live within overlapping targeted areas at different times. In secondary analyses, we included a scenario where a person is eligible for antibiotics each time he/she is in a targeted cluster, provided there has been at least a 2-week gap since the last time he/she was targeted with antibiotics (S1 Text).
In our model, CATIs are implemented by targeting people within a given radius (15, 30, 45, 70, or 100 m; S13 Fig) around each reported (i.e., symptomatic) case. In N’Djamena, rings of those radii contain an average (range) of 9 (2 to 21), 42 (5 to 76), 75 (10 to 120), 167 (14 to 263), and 295 (55 to 456) people, respectively (S12 Fig).
To account for the fact that an intervention team visiting a target cluster would not be able to reach all inhabitants because they might be absent, be unwilling to receive the intervention, not comply with interventions, or be under 1 year of age (minimum age for antibiotics and OCV), we assumed that a random sample of 70% of the target population can be effectively reached [18]. We accounted for a variable delay between the onset of symptoms of the initial case and the deployment of an intervention team to the target area based on data from South Sudan and other settings [18]; the delay was drawn from a distribution ranging from 0 to 7 days with a mode of 2 (S16 Fig). Of note, our mechanistic modeling approach implicitly accounts for the fact that with longer intervention delays, the proportion of case neighbors already immune to cholera increases.
To understand the relative value of CATIs, we compared their impact and efficiency with (1) small mass campaigns within the entire city, assuming that the same total number of people gets targeted, (2) mass intervention campaigns reaching 70% of the city population, and (3) mass intervention campaigns targeted to the 3 districts with the highest attack rate at the start of the campaign with 70% coverage in each (S1 Text). To provide an estimate of the logistical implications, we also computed the number of rings that were targeted per day with different CATIs.
As timing is key in controlling outbreaks, we considered 3 different scenarios for the start of interventions (CATIs and mass campaigns). Interventions started during the early (stable) phase in the epidemic (day 50 of the epidemic, May 31), around the peak of the epidemic (day 130, August 19), or late, as the epidemic is declining after the peak (day 180, October 8) (Fig 2). Whereas randomly allocated interventions and mass campaigns were presumed to take 2 weeks to complete (with the same number of interventions administered every day), we assumed that CATIs continue until the end of the simulated epidemic (e.g., no more exposed nor infected individuals in the model) or until the maximum simulation time of 1 year.
Results
Calibration
The calibrated model reproduced key characteristics of the 2011 epidemic in N’Djamena, including the epidemic curve and the spatiotemporal clustering of cases (τ; Fig 2). In simulated uncontrolled epidemics, a median of 3,381 (IQR 1,535 to 5,811) cases occurred, with epidemics lasting a median of 262 (IQR 218 to 311) days. In the calibrated model, individuals living within 15 m to 45 m of a cholera case had a 12.1-fold (IQR 10.1 to 13.9) greater risk than the general population of becoming a cholera case within 5 days of the primary case developing symptoms (Fig 2B). The posterior distributions of fitted parameters are shown in S3 Fig.
Individual interventions
Each of the primary interventions—POUWT, OCV, and antibiotics—rapidly decreased incidence when targeted to individuals living within 100 m of a case (Fig 3) and reduced the duration of epidemics. Antibiotics led to the sharpest short-term reduction in incidence due to the high degree of short-term protection. However, the rate of incidence reduction was not sustained due to the short-lasting protection of antibiotics.

POUWT and OCV led to faster extinction of outbreaks than antibiotics (Fig 4; Table 2). When interventions started early (day 50; Fig 2), OCV reduced epidemic durations by 68% (IQR 62% to 72%), POUWT by 21% (IQR 7% to 35%), and antibiotics by 2% (IQR −11% to 8%). When interventions started around the peak (day 130), epidemics were shortened by 35% (IQR 26% to 44%) using OCV, by 15% (IQR 4% to 24%) using POUWT, and by 2% (IQR −9% to 14%) using antibiotics. Even when intervening late in epidemics (day 180), each of the interventions truncated the epidemic, with a 24% (IQR 14% to 35%) reduction from OCV, 11% (IQR 2% to 21%) from POUWT, and 3% (IQR −7% to 14%) from antibiotics. We found similar qualitative results when interventions were targeted to different radii around incident cholera cases (S1 Table).


The number of cases averted by CATIs focused within 100 m from cases varied and depended on the timing and type of intervention (Table 2; Fig 5A). When interventions started close to the peak of the epidemic, the reduction in cases compared to uncontrolled epidemics for CATIs within 100 m was 43% (IQR 35% to 49%) with OCV alone, 20% (IQR 14% to 27%) with POUWT alone, and 14% (IQR 6% to 21%) with antibiotics alone. Regardless of the intervention type, more cases were averted when interventions were initiated earlier in the epidemic. Interventions that averted more cases in a shorter period of time reduced the duration of epidemics and ultimately required less resources (i.e., number of people and clusters targeted) (Fig 5B and 5C).

Combined interventions
Combinations of the different interventions, each with its own mechanism of protection, led to larger, quicker, and more robust impacts on the epidemic (Table 2). CATIs with OCV and antibiotics in a radius of 100 m from case households led to 70% (IQR 64% to 74%) shorter epidemics when started early, 37% (IQR 28% to 46%) shorter epidemics when started around the peak, and 25% (IQR 16% to 36%) shorter epidemics when started late (Fig 6). When combining OCV and POUWT in a 100-m radius, epidemics were shortened by 70% (IQR 65% to 75%), 38% (IQR 29% to 47%), and 25% (IQR 16% to 36%) when starting interventions early, around the peak, and late, respectively. CATIs with antibiotics and POUWT reduced epidemic durations by 26% (IQR 11% to 45%), 15% (IQR 5% to 25%), and 15% (IQR 5% to 23%) starting early, around the peak, and late, respectively.

Interventions in a radius of 100 m combining OCV with antibiotics and/or POUWT led to a similar number of cases averted. CATIs starting early during the epidemics reduced the cases by 83% (IQR 72% to 88%) using OCV and antibiotics, by 82% (IQR 71% to 88%) using OCV and POUWT, by 8% (IQR 5% to 13%) using POUWT and antibiotics, and by 83% (IQR 72% to 89%) when using all 3 types of intervention. When starting at the epidemic peak, OCV and antibiotics led to a 50% (IQR 41% to 55%) reduction in cases, with OCV and POUWT leading to a 47% (IQR 38% to 52%) reduction, antibiotics and POUWT to a 30% (IQR 24% to 36%) reduction, and all 3 types of intervention to a 51% (IQR 42% to 57%) reduction. Starting late during the epidemic, a combination of OCV and antibiotics resulted in 10% (IQR 6% to 16%) fewer cases, OCV and POUWT in 9% (IQR 5% to 14%) fewer cases, POUWT and antibiotics in 8% (IQR 5% to 13%) fewer cases, and all 3 interventions in 11% (IQR 7% to 16%) fewer cases.
Intervention ring size
For OCV and POUWT, the number of averted cases steadily increased with the CATI radius until 70 to 100 m. For CATIs with antibiotics, the curves of averted cases by ring radius peaked at 30 m, roughly 2 to 3 times as high as at 100 m, and similar to OCV at 100 m (Fig 7A–7C). This effect results from the short-lasting protection from antibiotics in combination with the limitation that every person can only be targeted once. The epidemic wave arrives at distances farther from the primary case after the protective effect from antibiotics has already vanished. For all 3 types of intervention, the ring size that led to the most efficient reduction in cases was similar regardless of the intervention timing. However, the number of clusters targeted decreased with increasing ability to rapidly stop epidemics (Fig 7G–7I). The number of persons targeted over different radii was governed by 2 contrasting effects, a decrease with better performing interventions and an increase with larger cluster radii (Fig 7D–7F).

Efficiency of CATIs and comparison to mass intervention campaigns
The most efficient type of CATI in a radius of 100 m was OCV, with 1.6 (IQR 1.0 to 2.6) people targeted per case averted when starting interventions early, 7.4 (IQR 5.8 to 10) when starting around the peak, and 31 (IQR 17 to 53) when starting late (Fig 8B). For POUWT, the number of people targeted per case averted was 7.1 (IQR 4.0 to 12) when starting interventions early, 23 (IQR 15 to 35) when starting around the peak, and 47 (IQR 26 to 90) when starting late. For antibiotics, it was 16 (IQR 7.1 to 33) when starting early, 33 (IQR 20 to 58) when starting around the peak, and 46 (IQR 27 to 79) when starting late.

Mass intervention strategies, where a large proportion (i.e., 70% in our case, corresponding to approximately 700,000 people) of the city population was targeted in a short time period, achieved similar numbers of averted cases (S6 Fig), but typically required hundreds to tens of thousands of people to be targeted in order to avert a single case. For an intervention campaign starting around the epidemic peak, CATIs within a radius of 100 m were 58 times (IQR 36 to 112) more efficient than a mass intervention campaign using OCV and 43 times (IQR 25 to 85) more efficient using POUWT.
To gauge the relative value of spatial targeting of interventions, we simulated small mass campaigns allocating the same number of doses as used by CATIs throughout the entire city. This mode of intervention did not effectively stop epidemics nor reliably avert significant numbers of cases (S7 Fig), with almost 50% of the simulated epidemics with interventions showing no improvement. When taking into account only simulated epidemics with a positive number of averted cases, CATIs starting around the epidemic peak in a 100-m ring around a primary case led to a 6-fold (IQR 3 to 11) higher reduction in cases using OCV and a 3-fold (IQR 2 to 7) higher reduction using POUWT than their non-targeted counterparts.
As mass interventions are not often applied to an entire city (due to limited resources, especially of OCV [11]), we simulated mass campaigns targeting 70% of the population of the 3 (out of 10) districts with the highest attack rate at the time of intervention (district-targeted campaigns). The number of cases averted using this approach was similar to that achieved with CATIs, but the number of people targeted was considerably higher (up to 300,000 people; S6 Fig) and epidemics typically lasted longer. District-targeted campaigns with OCV shortened epidemics by 37% (IQR 12% to 61%) when started early, by 21% (IQR 11% to 32%) when started at the epidemic peak, and by 15% (IQR 4% to 25%) when started late. In campaigns with POUWT alone, epidemics were shortened by 9% (IQR −5% to 24%), 8% (IQR −2% to 18%), and 6% (IQR −3% to 17%) starting early, at peak, and late, respectively. Combining both OCV and POUWT led to 38% (IQR 11% to 62%) shorter epidemics when starting early, 24% (IQR 12% to 33%) shorter epidemics when starting at peak time, and 15% (IQR 5% to 25%) shorter epidemics when starting late. The number of people needed to target per case averted with a district-targeted campaign starting early was 44 (IQR 27 to 78) times higher than for CATIs within a radius of 100 m with OCV, 18 (IQR 8 to 40) times higher than for CATIs with POUWT, and 50 (IQR 33 to 93) times higher than for CATIs with OCV and POUWT combined (Fig 8).
Operational considerations
The maximum number of rings needed to target per day varied with intervention type and timing of the start of interventions and was lower for interventions that truncated epidemics faster (Table 3). For CATIs with OCV alone, a maximum of 13 (IQR 9 to 19) rings per day needed to be targeted when starting early in a radius of 100 m. Adding POUWT to this reduced the maximum number of rings to 11 (IQR 8 to 16). The average number of rings needed to target each day was considerably lower, at 4.1 (IQR 2.7 to 6.0) rings per day for OCV and 3.7 (IQR 2.5 to 5.3) rings per day for OCV and POUWT, starting early with a radius of 100 m around reported cases.

Sensitivity analyses
We performed several sensitivity analyses to explore the impact of key model assumptions on our results. These analyses related to assumptions about the natural history of cholera, transmission pathways, and mechanisms by which interventions protect, and assumptions related to more practical elements. Detailed descriptions of the implementation and results of the sensitivity analyses are reported in S1 Text.
In our primary analyses, we assumed that asymptomatically infected individuals are not infectious, based on the evidence that they produce far less stool and that the stool they do produce contains V. cholerae for less time and of orders of magnitude lower concentration than symptomatic cases [45,46,55]. To explore if the shedding of V. cholerae by asymptomatic individuals may have an influence on intervention outcomes, we recalibrated the model and ran additional simulations assuming that each asymptomatic person was 10% as infectious as a symptomatic patient for a single day after infection. The results suggest that allowing asymptomatic individuals to be infectious reduced the overall impact of CATIs, both in terms of cases averted and epidemic time reduced. However, the overall rank order of different interventions did not change (S23 Fig). For example, using CATIs with OCV in a 100-m radius around the peak of an epidemic in a model with infectious asymptomatic individuals led to a 21% (IQR 15% to 31%) reduction in cases averted compared to a 43% (IQR 35% to 49%) reduction in our primary analysis.
In our main analysis, all symptomatic cases were assumed to be detected and followed with a CATI deployment. However, this is unlikely to be the case in reality for a variety of reasons related to inadequacies in surveillance, care-seeking behavior, and logistical constraints. To explore how imperfect CATI response could impact our main findings, we reran simulations targeting OCV at a 100-m radius around a fraction (5%–100%) of symptomatic cases. Results suggest that CATIs responding to as few as 40% of symptomatic cases led to similar impact in terms of cases averted and epidemic days truncated (S20 and S21 Figs). Targeting 100-m rings around 40% of all symptomatic cases with OCV around the peak of an epidemic led to 38% (IQR 30% to 44%) fewer cases than simulations without interventions, and the epidemic duration was reduced by 31% (IQR 22% to 41%). As expected, when targeting CATIs within 100 m around very few symptomatic cases (5%), we saw a significant decrease in the intervention effect.
In our primary analyses, we assumed that POUWT interventions reduce the likelihood of infection by reducing exposure to V. cholerae. However, it may be that POUWT reduces the likelihood of becoming symptomatic given the clear dose–response relationship seen in a human challenge model of V. cholerae O1 [46,56,57]. To understand how this mechanistic assumption impacts our primary results, we reran simulations assuming POUWT reduced the risk of symptomatic infection by 74% (95% CI 65% to 85%) instead of reducing exposure. With this alternative POUWT mechanism, CATIs implemented within 100 m around case households led to a larger impact (cases and epidemic days averted) than in our primary analysis (S22 Fig). For example, when intervening around the peak of an epidemic in a radius of 100 m, the number of cases was reduced by 39% (IQR 31% to 44%) and the epidemic duration was reduced by 25% (IQR 16% to 34%), compared with 20% (IQR 14% to 27%) and 15% (IQR 4% to 24%), respectively, in the primary analyses.
Finally, the structure of our model makes long-distance transmission events, which cause the rapid spread of the disease from one neighborhood to another by the means of travelers and commuters [30,42], unlikely to occur. We thus performed sensitivity analyses investigating the influence of adding long-distance transmission events to the model and found that the results were qualitatively similar to those of the primary analyses (S1 Text; S16–S19 Figs).
Discussion
Using a spatially explicit transmission model fit to data from a large cholera outbreak in Chad, we found that CATIs using OCV, antibiotics, and/or POUWT have the potential to efficiently and effectively mitigate the impact of cholera epidemics in similar urban areas. Of the 3 intervention types explored, OCV most effectively stopped epidemics (e.g., simulated epidemic durations were cut by a third when CATIs started around the epidemic peak and by a fourth when started late in the epidemic), whereas antibiotics had a more pronounced short-term impact. Combinations of the 3 types of interventions can be used to further reduce cases and deaths, although the combinations, as modeled, did not lead to synergistic effects. Our findings suggest that CATIs, which require targeting tens to hundreds of persons per case averted, are far more resource-efficient than mass intervention campaigns, which typically require hundreds to tens of thousands of people to be targeted per case averted. The optimal ring size around a case depends on the type of intervention. For antibiotics, which offer only short-term protection, the optimal CATI radius is around 30 m to 45 m, whereas for OCV and POUWT, which offer longer-lasting protection, the intervention impact increases until CATI radii reach 70 m to 100 m.
Visiting case households is not new to public health [58–60] nor to cholera control [7]. In a number of countries, it is standard practice to visit the households of cholera cases to provide health hygiene education, soap, and sometimes water and or latrine disinfectants and antibiotics [7,18]. While our findings suggest that CATIs work well even when only a fraction of cases are targeted, rapid detection and confirmation of cases is key to maximizing impact. The use of cholera rapid tests may provide one avenue for improving the precision and timeliness of CATIs given that traditional diagnostics (i.e., culture) require days to complete for some patients [61]. CATIs are logistically complex to implement and require well-trained, highly mobile teams that rapidly visit case households, delimit target areas, transport necessary supplies, and deliver interventions.
Knowing that an average of 295 (range 55 to 456) people live in each 100-m ring in N’Djamena (and similar African cities with cholera like Conakry, Monrovia, Lubumbashi, or Nairobi [62]; S12 Fig), and that several rings may overlap, the number of rings that are to be targeted each day during different variants of CATIs can provide understanding of the number of teams required to implement interventions. Other challenges to CATI implementation include finding cases’ households and negotiating with local leaders to efficiently deliver the interventions.
While our study suggests that CATIs can be effective and efficient, it remains unclear when this approach should be used, particularly in contrast to mass campaigns, the current standard for outbreak response. As shown, early CATIs can have profound impacts on the trajectory of an epidemic. If resources such as OCV are limited, as they are at the time of writing this paper, CATIs may be the most appropriate strategy to target those at highest risk. When only a few cases are detected, especially when they are spatially dispersed, ministries of health may want to initiate CATIs to efficiently quell the epidemic with supplies already in the country, while making contingency plans for mass interventions if the epidemic continues to grow. Finally, these strategies may be used late in epidemics or epidemic seasons, possibly after a mass campaign, to quickly stop the often protracted tails of epidemics [18,63], which can ultimately save scarce health system resources used during time periods when an epidemic is officially ongoing. CATIs with POUWT interventions, focused on larger geographical units (villages) than simulated in this paper, are currently being deployed to fight the cholera epidemic in Haiti through rapid response teams, although their effectiveness in reducing cases and deaths remains unknown [21].
Prophylactic antibiotic use is not part of most guidelines on cholera prevention and control; however, a number of countries, like Kenya, use antibiotics for household contacts as part of their standard outbreak response. Our results suggest that antibiotics could play a role in CATIs, although the potential impact appears lower than for other interventions in the main analyses. It is unclear how a short (or single-dose) course of antibiotics used in CATIs would affect short - and long-term antimicrobial resistance profiles in the community. Any decision to use CATIs with antibiotics should be accompanied by increased antimicrobial resistance monitoring in the community [64].
While our study used a rigorous approach to calibrate the models and capture uncertainty in both the epidemic processes and the intervention effects, it comes with a number of limitations. First, cases used in these analyses were suspected cholera cases, only some of which were confirmed [29]. If confirmed cases represent a simple random proportion of suspected cases (in terms of space and time), our characterization of space–time clustering should not be affected [32]. It is possible that cases living around other cases are more likely to present for care, which could lead to an artificial increase in our estimates of the space–time clustering of cases, meaning that our estimated impact of CATIs could be overly optimistic. However, given that estimates of space–time clustering have been relatively similar across settings with different surveillance systems and health-seeking behavior [22,25,29], we do not believe that this is likely to cause major biases in this study.
We made a number of assumptions related to cholera transmission processes. In our main analyses we assumed that asymptomatic individuals were not infectious based on evidence that asymptomatic individuals have an orders-of-magnitude lower concentration of bacteria in their stool, shed virus for less time, and excrete less stool [45]. In sensitivity analyses, we found that the results were qualitatively similar when this assumption was relaxed although the overall impact of CATIs was diminished. We did not account for a potential hyperinfectious state, where freshly shed V. cholerae may be orders of magnitude more infectious [65,66]. However, if the hyperinfectious state plays an important role in transmission, we expect that it would be in part reflected by clustering at short distances, which should be accounted for in our model through the τ fitting of the function.
The quantification of the effects and mechanisms of each intervention were based on limited data. The purpose of this study was to explore the impact of CATIs over the course of a single outbreak, disregarding the long-term effects of interventions, which may influence future epidemics. Given that the effectiveness of OCV and POUWT interventions likely wane differently over time, it is possible that there are different optimal mixes of interventions depending on the timescale of interest. The protective effects assumed for prophylactic antibiotic use were based on meta-analyses, clinical studies, and modeling studies (S1 Text) representative of the current state of evidence, some of which only included data on post-exposure antibiotic use. However, as pointed out by a recent meta-analysis [8], the studies supporting the effectiveness of prophylactic antibiotic use have a high risk of bias. We incorporated modest variability in the protective effects given the limited and sometimes weak data and the diversity of different drugs studied in the literature [51]. We assumed that antibiotic effects lasted only 2 days based on a review of the literature and consultations with experts; however, if the duration was longer, we expect that the impact of antibiotics would be larger than our results suggest. For OCV, we assumed that a single-dose regimen had an efficacy of 67% for the duration of an outbreak although there exists only 1 clinical trial estimating the single-dose efficacy—in Bangladesh over a 6-month period, where cholera is highly endemic [50]—and 1 observational study, in South Sudan, measuring short-term protection in the first 2 months after vaccination [15].
While there are a variety of WaSH interventions used to fight cholera [6], we chose to model POUWT as it is often a key WaSH intervention in outbreak settings. POUWT interventions come in different shapes and sizes and can only be effective if people appropriately comply with the intervention, which poses challenges to incorporating them into a generalizable model. We based the POUWT effect estimate on a meta-analysis of diarrhea reductions from POUWT interventions conducted in a variety of settings, including some that do not regularly report cholera cases (e.g., Bolivia) [6,67,68]. By using these estimates, we implicitly assumed that the reductions in cholera from POUWT interventions would be similar to reductions in diarrhea, which may not be the case if the diarrhea in the studies in the meta-analysis was caused by etiologic agents with different transmission pathways than cholera. For simplicity, in our main analysis we assumed that the entire mechanism of POUWT protection was to reduce the exposure probability to V. cholerae, although POUWT may both reduce exposure to water with V. cholerae and reduce the likelihood of becoming symptomatic by reducing the concentration of bacteria in any contaminated water [56]. With CATIs, it is likely that each household will have a single opportunity to receive behavior change messaging and training on using the POUWT intervention, which could lead to lower compliance, and thus lower effectiveness against cholera, than what we modeled, especially as the time since the household visit increases [68]. However, during outbreaks, mass behavior change campaigns (e.g., through radio) are common and may help sustain any changes in behavior catalyzed in the CATI household visit.
Although the modeled relative risk, τ, matches the observed data well, we did not fit τ at very short distances (i.e., between 0 m and 15 m from a case) as our model does not include household structure and is based on a grid of 30 m by 30 m cells. Small-scale spatial structure has been shown to have significant impact on transmission for other diseases [69], and neglecting it could lead to underestimation of the effect of CATIs in our model. This limitation means that we could not adequately capture the effects of targeting household contacts with interventions, which may be especially important for antibiotics [8,70].
Our results are based on a large number of epidemic trajectories of a model fit to a single outbreak; however, the relative impact of CATIs is largely shaped by the spatiotemporal clustering of cholera cases, which has been shown to be similar in both epidemic and endemic settings around the globe [22–29,61]. This commonality between the clustering of cholera cases provides reassurance that our findings may not only be representative of the potential impacts in this single outbreak but likely reflect (qualitatively) the impacts in other similar settings. Thus, we advocate that CATIs can be a promising approach to control cholera epidemics in urban areas. While the optimal target radius may vary between settings, due to population density and logistical constraints, antibiotic interventions will likely continue to have a smaller optimal radius than OCV and POUWT, because of the duration of protection and likely delays in responding to each ring, which are unlikely to vary significantly across settings.
Our results suggest that CATIs may be an effective and efficient approach to reducing morbidity and mortality and saving public health resources in cholera epidemics. While more work is needed to understand how and when to best use this approach in outbreaks across different settings, taking into account both human resource capacity and supply availability, our study provides data-based support to public health programs currently using CATIs to fight cholera.
Supporting Information
Zdroje
1. World Health Organization. Cholera, 2016. Wkly Epidemiol Rec. 2017;92(36):521–36. 28884993
2. Ali M, Nelson AR, Lopez AL, Sack DA. Updated global burden of cholera in endemic countries. PLoS Negl Trop Dis. 2015;9(6):e0003832. doi: 10.1371/journal.pntd.0003832 26043000
3. Luquero FJ, Rondy M, Boncy J, Munger A, Mekaoui H, Rymshaw E, et al. Mortality rates during cholera epidemic, Haiti, 2010–2011. Emerg Infect Dis. 2016;22(3):410–6. doi: 10.3201/eid2203.141970 26886511
4. Rebaudet S, Sudre B, Faucher B, Piarroux R. Cholera in coastal Africa: a systematic review of its heterogeneous environmental determinants. J Infect Dis. 2013;208(Suppl 1):S98–106. doi: 10.1093/infdis/jit202 24101653
5. Rebaudet S, Sudre B, Faucher B, Piarroux R. Environmental determinants of cholera outbreaks in inland Africa: a systematic review of main transmission foci and propagation routes. J Infect Dis. 2013;208(Suppl 1):S46–54. doi: 10.1093/infdis/jit195 24101645
6. Fewtrell L, Kaufmann RB, Kay D, Enanoria W, Haller L, Colford JM Jr. Water, sanitation, and hygiene interventions to reduce diarrhoea in less developed countries: a systematic review and meta-analysis. Lancet Infect Dis. 2005;5(1):42–52. doi: 10.1016/S1473-3099(04)01253-8 15620560
7. Guévart É, Noeske J, Sollé J, Mouangue A, Bikoti JM. Antibioprophylaxie ciblée à large échelle au cours de l’épidémie de choléra de Douala en 2004. Santé. 2007;17(2):63–8.
8. Reveiz L, Chapman E, Ramon-Pardo P, Koehlmoos TP, Cuervo LG, Aldighieri S, et al. Chemoprophylaxis in contacts of patients with cholera: systematic review and meta-analysis. PLoS ONE. 2011;6(11):e27060. doi: 10.1371/journal.pone.0027060 22102873
9. Desai SN, Pezzoli L, Martin S, Costa A, Rodriguez C, Legros D, et al. A second affordable oral cholera vaccine: implications for the global vaccine stockpile. Lancet Glob Health. 2016;4(4):e223–4. doi: 10.1016/S2214-109X(16)00037-1 27013303
10. Martin S, Costa A, Perea W. Stockpiling oral cholera vaccine. Bull World Health Organ. 2012;90(10):714. doi: 10.2471/BLT.12.112433 23109735
11. Parker LA, Rumunu J, Jamet C, Kenyi Y, Lino RL, Wamala JF, et al. Adapting to the global shortage of cholera vaccines: targeted single dose cholera vaccine in response to an outbreak in South Sudan. Lancet Infect Dis. 2017;17(4):e123–7. doi: 10.1016/S1473-3099(16)30472-8 28109819
12. Bhattacharya SK, Sur D, Ali M, Kanungo S, You YA, Manna B, et al. 5 year efficacy of a bivalent killed whole-cell oral cholera vaccine in Kolkata, India: a cluster-randomised, double-blind, placebo-controlled trial. Lancet Infect Dis. 2013;13(12):1050–6. doi: 10.1016/S1473-3099(13)70273-1 24140390
13. Bi Q, Ferreras E, Pezzoli L, Legros D, Ivers LC, Date K, et al. Protection against cholera from killed whole-cell oral cholera vaccines: a systematic review and meta-analysis. Lancet Infect Dis. 2017;17(10):1080–8. doi: 10.1016/S1473-3099(17)30359-6 28729167
14. Abubakar A, Azman AS, Rumunu J, Ciglenecki I, Helderman T, West H, et al. The first use of the global oral cholera vaccine emergency stockpile: lessons from South Sudan. PLoS Med. 2015;12(11):e1001901. doi: 10.1371/journal.pmed.1001901 26576044
15. Azman AS, Parker LA, Rumunu J, Tadesse F, Grandesso F, Deng LL, et al. Effectiveness of one dose of oral cholera vaccine in response to an outbreak: a case-cohort study. Lancet Glob Health. 2016;4(11):e856–63. doi: 10.1016/S2214-109X(16)30211-X 27765293
16. Ciglenecki I, Sakoba K, Luquero FJ, Heile M, Itama C, Mengel M, et al. Feasibility of mass vaccination campaign with oral cholera vaccines in response to an outbreak in Guinea. PLoS Med. 2013;10(9):e1001512. doi: 10.1371/journal.pmed.1001512 24058301
17. Ivers LC, Hilaire IJ, Teng JE, Almazor CP, Jerome JG, Ternier R, et al. Effectiveness of reactive oral cholera vaccination in rural Haiti: a case-control study and bias-indicator analysis. Lancet Glob Health. 2015;3(3):e162–8. doi: 10.1016/S2214-109X(14)70368-7 25701994
18. Parker LA, Rumunu J, Jamet C, Kenyi Y, Lino RL, Wamala JF, et al. Neighborhood-targeted and case-triggered use of a single dose of oral cholera vaccine in an urban setting: feasibility and vaccine coverage. PLoS Negl Trop Dis. 2017;11(6):e0005652. doi: 10.1371/journal.pntd.0005652 28594891
19. Piarroux R, Bompangue D, Oger PY, Boinet A, Haaser F, Vandevelde T. From research to field action: example of the fight against cholera in the Democratic Republic of Congo. Field Actions Sci Rep. 2009;2.
20. Farmer P, Almazor CP, Bahnsen ET, Barry D, Bazile J, Bloom BR, et al. Meeting cholera’s challenge to Haiti and the world: a joint statement on cholera prevention and care. PLoS Negl Trop Dis. 2011;5(5):e1145. doi: 10.1371/journal.pntd.0001145 21655350
21. Santa-Olalla P, Gayer M, Magloire R, Barrais R, Valenciano M, Aramburu C, et al. Implementation of an alert and response system in Haiti during the early stage of the response to the cholera epidemic. Am J Trop Med Hyg. 2013;89(4):688–97. doi: 10.4269/ajtmh.13-0267 24106196
22. Debes AK, Ali M, Azman AS, Yunus M, Sack DA. Cholera cases cluster in time and space in Matlab, Bangladesh: implications for targeted preventive interventions. Int J Epidemiol. 2016;45(6):2134–9. doi: 10.1093/ije/dyw267 27789673
23. Snow J. On the mode of communication of cholera. John Churchill; 1855.
24. Blackburn JK, Diamond U, Kracalik IT, Widmer J, Brown W, Morrissey BD, et al. Household-level spatiotemporal patterns of incidence of cholera, Haiti, 2011. Emerg Infect Dis. 2014;20(9):1516–9. doi: 10.3201/eid2009.131882 25148590
25. Ali M, Debes AK, Luquero FJ, Kim DR, Park JY, Digilio L, et al. Potential for controlling cholera using a ring vaccination strategy: re-analysis of data from a cluster-randomized clinical trial. PLoS Med. 2016;13(9):e1002120. doi: 10.1371/journal.pmed.1002120 27622507
26. Luquero FJ, Banga CN, Remartnez D, Palma PP, Baron E, Grais RF. Cholera epidemic in Guinea-Bissau (2008): the importance of “place”. PLoS ONE. 2011;6(5):e19005. doi: 10.1371/journal.pone.0019005 21572530
27. You YA, Ali M, Kanungo S, Sah B, Manna B, Puri M, et al. risk map of cholera infection for vaccine deployment: the eastern Kolkata case. PLoS ONE. 2013;8(8):e71173. doi: 10.1371/journal.pone.0071173 23936491
28. Carrel M, Emch M, Streatfield PK, Yunus M. Spatio-temporal clustering of cholera: the impact of flood control in Matlab, Bangladesh, 1983–2003. Health Place. 2009;15(3):771–82. doi: 10.1016/j.healthplace.2008.12.008 19217821
29. Azman A, Luquero FJ, Salje H, Naibei N, Adalbert N, Ali M, et al. Micro-hotspots of risk in urban cholera epidemics. bioRxiv. 2018 Jan 18. doi: 10.1101/248476
30. Azman AS, Lessler J. Reactive vaccination in the presence of disease hotspots. Proc Biol Sci. 2015;282(1798):20141341. doi: 10.1098/rspb.2014.1341 25392464
31. Azman AS, Rumunu J, Abubakar A, West H, Ciglenecki I, Helderman T, et al. Population-level effect of cholera vaccine on displaced populations, South Sudan, 2014. Emerg Infect Dis. 2016;22(6):1067–70. doi: 10.3201/eid2206.151592 27192187
32. Lessler J, Salje H, Grabowski MK, Cummings DAT. Measuring spatial dependence for infectious disease epidemiology. PLoS ONE. 2016;11(5):e0155249. doi: 10.1371/journal.pone.0155249 27196422
33. Salje H, Lessler J, Endy TP, Curriero FC, Gibbons RV, Nisalak A, et al. Revealing the microscale spatial signature of dengue transmission and immunity in an urban population. Proc Natl Acad Sci U S A. 2012;109(24):9535–8. doi: 10.1073/pnas.1120621109 22645364
34. Grabowski MK, Lessler J, Redd AD, Kagaayi J, Laeyendecker O, Ndyanabo A, et al. The role of viral introductions in sustaining community-based HIV epidemics in rural Uganda: evidence from spatial clustering, phylogenetics, and egocentric transmission models. PLoS Med. 2014;11(3):e1001610. doi: 10.1371/journal.pmed.1001610 24595023
35. Salje H, Cauchemez S, Alera MT, Rodriguez-Barraquer I, Thaisomboonsuk B, Srikiatkhachorn A, et al. Reconstruction of 60 years of chikungunya epidemiology in the Philippines demonstrates episodic and focal transmission. J Infect Dis. 2016;213(4):604–10. doi: 10.1093/infdis/jiv470 26410592
36. Salje H, Lessler J, Berry IM, Melendrez MC, Endy T, Kalayanarooj S, et al. Dengue diversity across spatial and temporal scales: local structure and the effect of host population size. Science. 2017;355(6331):1302–6. doi: 10.1126/science.aaj9384 28336667
37. Esch T, Schenk A, Ullmann T, Thiel M, Roth A, Dech S. Characterization of land cover types in TerraSAR-X images by combined analysis of speckle statistics and intensity information. IEEE Trans Geosci Remote Sens. 2011;49(6):1911–25. doi: 10.1109/TGRS.2010.2091644
38. Esch T, Heldens W, Hirner A, Keil M, Marconcini M, Roth A, et al. Breaking new ground in mapping human settlements from space—the Global Urban Footprint. ISPRS J Photogramm Remote Sens. 2017;134 : 30–42. doi: 10.1016/j.isprsjprs.2017.10.012
39. Rinaldo A, Bertuzzo E, Mari L, Righetto L, Blokesch M, Gatto M, et al. Reassessment of the 2010–2011 Haiti cholera outbreak and rainfall-driven multiseason projections. Proc Natl Acad Sci U S A. 2012;109(17):6602–7. doi: 10.1073/pnas.1203333109 22505737
40. de Magny GC, Thiaw W, Kumar V, Manga NM, Diop BM, Gueye L, et al. Cholera outbreak in Senegal in 2005: was climate a factor? PLoS ONE. 2012;7(8):e44577. doi: 10.1371/journal.pone.0044577 22952995
41. Gaudart J, Rebaudet S, Barrais R, Boncy J, Faucher B, Piarroux M, et al. Spatio-temporal dynamics of cholera during the first year of the epidemic in Haiti. PLoS Negl Trop Dis. 2013;7(4):e2145. doi: 10.1371/journal.pntd.0002145 23593516
42. Finger F, Genolet T, Mari L, de Magny GC, Manga NM, Rinaldo A, et al. Mobile phone data highlights the role of mass gatherings in the spreading of cholera outbreaks. Proc Natl Acad Sci U S A. 2016;113(23):6421–6. doi: 10.1073/pnas.1522305113 27217564
43. Ngwa MC, Liang S, Kracalik IT, Morris L, Blackburn JK, Mbam LM, et al. Cholera in Cameroon, 2000–2012: spatial and temporal analysis at the operational (health district) and sub climate levels. PLoS Negl Trop Dis. 2016;10(11):e0005105. doi: 10.1371/journal.pntd.0005105 27855171
44. Azman AS, Rudolph KE, Cummings DAT, Lessler J. The incubation period of cholera: a systematic review. J Infect. 2013;66(5):432–8. doi: 10.1016/j.jinf.2012.11.013 23201968
45. Nelson EJ, Harris JB, Glenn Morris J, Calderwood SB, Camilli A. Cholera transmission: the host, pathogen and bacteriophage dynamic. Nat Rev Microbiol. 2009;7(10):693–702. doi: 10.1038/nrmicro2204 19756008
46. Fung ICH. Cholera transmission dynamic models for public health practitioners. Emerging Themes in Epidemiology. 2014;11 : 1. doi: 10.1186/1742-7622-11-1 24520853
47. Kaper JB, Morris JG, Levine MM. Cholera. Clin Microbiol Rev. 1995;8(1):48–86. 7704895
48. Akeret J, Refregier A, Amara A, Seehars S, Hasner C. Approximate Bayesian computation for forward modeling in cosmology. J Cosmol Astropart Phys. 2015;2015(08):043. doi: 10.1088/1475-7516/2015/08/043
49. Lewnard JA, Antillón M, Gonsalves G, Miller AM, Ko AI, Pitzer VE. Strategies to prevent cholera introduction during international personnel deployments: a computational modeling analysis based on the 2010 Haiti outbreak. PLoS Med. 2016;13(1):e1001947. doi: 10.1371/journal.pmed.1001947 26812236
50. Qadri F, Wierzba TF, Ali M, Chowdhury F, Khan AI, Saha A, et al. Efficacy of a single-dose, inactivated oral cholera vaccine in Bangladesh. N Engl J Med. 2016;374(18):1723–32. doi: 10.1056/NEJMoa1510330 27144848
51. Leibovici-Weissman Y, Neuberger A, Bitterman R, Sinclair D, Salam MA, Paul M. Antimicrobial drugs for treating cholera. Cochrane Database Syst Rev. 2014;6:CD008625.
52. Taylor DL, Kahawita TM, Cairncross S, Ensink JHJ. The impact of water, sanitation and hygiene interventions to control cholera: a systematic review. PLoS ONE. 2015;10(8):e0135676. doi: 10.1371/journal.pone.0135676 26284367
53. Khan WA, Saha D, Rahman A, Salam MA, Bogaerts J, Bennish ML. Comparison of single-dose azithromycin and 12-dose, 3-day erythromycin for childhood cholera: a randomised, double-blind trial. Lancet. 2002;360(9347):1722–7. doi: 10.1016/S0140-6736(02)11680-1 12480424
54. Echevarria J, Seas C, Carrillo C, Mostorino R, Ruiz R, Gotuzzo E. Efficacy and tolerability of ciprofloxacin prophylaxis in adult household contacts of patients with cholera. Clin Infect Dis. 1995;20(6):1480–4. doi: 10.1093/clinids/20.6.1480 7548495
55. Cash RA, Music SI, Libonati JP, Snyder MJ, Wenzel RP, Hornick RB. Response of man to infection with Vibrio cholerae. I. Clinical, serologic, and bacteriologic responses to a known inoculum. J Infect Dis. 1974;129(1):45–52. doi: 10.1093/infdis/129.1.45 4809112
56. Hornick RB, Music SI, Wenzel R, Cash R, Libonati JP, Snyder MJ, et al. The Broad Street pump revisited: response of volunteers to ingested cholera vibrios. Bull N Y Acad Med. 1971;47(10):1181–91. 5286453
57. Grad YH, Miller JC, Lipsitch M. Cholera modeling: challenges to quantitative analysis and predicting the impact of interventions. Epidemiology. 2012;23(4):523–30. doi: 10.1097/EDE.0b013e3182572581 22659546
58. Hitchings MDT, Grais RF, Lipsitch M. Using simulation to aid trial design: ring-vaccination trials. PLoS Negl Trop Dis. 2017;11(3):e0005470. doi: 10.1371/journal.pntd.0005470 28328984
59. Kucharski AJ, Eggo RM, Watson CH, Camacho A, Funk S, Edmunds WJ. Effectiveness of ring vaccination as control strategy for Ebola virus disease. Emerg Infect Dis. 2016;22(1):105–8. doi: 10.3201/eid2201.151410 26691346
60. Merler S, Ajelli M, Fumanelli L, Parlamento S, y Piontti AP, Dean NE, et al. Containing Ebola at the source with ring vaccination. PLoS Negl Trop Dis. 2016;10(11):e0005093. doi: 10.1371/journal.pntd.0005093 27806049
61. Debes AK, Ateudjieu J, Guenou E, Lopez AL, Bugayong MP, Retiban PJ, et al. Evaluation in Cameroon of a novel, simplified methodology to assist molecular microbiological analysis of V. cholerae in resource-limited settings. PLoS Negl Trop Dis. 2016;10(1):e0004307. doi: 10.1371/journal.pntd.0004307 26735969
62. Cox W. Demographia world urban areas. 13th annual edition. Belleville (IL): Demographia; 2017 [cited 2018 Jan 22]. Available from: http://www.demographia.com/db-worldua.pdf.
63. Rebaudet S, Gazin P, Barrais R, Moore S, Rossignol E, Barthelemy N, et al. The dry season in Haiti: a window of opportunity to eliminate cholera. PLoS Curr. 2013 Jun 10. doi: 10.1371/currents.outbreaks.2193a0ec4401d9526203af12e5024ddc 23873011
64. Wernli D, Jørgensen PS, Harbarth S, Carroll SP, Laxminarayan R, Levrat N, et al. Antimicrobial resistance: the complex challenge of measurement to inform policy and the public. PLoS Med. 2017;14(8):e1002378. doi: 10.1371/journal.pmed.1002378 28817562
65. Hartley DM, Morris JG Jr, Smith DL. Hyperinfectivity: a critical element in the ability of V. cholerae to cause epidemics? PLoS Med. 2006;3(1):e7. doi: 10.1371/journal.pmed.0030007 16318414
66. Faruque SM, Biswas K, Udden SMN, Ahmad QS, Sack DA, Nair GB, et al. Transmissibility of cholera: in vivo-formed biofilms and their relationship to infectivity and persistence in the environment. Proc Natl Acad Sci U S A. 2006;103(16):6350–5. doi: 10.1073/pnas.0601277103 16601099
67. Fewtrell L, Colford JM Jr. Water, sanitation and hygiene: interventions and diarrhoea—a systematic review and meta-analysis. Washington (DC): World Bank; 2004.
68. Clasen T, Schmidt WP, Rabie T, Roberts I, Cairncross S. Interventions to improve water quality for preventing diarrhoea: systematic review and meta-analysis. BMJ. 2007;334(7597):782. doi: 10.1136/bmj.39118.489931.BE 17353208
69. Salje H, Lessler J, Paul KK, Azman AS, Rahman MW, Rahman M, et al. How social structures, space, and behaviors shape the spread of infectious diseases using chikungunya as a case study. Proc Natl Acad Sci U S A. 2016;113(47):13420–5. doi: 10.1073/pnas.1611391113 27821727
70. Weil AA, Begum Y, Chowdhury F, Khan AI, Leung DT, LaRocque RC, et al. Bacterial shedding in household contacts of cholera patients in Dhaka, Bangladesh. Am J Trop Med Hyg. 2014;91(4):738–42. doi: 10.4269/ajtmh.14-0095 25114012
Štítky
Interní lékařstvíČlánek vyšel v časopise
PLOS Medicine
2018 Číslo 2
- Alternativní léčebné možnosti u hypercholesterolemie při intoleranci statinů
- Vliv kombinace nutraceutik na remodelaci levé komory srdeční u osob s metabolickým syndromem
- Nutraceutika a jejich ovlivnění mírného kardiometabolického rizika
- Princip účinku medu v léčbě chronických i infikovaných ran
- Superoxidovaný roztok a jeho využití v léčbě ran
Nejčtenější v tomto čísle
- The potential impact of case-area targeted interventions in response to cholera outbreaks: A modeling study
- Prevalence of sexually transmitted infections among young people in South Africa: A nested survey in a health and demographic surveillance site
- Susceptibility of to azithromycin and ceftriaxone in China: A retrospective study of national surveillance data from 2013 to 2016
- Perfluoroalkyl substances and changes in body weight and resting metabolic rate in response to weight-loss diets: A prospective study