
Environmental Constraints Guide Migration of Malaria Parasites during Transmission
Migrating cells are guided in complex environments mainly by chemotaxis or structural cues presented by the surrounding tissue. During transmission of malaria, parasite motility in the skin is important for Plasmodium sporozoites to reach the blood circulation. Here we show that sporozoite migration varies in different skin environments the parasite encounters at the arbitrary sites of the mosquito bite. In order to systematically examine how sporozoite migration depends on the structure of the environment, we studied it in micro-fabricated obstacle arrays. The trajectories observed in vivo and in vitro closely resemble each other suggesting that structural constraints can be sufficient to guide Plasmodium sporozoites in complex environments. Sporozoite speed in different environments is optimized for migration and correlates with persistence length and dispersal. However, this correlation breaks down in mutant sporozoites that show adhesion impairment due to the lack of TRAP-like protein (TLP) on their surfaces. This may explain their delay in infecting the host. The flexibility of sporozoite adaption to different environments and a favorable speed for optimal dispersal ensures efficient host switching during malaria transmission.
Published in the journal:
. PLoS Pathog 7(6): e32767. doi:10.1371/journal.ppat.1002080
Category:
Research Article
doi:
https://doi.org/10.1371/journal.ppat.1002080
Summary
Migrating cells are guided in complex environments mainly by chemotaxis or structural cues presented by the surrounding tissue. During transmission of malaria, parasite motility in the skin is important for Plasmodium sporozoites to reach the blood circulation. Here we show that sporozoite migration varies in different skin environments the parasite encounters at the arbitrary sites of the mosquito bite. In order to systematically examine how sporozoite migration depends on the structure of the environment, we studied it in micro-fabricated obstacle arrays. The trajectories observed in vivo and in vitro closely resemble each other suggesting that structural constraints can be sufficient to guide Plasmodium sporozoites in complex environments. Sporozoite speed in different environments is optimized for migration and correlates with persistence length and dispersal. However, this correlation breaks down in mutant sporozoites that show adhesion impairment due to the lack of TRAP-like protein (TLP) on their surfaces. This may explain their delay in infecting the host. The flexibility of sporozoite adaption to different environments and a favorable speed for optimal dispersal ensures efficient host switching during malaria transmission.
Introduction
Optical analysis of cell migration can be performed in simple cell culture assays, in reconstituted 3D-environments, tissue explants or in living animals [1], [2]. Clearly, the migratory patterns of cells have evolved in the context of the environment they maneuver in. Many cells, such as white blood cells, neurons, metastatic tumor cells or sperm cells as well as bacteria rely on a chemotactic response system to guide them towards their target [3]. Because chemotactic signals are usually subjected to large noise levels, in all of these cases cells follow stochastic search strategies based on different variants of a Brownian random walk [4]. However, a complex pattern of movement inside for example skin or lymphoid tissue can also arise in the absence of chemotactic signals due to stochastic elements in the movement-generating processes or structural constraints in the environment [5]. For example, naive T and B cells were shown by intravital two-photon microscopy to move inside lymphoid organs on independent and apparently random 3D-paths [6], [7]. Although intravital imaging is arguably a very powerful tool to observe cells in their natural environment, analysis of in vivo data can be hampered by a number of factors such as the micro-architecture of an organ, which can potentially mask a weak chemotactic effect [5], [8].
Here we analyze motile Plasmodium sporozoites, which are the forms of the malaria parasite injected into the dermis during a mosquito bite [9], [10]. They move rapidly in seemingly random paths and can invade blood or lymphatic vessels [10]. Sporozoite motility is essential for establishing an infection within the host [11]. It relies on an actin-myosin motor, which is placed just beneath the plasma membrane of the parasite and is linked to the substrate by trans-membrane proteins of the TRAP (thrombospondin-related anonymous protein) family to the substrate [12]. Different TRAP family proteins appear to play distinct roles during sporozoites adhesion and motility [13]–[21]. While we begin to understand the molecular basis of parasite motility, little is known about how Plasmodium sporozoites reach the blood vessels after they are injected into the dermis by a mosquito. In principle sporozoites could either follow chemotacic cues [22] or be guided by their physical environment. Curiously, sporozoites migrate on near perfect circular paths on 2D substrates, which extend to spirals in 3D gels [22], [23]. To migrate within the skin after a mosquito bite presents a formidable challenge to the parasite as the mosquito bite amounts to a strong disruption of the tissue structure (including haemorrhages) and as neutrophils rush to the side of infection to clear introduced pathogens [24]–[26]. It is thus not apparent how sporozoites could successfully detect and follow a chemotactic signal in such a situation. The aim of this study is therefore to assess if structural constraints in the skin are sufficient to create the characteristic motility patterns of parasites and guide them through the skin. We reasoned that micro-fabricated substrates featuring pillars of well-defined spacings and feature sizes, often used to investigate the mechanical activity of large vertebrate cells or molecular networks [27]–[30] could serve as adequate obstacle arrays to deflect motile sporozoites, which can be placed in-between the pillars. Applying a wide range of different obstacle geometries we found that parasites can be easily deviated from their circular motion observed on planar substrates. Imaging wild type sporozoites in the absence or presence of actin depolymerizing drugs and sporozoites lacking the TRAP family protein TLP (TRAP-like protein) [20], [21] followed by quantitative analysis of their movement patterns, allowed us to define and experimentally probe key parameters of sporozoite movement. Depending on the distance of the obstacles we found parasites predominantly moving in linear or meandering patterns, preferences also observed in vivo in different skin sites.
Results
Distinct sporozoite movement patterns in different skin environments
To quantitatively assess the behavior of sporozoites inside their natural environment after transmission we carried out in vivo imaging of parasites expressing cytoplasmic GFP [31] inside the skin of the ear pinnae and the tail of living mice (Figure 1). In both sites sporozoite movement appeared to follow different patterns. While sporozoites in the ear rarely moved on linear paths, those injected into the skin of the tail were frequently seen to move for tens of seconds over several dozen of micrometers on almost linear trajectories (Figure 1A, B). Next we classified parasite movement according to the changing angles between subsequent positions of parasite tracks as movements in a linear, circular or meandering fashion (see Material and Methods). Additionally, parasites were categorized as non-motile when they were attached to the substrate and did not travel forward. Since parasites can vary their movement pattern over time we did not classify each single parasite but plotted the fraction for each pattern over the whole population. This analysis revealed that the fraction of non-motile sporozoites and circular moving sporozoites in the two distinct bite sites were similar at around 30% and 12% of the total observed time points from 589 and 164 sporozoites examined in the ear and tail, respectively (Figure 1C). The fraction of sporozoite movements that occur in a linear fashion was higher in the tail compared to the ear (P<0.001) (Figure 1C). Conversely, the fraction of meandering movement was higher in the ear than in the tail (P<0.001) (Figure 1C). Sporozoites moving in the tail moved about 20% faster than those in the ear (Figure 1D).

We next determined key parameters of sporozoite dispersal. As already apparent from in vivo projections (Figure 1A, B), individual sporozoites moving inside the skin of the ear maintained meandering motility for longer periods of time than sporozoites inside the skin of the tail (Figure 2Ai). Similarly, sporozoites moving in a linear fashion in the tail move both longer and further before changing their direction than sporozoites inside the ear (Figure 2Aii). To determine whether parasite movement follow a random walk pattern [8], we plotted and analyzed their mean square displacement (MSD) over time (Figure 2B–E, Figure S1). MSD of sporozoites moving in the ear becomes flatter after about 3 minutes of movement indicating a restricted random migration as would be expected from dispersal in the presence of obstacles (Figure 2B). In fact most biological systems do not obey normal diffusion due to internal processes or external factors like obstacles that influence their motion patterns, leading to so called sub-diffusion [32]. The MSD plot for movement in the tail shows a slight increase over time implying a more linear migration as shown in Figure 1C and 2B. Since a linear migration pattern should result in a MSD curve following a 2nd order polynomial function, the nearly perfect fitting (R2 = 0.99) to the tail data confirms the predomination of linear patterns (Figure S1B). Other patterns should follow a first-order regression, which was indeed shown by the nearly perfect 1st order fitting to parasite migration in the ear where meandering patterns dominate (Figure S1B). Furthermore, the sporozoites in the tail disperse even more rapidly than would be expected from the difference in speeds (Figure 1D, 2B).

Parasites moving in a linear fashion also showed the longest mean free path length (MFPL), i.e. the average distance covered in one type of pattern before changing into another type of pattern (Figure 2C, Figure S1A–D). As a consequence, parasites delivered to the tail covered longer distances than parasites in the ear when moving in a linear fashion. Moreover, weighting the MFPL with the percentage of the observed specific motility pattern showed that parasites moved longer distances in the tail (∼34 µm) compared to parasites moving in ear tissue (∼13 µm) before changing their motility pattern (Figure 2C).
To confirm our quantitative imaging analysis, we finally calculated key parameters describing dissemination from the origin, the motility coefficient M [8] and the actual scaling exponent α [33] from the MSD plots (Figure S1G–I). Alpha is dependent on the possibility and frequency for cell deflection influenced by the presence of obstacles (Figure S1H). M is a measure for how fast cells displace from their starting positions during a random walk process (Figure S1I). As expected, M was higher for sporozoites moving inside the dermis of the tail than in the dermis of the ear (Figure 2D) reflecting the higher speed of parasites in the tail. Parasites moving inside the tail show an α larger than 1, due to their dominant linear movement pattern in this tissue (Figure 1C, 2E). Parasites moving inside the ear show an α smaller than 1 (Figure 2E). The latter reflects a sub-diffusion behavior of sporozoites indicating that their motility might be influenced by the presence of deflecting obstacles [34].
Deflecting sporozoite movements in vitro
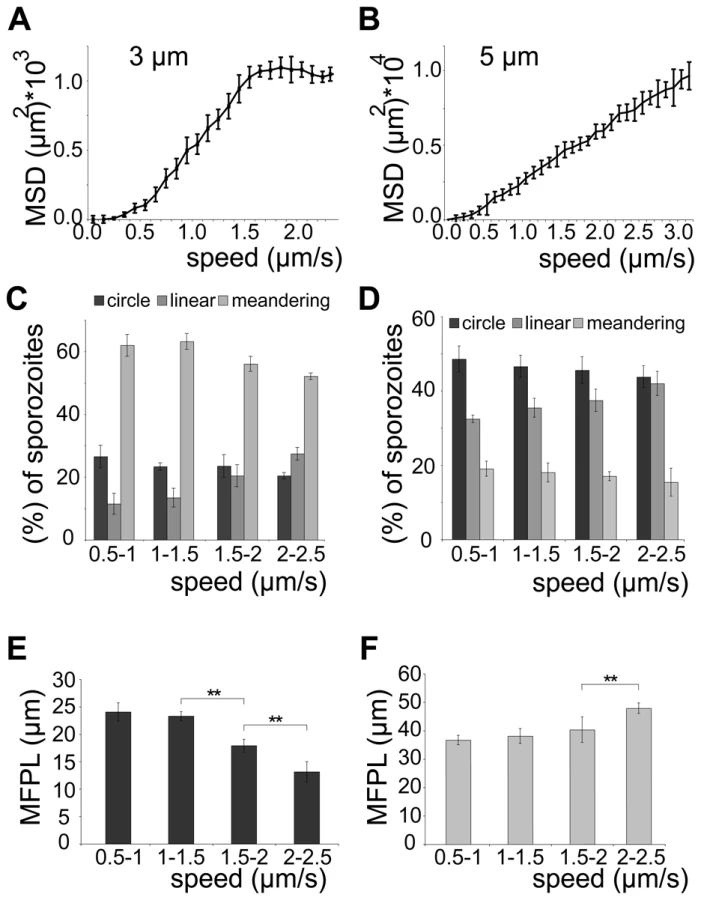
To test if deflection of sporozoites contributes indeed to their overall migration paths, we utilized micro-fabricated pillar substrates as defined obstacle arrays. These were generated with individual pillar diameters of 10 µm and pillar-to-pillar distances from 2 to 6 µm (Figure 3A, Figure S2A, B). At least 600 sporozoites (from at least triplicate experiments) were tracked and analyzed for each different obstacle array if not stated otherwise. Visual inspection showed that decreasing pillar-to-pillar distance altered the movement pattern of the sporozoites (Figure 3B). Pillar contact and sporozoite speed was uniformly distributed over a parasite population with normal length (10.5 to 13.5 µm). Sporozoites placed between pillars spaced 6 µm apart mainly moved in circles around the pillars. In a non-constrained environment like on glass around 50% of the observed parasites turn in circles. On arrays with 6 µm or 7 µm pillar-to-pillar distance the percentage of circling sporozoites was even increased to around 60%. However, with decreasing pillar-to-pillar distances, fewer parasites go in circles with a higher occurrence of complex movement patterns increasing from ∼20% (34 of 164 for 6 µm) up to ∼70% (124 of 172 for 2 µm) (Figure 3C, S2C). Curiously, the number of linear movements increased from around 20% to around 30% when the pillar-to-pillar distance was reduced from 6 to 5 µm (P<0.001, n = 642 total sporozoites for 6 µm and n = 671 for 5 µm) but then sharply dropped when the distance was further decreased to 4 µm or 3 µm (n = 638 for 4 µm and n = 52 of 651 for 3 µm) (Figure 3C). In contrast, the number of meandering trajectories increased from around 5% to around 50% with decreasing pillar-to-pillar distance. Only ∼20% of sporozoites did not move (Figure 3C, Table S1). The highest median speed and fastest dispersal was found for sporozoites moving mainly on linear tracks on substrates with 5 µm pillar-to-pillar distance (5 µm arrays) (Figure 3D, Figure 4A, Figure S2D). Interestingly, sporozoites moving in 3 and 4 µm arrays showed a MSD plot comparable to sporozoites moving in the skin of the ear pinnae (Figure 2B and 4A, Figure S2E, F).


Similar to the situation in the skin (Figure 2C), parasites moving in a linear fashion in pillar arrays also showed the longest mean free path length (MFPL) (Figure 4B, S2D). Weighting the MFPL with the percentage of the observed specific motility pattern (Figure 4B) showed that parasites in 5 µm arrays had an overall longer MFPL (∼28 µm) than those in 3 µm arrays (∼10 µm) (Figure 4B, S2D). The motility coefficient M decreased with decreasing pillar-to-pillar distance with values from 1.2 µm2/s to 0.9 µm2/s (Figure 4C) due to higher mean velocities of sporozoites moving in a linear fashion in 6 µm and 5 µm arrays (Figure 3C, 3D and 4C). Similarly, α also decreased with pillar spacing, being larger than 1.5 in 5 µm arrays and less than 0.8 in 3 or 4 µm arrays (Figure 4D). As the increasing density of obstacles lead to an α<1 for parasite dispersal, this indicated that the presence of obstacles caused a sub-diffusion behavior of sporozoites.
Sporozoite speed is optimized for migration through dense obstacle arrays
We next probed how the speed of sporozoites is related to their dispersal in different arrays. To modulate speed we applied cytochalasin D (cyto D), which inhibits motility in a dose-dependent fashion [35]. Importantly, the application of increasing concentrations of cyto D affected the average speed of the parasites by mainly increasing the proportion of non-moving parasites while decreasing all movement patterns uniformly (e.g. increase of around 20% for 10 nM cyto D, n = 131) (Figure 5A, 5B). As expected with decreasing speeds drug treatment also caused a decrease in MSD (Figure 5C). We next plotted the MSD at certain time points against the average speed with which sporozoites were moving (Figure 5D). This showed a linear dependency at early times of movement and at low speeds but the MSD appeared to reach a plateau at about 1.3 µm/s. This value corresponds closely to the average speed of sporozoites observed in vitro as well as in vivo [10], [13], [23], [35]. As there is always a large range of sporozoite speeds within a population of parasites we refined our analysis by plotting the average speed for individual sporozoites from this experiment against the MSD at the end point (Figure 6A). The MSD over speed plot reaches a plateau phase for sporozoites moving in 3 µm arrays, while it increases linearly for those moving in 5 µm arrays (Figure 6A, B). Importantly the fraction of sporozoites moving in a circular or meandering fashion does not increase with increasing sporozoite speed (Figure 6C) and can therefore not cause the observed plateau phase (Figure 6A). In 5 µm arrays the linear increase of the MSD to speed plot is due to the increasing proportion of linear movers at higher speed (Figure 6D). This suggests that a difference in MFPL could cause this change. Indeed, the MFPL in 3 µm arrays decreases with increasing speed, while in 5 µm arrays it increases (Figure 6E, F). From this set of data it can be speculated that in 3 µm but not in 5 µm arrays sporozoites achieved an optimal compromise between energy expenditure for speed and dispersal in the environment.

Parasites lacking TLP fail to disperse efficiently
Finally, we wondered if we could explain in vivo observations on efficient malaria transmission by comparing dispersal behavior of wild type (WT) and mutant sporozoites in pillar arrays. Sporozoites lacking the proteins SPECT-1, SPECT-2 and CelTOS, the surface phospholipase PbPL and the TRAP family adhesin TLP (TRAP-like protein) have all been shown to be impaired in their capacity to cross the dermis [20], [21], [24], [36]–[38]. All mutant parasite lines display a deficiency in migration through cells (transmigration). However, only for one mutant sporozoite line, tlp(-) this deficiency could be correlated with impaired gliding locomotion in vitro [19]. tlp(-) sporozoites were shown to move at a slightly lower rate on their circular trajectories than WT sporozoites and detached more frequently from the substrate [19].
To investigate tlp(-) sporozoites in a quantitative manner in obstacle arrays, we first generated a tlp(-) P. berghei line (strain ANKA) that expresses green fluorescent protein in the parasite cytoplasm under control of the EF1alpha promoter [39] (Figure S3A, S3B). Sporozoites from isolated clones from this GFP-tlp(-) line displayed the same in vitro motility features as the previous non-fluorescent tlp(-) sporozoites (strain NK65), such as reduced average speed and speed distribution over a parasite population [19], [21] (Figure S3C, S3D). GFP-tlp(-) sporozoites also showed similar phenotypes in transmission experiments (Table 1). Importantly, GFP-tlp(-) sporozoites injected by mosquito bite or subcutaneously showed a delay of about one day in the emergence of blood stages, while sporozoites injected intravenously did not (Table 1). This finding further strengthens the hypothesis that tlp(-) sporozoites show a defect in crossing the skin to invade blood capillaries [19]–[21]. We then tracked over 300 GFP-tlp(-) parasites for each investigated pillar array (from at least three independent experiments).

When monitored in the obstacle arrays GFP-tlp(-) sporozoites showed a similar overall change of migration patterns as WT sporozoites. The numbers of circling and meandering sporozoites in obstacle arrays were directly and inversely correlated to the pillar-to-pillar distance, respectively (Figure 7A). As reported for motility on obstacle-free, two-dimensional glass slides [19], about 10% fewer GFP-tlp(-) sporozoites were attached to the substrate and consequently fewer sporozoites were moving in the respective patterns (Figure 7A, e.g. for 3 µm array an increase of non motile parasites from around 20% (n = 651 total sporozoites) to around 33% (n = 342). Of these, fewer GFP-tlp(-) sporozoites were moving for long periods of time being often interrupted by non-motile phases. Analysis of Stop (speed<0.3 µm/s) and Go (speed>0.3 µm/s) phases revealed an increase of Stop periods for GFP-tlp(-) parasites (Figure S4A, B), which were twice as long in time as those for WT parasites (Figure S4A, C). The Stop phases did not alter significantly between the different motile modes. Like WT sporozoites, GFP-tlp(-) sporozoites also moved fastest in obstacle arrays with 5 µm pillar-to-pillar distance (Figure 7B) but at slightly lower overall speeds than wild type sporozoites. Accordingly their mean square displacement was lower than that of wild type sporozoites (Figure 4A, 7C, Figure S3E).

Few GFP-tlp(-) sporozoites migrated for more than 3 minutes as they detached more frequently than the wild type. The MSD of GFP-tlp(-) sporozoites was reduced by 40–50% compared to the wild type (Figure 7C). Curiously, however, the MSD over speed plot revealed that GFP-tlp(-) sporozoites moving at the same average speed as wild type sporozoites dispersed less (Figure 7D, Figure S3F). This finding shows that average speed is not the sole variable determining sporozoite dispersal in complex environments. Finally, we tested whether the impaired migration revealed in vitro can also be observed in the dermis of ear and tail of mice. In vivo imaging of GFP-tlp(-) sporozoites (near = 274, ntail = 92) from 20 transmission experiments showed that the overall fraction of non motile parasites is increased by around 12% compared to the WT (Figure 1C, 7E). Accordingly, the fraction of motile parasites was uniformly decreased with a consistently higher percentage for linear or meandering movers in tail and ear, respectively. The MSD of motile GFP-tlp(-) parasites was significantly decreased compared to the WT (Figure 2B, 7F). The MSD curves, however still followed the characteristic 1st or 2nd order polynomial function for parasite migration in ear and tail (Figure 7F). Finally, both speed and MFPL of migrating GFP-tlp(-) sporozoites were also slightly reduced compared to WT (Figure 1D, 2C, Figure S3G, H) for sporozoites migrating in the tail but not in the ear. Interestingly, while WT sporozoites migrating in the tail were faster then those in the ear, no such difference was found for GFP-tlp(-) sporozoites (Figure S3G).
Discussion
Chemotaxis versus environmental guidance
It was previously suggested that sporozoites isolated from the mosquito hemolymph but not salivary gland-derived sporozoites were attracted to extracts of salivary glands [22]. However, whether naturally transmitted sporozoites, i.e. those from the salivary glands, are chemotactic or not is currently not known. We first investigated migration in different in vivo environments. Sporozoites migrating in the dermis of the tail more often showed movement in linear trajectories than sporozoites migrating in the skin of the ear. Conversely, sporozoites in the dermis of the ear pinnae showed more random migration patterns (Figure 1) indicating increased restriction (Figure 2). The observed difference between the migration patterns of sporozoites in different tissues may arise from chemical cues. Alternatively the patterns might be due to a difference in tissue architecture or be derived from a mix of both influences. The architecture of the tail skin is indeed known to be different from that of all other tissues [40]. Thus motility could be influenced differently by varying interactions of sporozoites with cells, fibers or other structures in the respective tissue environments of the ear and tail. Similarly, it was recently shown that thymocytes exhibit varying motion patterns within specific regions in the medulla, but not in the cortex of the thymus [41].
As the calculated key dispersal parameters from in vivo imaging suggest that sporozoites follow a sub-diffusion type of random walk, we hypothesized that sporozoites can be guided through the environment by being deflected from obstacles. To test this, we utilized micro-patterned obstacle arrays [27]–[30]. This analysis showed that sporozoites in some arrays adopted complex movement patterns that partially resembled those seen in the skin (Figure 1–4). Analysis of sporozoites moving in obstacle arrays revealed strikingly similar MSD, MFPL and alpha values to sporozoites moving in the skin of the ear pinnae, for 3 or 4 µm arrays or the tail, for 5 µm arrays (Figure 1–4). Interestingly, the same trend is also observed for speed, which is highest for sporozoites moving in the tail and those moving in 5 µm arrays.
These data together show that movement patterns of motile cells can be influenced by changes in the distances of obstacles. In the case of sporozoites, differences in in vivo migration trajectories can thus be partially reconstructed in vitro using obstacle arrays. We suggest that changes in parasite trajectories are rather due to the reflection of the motile sporozoites by different obstacles then to an actively altered migration pattern, which might be expected in order to optimize the chance of finding a blood capillary. As there are no chemical gradients present in the obstacle arrays, our data suggest that the complex patterns of sporozoites observed in vivo could also be explained by the presence of structural constraints imposed by the environment. However, our data does not allow us to exclude possible contributions to the modulation of parasite migration in vivo by chemical stimuli or 3D structures like collagen fibers, which are missing in the obstacle arrays. Parasite gliding could additionally be modulated by responses towards stimuli based on e.g. immune responses or gradients build up over longer time periods. On the other hand, in vivo imaging did not reveal a clear target-oriented rush of the parasites towards blood capillaries. The pillar experiments thus clearly indicate the importance of considering the role not only of chemical signals but also of physical constraints for sporozoite migration. Future research is necessary to elucidate if chemo - or durotaxis based signals could additionally influence sporozoite migration.
Optimal sporozoite speed evolved for in vivo environments
While fast-moving mammalian cells like lymphocytes migrate at less than 0.1 µm/s, Plasmodium sporozoites move at 1–2 µm/s in the skin, a remarkably fast speed for substrate-dependent locomotion [6], [10]. Our data allowed us to probe if this rapid sporozoite movement is optimized for an efficient spread in the skin or if sporozoites just move as fast as they possibly can. This question cannot be answered by analysis of in vivo data, as only few fast moving sporozoites can be imaged and tracked for a long enough time in vivo. Also currently no methods are available to rapidly and conditionally manipulate sporozoite speed in vivo. As an alternative and based on the good correlation between sporozoite movement patterns in vivo and in pillar arrays we could manipulate sporozoite speed in vitro (Figure 5, 6).
Modulating the speed with the actin-disrupting drug cyto D revealed that, as expected, dispersal is directly dependent on the average speed of the migrating parasite population (Figure 5). Plotting the displacement (MSD) of every single parasite against its average speed revealed a linear relationship at low speed for 3 µm arrays (Figure 6A).
Unexpectedly, at higher average speed (between 1.5 and 2.5 µm/s) the spread of parasites reached a plateau phase in 3 µm arrays, while it continued to increase in pillar arrays that favored a linear migration pattern (5 µm arrays) (Figure 6B). As no major shift in movement pattern was observed for faster moving sporozoites, the majority of sporozoites gliding at higher speed in 3 µm arrays still displayed a meandering pattern (Figure 6C). The observed plateau phase is therefore likely due to the shorter mean free path length of fast moving parasites, which encounter more obstacles during the same period of time as slow moving ones (Figure 6C). Thus, in environments such as the skin where parasites undergo meandering migration, it can be speculated that the parasite would need considerably more energy in order to further increase its spread if moving faster than 1.5 µm/s. Indeed, in vivo ∼90% of the sporozoites move slower than 2 µm/s (Figure 1D), suggesting that sporozoites have adapted to the environmental constraints that limit the mean free path length. We therefore speculate that sporozoites have evolved to reach an optimal level of dispersal relative to energy expenditure for speed.
Gliding-impaired parasites fail to disperse efficiently
We also investigated parasites lacking the plasma membrane protein TLP, which appears to be important for sustained rapid motility on circular tracks in vitro [19], for exiting the skin and penetrating and/or growing within the liver [20], [21]. These parasites dispersed much less in all tested obstacle arrays than WT parasites due to a shift to a larger number of non-motile parasites and a slower migration speed (Figure 6). However, unlike for parasites treated with cytoD, the percentage of non-motile phases increased due to more frequent and longer resting phases of motile parasites. This is likely due to the adhesion impairment of tlp(-) sporozoites [19]. Strikingly, even tlp(-) parasites moving at the same average speed as WT parasites showed a smaller MSD (Figure 7B, 7D). This can be explained by the different range of instantaneous speeds for the two different populations (Figure 3D, 7B). GFP-tlp(-) sporozoites show a broader range of e.g. 0.5 to 2.8 µm/s compared to 0.8 to 2.3 µm/s for wild type sporozoites (Figure 3C, 7B). This shift is likely due to the change in the adhesive capacity of the parasites in the absence of TLP [19]. The high maximum instantaneous speeds of GFP-tlp(-) sporozoites in the 3 and 4 µm arrays fall into the plateau phase of the MSD over speed plot and thus limits their contribution to dispersal (Figure 6A). This shows that the average speed is not always directly linked to parasite dispersal and suggests that a careful dissection of parameters describing motility is necessary for the understanding of a parasite line showing a subtle motility deficient phenotype. This also suggests, that the adhesion capacity of sporozoite surface proteins, as exemplified by TLP, influences their efficient dispersal in complex environments. Finally, the decreased dispersal rate could contribute to the significant increase in the time needed for tlp(-) sporozoites to cause a blood stage infection if injected by mosquitoes or into the subcutaneous tissue (Table 1). This would suggest that the motility defects seen in tlp(-) sporozoites compared to WT reveal that TLP functions mainly in crossing the skin barrier after transmission. To probe this hypothesis we performed in vivo imaging of GFP-tlp(-) parasites. These parasites were less motile and showed only a slight reduction in speed but dispersed less than wild type parasites (Figure 7). This shows that the mutant line is migration impaired in vivo as well as in vitro. In comparison, however (Figure 7A–D and 7E–F), the reduction of dispersal of tlp(-) sporozoites was not so pronounced in vivo as on pillar arrays. In arrays with obstacles spaced 5 or 3 µm apart the MSD was decreased by around 50 to 70% (from around 10*103 µm2 to around 3*103 µm2 for 5 µm and from around 1*103 µm2 to around 0.5*103 µm2 for 3 µm arrays, respectively) (Figure 7C). In the skin a decrease of around 25% in MSD was revealed (e.g. from around 1*103 µm2 to around 0.8*103 µm2 for ear) (Figure 7F). The less distinct influence of the loss of TLP for in vivo migration could be explained by the difference between the quasi-2D environment of the pillar substrate and the complex 3D environment of the dermis. For example, a 3D surrounding could better compensate for adhesive defects as parasites detaching from one side could adhere at the other side almost simultaneously, which is obviously not possible to the same degree in pillar arrays. Additionally, factors induced by the inflammatory response to the mosquito bite or the mosquito saliva were not present in pillar arrays. We currently do not know if these factors influence parasite motility. Also, the stiffness of a PDMS obstacle array is clearly different to the more elastic skin environment. Concerning TLP function, we can also not rule out that this protein also functions in blood vessel entry. However, despite these shortcomings, we could successfully use obstacle arrays to reveal differences in parasite migration patterns that resemble in vivo migration much better than those observed on plain 2D surfaces, where sporozoites simply glide in circles.
Micro-patterned obstacle arrays can be used to deepen our understanding of how parasites travel trough the skin in order to reach the capillary system and establish infection. The characterization of a genetically defined parasite mutant further illustrates how micro-patterned obstacle arrays, in combination with transmission experiments, could be used to rapidly screen for motility defects during host switch. Whole cell assays, such as the one described herein, in combination with diverse small compound libraries offer a potential for anti-malaria lead substance discovery [42], [43]. Importantly, these arrays could also be adapted for use with other cells to similarly check for defects in migration behavior of a variety of cell types and pathogens.
Material and Methods
Ethics statement
All animal experiments were performed concerning FELASA category B and GV-SOLAS standard guidelines. Animal experiments were approved by German authorities (Regierungspräsidium Karlsruhe, Germany), § 8 Abs. 1 Tierschutzgesetz (TierSchG).
Production of micropillar substrates
We first designed a master mask using a home-written program called Phyton and converted it with the mask-writer software DWL-66 (Heidelberg Instruments). The individual pillars were arranged in hexagonal patterns to assure the distances of 2 to 6 µm between pillars in any direction (Figure S2A). The master mask was produced by ML&C Jena. The PDMS micropillar substrates were then made by photolithographic and replicate molding techniques as described in [29]. To allow wetting of the hydrophobic pillar substrates they were first treated chemically with Extran, an alkaline solution (Merck, Germany) in a 1∶10 dilution in H2O for 20 minutes while gently shaken. Afterwards the structures were washed three times for 10 minutes in distilled water. A silicon flexiPERM chamber (GreinerBioOne) was used for imaging parasites. The chamber surrounds the micropillar substrate and maintains a stable environment without flow (Figure S2B). For the motility studies on pillar substrates the sporozoites in RPMI containing 3% BSA (bovine serum albumine) were added to the flexiPERM chamber surrounding one pillar field. For the cytochalasin D treatments the parasites were preincubated with the different drug concentrations for 15 minutes.
Plasmodium sporozoites and in vitro imaging
Fluorescent P. berghei (NK65) or GPF-tlp(-) (ANKA) sporozoites [31] (see section: Generation of GFP-tlp(-) sporozoites) were produced and prepared as described [35], [44]. Comparison of parasite motility in vitro showed no difference between NK65 and ANKA strain parasites (Figure S3). Imaging of sporozoite motility on the different obstacle arrays was performed on an inverted Axiovert 200M Zeiss microscope using the GFP filterset 37 (450/510) at room temperature. Images were collected with a Zeiss Axiocam HRM at 1 Hz using Axiovision 4.8 software and a 10×, 25× or a 40× Apoplan objective lens (NA = 0.25 for 10×). A single DIC (differential interference contrast) image of the substrate was taken before and after the analysis to merge the PDMS pillars with the time-lapse series of motile sporozoites recorded in the GFP channel. For the motility analysis, a time lapse of one image per second for a total of 300 frames was taken. For each obstacle array at least three different region of interest (ROIs) were recorded. For each substrate the experimental setup was repeated several times on different days with sporozoites harvested between 17–21 days after mosquito infection. Thus the motility parameters of at least 600 sporozoites for each pillar array were recorded. The DIC image and the GFP movie were overlaid and analyzed with ImageJ (http://imagej.nih.gov/ij/index.html). For visualization, the pillars were illustrated in red and the maximum intensity projections of the parasite trajectories in green (Figure 3B, Figure S2B).
Intravital imaging
NMRI mice (Charles River) were anaesthetized by intraperitoneal injection of 70 µl ketamin/xylazin (200 µl/50 g) and the ear pinnae or the tail were exposed to infected mosquitoes inside a gauze-covered beaker as described [10], [13]. Mosquitoes were infected either with wild type (NK65) GFP fluorescent parasites [31] or GFP-tlp(-) parasites (ANKA) (see section: Generation of GFP-tlp(-) sporozoites). For each experiment mosquitoes were allowed to probe for 1–3 minutes at the exposed site before the mouse was placed on the microscope table of an inverted microscope. Parasites inside the skin were filmed using a GFP filterset either on an inverted widefield Axiovert 200M Zeiss microscope (using Axiovision 4.6 software and a 25× LCI Plan-Neofluar objective (NA 0.8)) or a PerkinElmer UltraView spinning disc confocal unit on an inverted Nikon TE 2000-E microscope (using PerkinElmer Ultraview Software and a 20× objective (PlanFluor multi-immersion, NA 0.75). Images were acquired at 0.2 or 1 Hz. The mouse was kept at a stable temperature using a preheated incubation chamber or a heating blanket.
Generation of GFP-tlp(-) sporozoites
The plasmid used to generate the tlp(-) parasites [21] has been transfected into a Plasmodium berghei ANKA strain expressing cytoplasmic GFP [39] using standard transfection methods [45]. Clonal lines were obtained by limited dilution into 15 recipient NMRI mice. Genotyping of recombinant parasites was performed by gDNA extraction and integration PCR with the same primer combination as used by Heiss et al [21] (Figure S3A). Mosquitoes were infected with GFP-tlp(-) parasites and sporozoites isolated from infected mosquitoes as described [44]. To validate that the tlp gene was deleted in GFP-tlp(-) parasites transcript detection was performed by RT-PCR from total RNA obtained from gradient-purified schizonts or salivary gland-associated sporozoites (Figure S3B). GFP-tlp(-) and, as controls, WT parasites were used for RNA isolation and reverse transcription. cDNAs were synthesized from 2 µg of total RNA using Retroscript (Ambion). Reference pools (−) were obtained in the absence of reverse transcriptase. For detection of TLP transcripts we used primers PbTLPfor_1 and PbTLPrev_1 [21] and Pbaldolase primers (Aldolase_for 5′ TGTATTTAAAGCTTTACATGATAATGG 3′; Aldolase_rev 5′ TTTTCCATATGTTGCCAATGAATTTGC 3′, expected size: ∼450 bp) for transcript controls.
Transmission experiments
4–6 C57Bl/6 mice were infected either intravenously (i.v.) with 100 WT (ANKA GFP) or GFP-tlp(-) sporozoites (ANKA), subcutaneously (s.c.) with 1,000 parasites or by bite (bite) using 10 or 5 mosquitoes per animal. The infected mosquitoes were pre-selected based on their GFP signal in the midgut one day prior to the transmission experiment and kept in a standard insectary incubator (Sanyo incubator) without the normally present sugar pad. Giemsa-stained smears from tail blood were monitored daily. The prepatent period is the time until the first detection of an erythrocytic-stage parasite in Giemsa-stained blood smears after infection.
Data analysis
The parasites were either tracked manually using the ImageJ manual tracking plugin or with an automated tool, ToAST [35]. Designation of movement as either circling or complex was first performed manually by differentiation of circling parasites and parasites that were not turning in stable circles ( = complex pattern). For an automated analysis we generated a MATLAB script, which distinguishes between attached, circular or linear moving or meandering parasites according to the angular change during motility with the following constraints: motile sporozoites that changed their angle between 0 and 12 degrees from one frame to the next were classified as moving in a linear fashion. For angles between 12 and 45 degrees and >45 degrees the sporozoites were classified as moving in a circular and meandering fashion, respectively. Parasites moving slower than 0.3 µm/s were assigned as non motile. Using the MATLAB script, parasites were automatically classified and the speed, the mean square displacement (MSD), the actual scaling exponent α and the motility coefficient M were determined for motile parasites. Random walk patterns were analyzed by plotting the average mean square displacement from the origin of the motility against time [8]. The MSD was calculated for motile parasites moving faster than 0.3 µm/s [35] and in linear and meandering patterns, excluding circling parasites (Figure S1C, S1D). The slope of the linear regression on a logarithmic MSD plot corresponds to α while M can be derived from the offset [33] (Figure S1G). Linear regression was performed using MATLAB. The visualization of the trajectories was also performed in MATLAB.
Statistical analysis
589 sporozoites in the ear and 164 sporozoites in the tail tissue were tracked and analyzed from over 25 transmission experiments (Figure 1). At least 600 sporozoites were tracked and analyzed for each different pillar array (Figure 3). Between 150 and 200 sporozoites were counted for the manual analysis (Figure S2C). For each drug treatment we tracked and analyzed more than 150 parasites (Figure 5). We tracked over 300 GFP-tlp(-) parasite for each investigated pillar array. GraphPad Prism was used for graphing and statistical analysis. Mean and standard deviations were plotted for each graph if not stated otherwise and Students t-test was performed. For not normally distributed unpaired data (in vivo data) the Mann-Whitney test was used (Figure 1D, 3D, 7B, S3G). The range of whiskers plots indicates the 2.5–97.5% percentile, the box includes 50% of all values and the horizontal bar shows the median. The threshold alpha of the p value was set to 0.05 (*), 0.01 (**) and 0.001 (***).
Supporting Information
Zdroje
1. GrivelJCMargolisL 2009 Use of human tissue explants to study human infectious agents. Nat Protoc 4 256 269
2. AndresenVAlexanderSHeupelWMHirschbergMHoffmanRM 2009 Infrared multiphoton microscop y: subcellular-resolved deep tissue imaging. Curr Opin Biotechnol 20 54 62
3. EisenbachM 2007 A hitchhiker's guide through advances and conceptual changes in chemotaxis. J Cell Physiol 213 574 580
4. CodlingEAPlankMJBenhamouS 2008 Random walk models in biology. J R Soc Interface 5 813 834
5. FiggeMTGarinAGunzerMKosco-VilboisMToellnerKM 2008 Deriving a germinal center lymphocyte migration model from two-photon data. J Exp Med 205 3019 3029
6. MillerMJWeiSHCahalanMDParkerI 2003 Autonomous T cell trafficking examined in vivo with intravital two-photon microscopy. Proc Natl Acad Sci U S A 100 2604 2609
7. MillerMJWeiSHParkerICahalanMD 2002 Two-photon imaging of lymphocyte motility and antigen response in intact lymph node. Science 296 1869 1873
8. BeltmanJBMareeAFde BoerRJ 2009 Analysing immune cell migration. Nat Rev Immunol 9 789 798
9. BeierJC 1998 Malaria parasite development in mosquitoes. Annu Rev Entomol 43 519 543
10. AminoRThibergeSMartinBCelliSShorteS 2006 Quantitative imaging of Plasmodium transmission from mosquito to mammal. Nat Med 12 220 224
11. EjigiriISinnisP 2009 Plasmodium sporozoite-host interactions from the dermis to the hepatocyte. Curr Opin Microbiol 12 401 407
12. BaumJGilbergerTWFrischknechtFMeissnerM 2008 Host-cell invasion by malaria parasites: insights from Plasmodium and Toxoplasma. Trends Parasitol 24 557 563
13. MunterSSabassBSelhuber-UnkelCKudryashevMHeggeS 2009 Plasmodium sporozoite motility is modulated by the turnover of discrete adhesion sites. Cell Host Microbe 6 551 562
14. MatuschewskiKNunesACNussenzweigVMenardR 2002 Plasmodium sporozoite invasion into insect and mammalian cells is directed by the same dual binding system. EMBO J 21 1597 1606
15. MikolajczakSASilva-RiveraHPengXTarunASCamargoN 2008 Distinct malaria parasite sporozoites reveal transcriptional changes that cause differential tissue infection competence in the mosquito vector and mammalian host. Mol Cell Biol 28 6196 6207
16. CombeAMoreiraCAckermanSThibergeSTempletonTJ 2009 TREP, a novel protein necessary for gliding motility of the malaria sporozoite. Int J Parasitol 39 489 496
17. SteinbuechelMMatuschewskiK 2009 Role for the Plasmodium sporozoite-specific transmembrane protein S6 in parasite motility and efficient malaria transmission. Cell Microbiol 11 279 288
18. MorahanBJWangLCoppelRL 2009 No TRAP, no invasion. Trends Parasitol 25 77 84
19. HeggeSMunterSSteinbuchelMHeissKEngelU 2010 Multistep adhesion of Plasmodium sporozoites. FASEB J 24 2222 2234
20. MoreiraCKTempletonTJLavazecCHaywardREHobbsCV 2008 The Plasmodium TRAP/MIC2 family member, TRAP-Like Protein (TLP), is involved in tissue traversal by sporozoites. Cell Microbiol 10 1505 1516
21. HeissKNieHKumarSDalyTMBergmanLW 2008 Functional characterization of a redundant Plasmodium TRAP family invasin, TRAP-like protein, by aldolase binding and a genetic complementation test. Eukaryot Cell 7 1062 1070
22. AkakiMDvorakJA 2005 A chemotactic response facilitates mosquito salivary gland infection by malaria sporozoites. J Exp Biol 208 3211 3218
23. VanderbergJP 1974 Studies on the motility of Plasmodium sporozoites. J Protozool 21 527 537
24. AminoRGiovanniniDThibergeSGueirardPBoissonB 2008 Host cell traversal is important for progression of the malaria parasite through the dermis to the liver. Cell Host Microbe 3 88 96
25. PetersNCEgenJGSecundinoNDebrabantAKimblinN 2008 In vivo imaging reveals an essential role for neutrophils in leishmaniasis transmitted by sand flies. Science 321 970 974
26. FrischknechtF 2007 The skin as interface in the transmission of arthropod-borne pathogens. Cell Microbiol 9 1630 1640
27. le DigabelJGhibaudoMTrichetLRichertALadouxB 2010 Microfabricated substrates as a tool to study cell mechanotransduction. Med Biol Eng Comput 48 965 976
28. TanJLTienJPironeDMGrayDSBhadrirajuK 2003 Cells lying on a bed of microneedles: an approach to isolate mechanical force. Proc Natl Acad Sci U S A 100 1484 1489
29. RoosWHRothAKonleAPrestingHSackmannE 2003 Freely suspended actin cortex models on arrays of microfabricated pillars. Chemphyschem 4 8 872 877
30. FuJWangYKYangMTDesaiRAYuX 2010 Mechanical regulation of cell function with geometrically modulated elastomeric substrates. Nat Methods 7 9 733 736
31. NatarajanRThathyVMotaMMHafallaJCMenardR 2001 Fluorescent Plasmodium berghei sporozoites and pre-erythrocytic stages: a new tool to study mosquito and mammalian host interactions with malaria parasites. Cell Microbiol 3 371 379
32. SaxtonMJ 1997 Single-particle tracking: the distribution of diffusion coefficients. Biophys J 72 1744 1753
33. MartinDSForstnerMBKasJA 2002 Apparent subdiffusion inherent to single particle tracking. Biophys J 83 2109 2117
34. FederTJBrust-MascherISlatteryJPBairdBWebbWW 1996 Constrained diffusion or immobile fraction on cell surfaces: a new interpretation. Biophys J 70 2767 2773
35. HeggeSKudryashevMSmithAFrischknechtF 2009 Automated classification of Plasmodium sporozoite movement patterns reveals a shift towards productive motility during salivary gland infection. Biotechnol J 4 903 913
36. IshinoTYanoKChinzeiYYudaM 2004 Cell-passage activity is required for the malarial parasite to cross the liver sinusoidal cell layer. PLoS Biol 2 E4
37. KariuTIshinoTYanoKChinzeiYYudaM 2006 CelTOS, a novel malarial protein that mediates transmission to mosquito and vertebrate hosts. Mol Microbiol 59 1369 1379
38. BhanotPSchauerKCoppensINussenzweigV 2005 A surface phospholipase is involved in the migration of Plasmodium sporozoites through cells. J Biol Chem 280 6752 6760
39. JanseCJFranke-FayardBMairGRRamesarJThielC 2006 High efficiency transfection of Plasmodium berghei facilitates novel selection procedures. Mol Biochem Parasitol 145 60 70
40. Hedrich 2004 Laboratory of Mouse (Handbook of Experimental Animals); HedrichHJGRB Academic Press 656
41. Le BorgneMLadiEDzhagalovIHerzmarkPLiaoYF 2009 The impact of negative selection on thymocyte migration in the medulla. Nat Immunol 10 823 830
42. GamoFJSanzLMVidalJde CozarCAlvarezE 2010 Thousands of chemical starting points for antimalarial lead identification. Nature 465 305 310
43. GuiguemdeWAShelatAABouckDDuffySCrowtherGJ 2010 Chemical genetics of Plasmodium falciparum. Nature 465 311 315
44. HellmannJKMunterSWinkMFrischknechtF 2010 Synergistic and additive effects of epigallocatechin gallate and digitonin on Plasmodium sporozoite survival and motility. PLoS One 5 e8682
45. JanseCJRamesarJWatersAP 2006 High-efficiency transfection and drug selection of genetically transformed blood stages of the rodent parasite Plasmodium berghei. Nat Protoc 1 346 356
Štítky
Hygiena a epidemiologie Infekční lékařství LaboratořČlánek vyšel v časopise
PLOS Pathogens
2011 Číslo 6
- Farmakovigilanční studie perorálních antivirotik indikovaných v léčbě COVID-19
- Jak souvisí postcovidový syndrom s poškozením mozku?
- Měli bychom postcovidový syndrom léčit antidepresivy?
- 10 bodů k očkování proti COVID-19: stanovisko České společnosti alergologie a klinické imunologie ČLS JEP
Nejčtenější v tomto čísle
- High Affinity Nanobodies against the VSG Are Potent Trypanolytic Agents that Block Endocytosis
- Structural and Mechanistic Studies of Measles Virus Illuminate Paramyxovirus Entry
- Sporangiospore Size Dimorphism Is Linked to Virulence of
- The Binding of Triclosan to SmeT, the Repressor of the Multidrug Efflux Pump SmeDEF, Induces Antibiotic Resistance in