
Defining Immune Engagement Thresholds for Control of Virus-Driven Lymphoproliferation
Chronic viral infections cause huge morbidity and mortality worldwide. γ-herpesviruses provide an example relevant to all human demographics, causing, inter alia, Hodgkin's disease, Burkitt's lymphoma, Kaposi's Sarcoma, and nasopharyngeal carcinoma. The proliferation of latently infected B cells and their control by CD8+ T cells are central to pathogenesis. Although many viral T cell targets have been identified in vitro, the functional impact of their engagement in vivo remains ill-defined. With the well-established Murid Herpesvirus-4 infection model, we used a range of recombinant viruses to define functional thresholds for the engagement of a latently expressed viral epitope. These data advance significantly our understanding of how the immune system must function to control γ-herpesvirus infection, with implications for vaccination and anti-cancer immunotherapy.
Published in the journal:
. PLoS Pathog 10(6): e32767. doi:10.1371/journal.ppat.1004220
Category:
Research Article
doi:
https://doi.org/10.1371/journal.ppat.1004220
Summary
Chronic viral infections cause huge morbidity and mortality worldwide. γ-herpesviruses provide an example relevant to all human demographics, causing, inter alia, Hodgkin's disease, Burkitt's lymphoma, Kaposi's Sarcoma, and nasopharyngeal carcinoma. The proliferation of latently infected B cells and their control by CD8+ T cells are central to pathogenesis. Although many viral T cell targets have been identified in vitro, the functional impact of their engagement in vivo remains ill-defined. With the well-established Murid Herpesvirus-4 infection model, we used a range of recombinant viruses to define functional thresholds for the engagement of a latently expressed viral epitope. These data advance significantly our understanding of how the immune system must function to control γ-herpesvirus infection, with implications for vaccination and anti-cancer immunotherapy.
Introduction
The gamma-herpesviruses (γHVs) infect >90% of humans and cause diseases including nasopharyngeal carcinoma, African Burkitt's lymphoma and Kaposi's Sarcoma. Their colonization of circulating memory B cells is crucial to persistence and hence to disease ontogeny. Viral latency gene expression in B cells provides an immune target [1] that has been exploited to prevent lymphoproliferative disease in acutely immunodeficient patients by T cell transfer [2]. However, extending this approach to established cancers and developing related vaccines have proved difficult. A significant problem is that the narrow species tropisms of human γHVs severely restrict in vivo analysis, and hence an understanding of how empirical therapies such as adoptive T cell transfer work.
Immune recognition can be assayed in vitro; but while Epstein-Barr virus (EBV) latency gene products drive autonomous B cell proliferation in vitro, most in vivo infected cells are resting memory B cells that have passed though lymphoid germinal centers (GCs) [3]. This makes difficult in vitro analysis of in vivo immune control. One way to make progress is to study related viruses that are experimentally more accessible. Probably the best characterized is Murid Herpesvirus-4 (MuHV-4, archetypal strain MHV-68) [4]–[6]. MuHV-4 is more closely related to the Kaposi's Sarcoma-associated Herpesvirus (KSHV) than to EBV [7]. However it shares many features of host colonization with EBV, for example it exploits lymphoid GCs to establish persistence in circulating memory B cells [8]–[10]. Therefore it can be used to reveal fundamental mechanisms of γHV/host interaction.
MuHV-4 studies have shown that γHV-driven lymphoproliferation occurs in complex lesions incorporating T cell evasion and infected cells with distinct patterns of viral gene expression [10]. In addition to cis-acting T cell evasion during episome maintenance [11], [12], EBV inhibits the transporter associated with antigen processing (TAP) via BNLF2a [13]–[15] and MHC class I export to the cell surface via BILF1 [16], [17]; KSHV degrades MHC class I and other immune receptors via K3 and K5 [18]; and MuHV-4 degrades MHC class I and TAP via MK3 [19]–[21]. Disrupting MK3 impairs virus-driven lymphoproliferation [22].
The γHVs also evade immune recognition during latency by expressing few CTL targets. However a gene that modulates signaling through the B cell receptor - M2 in MuHV-4 [23]–[26], LMP-2A in EBV [27] and K1 in KSHV [28] - is expressed more widely than growth program genes [3], and shows protein sequence diversity [29]–[33] consistent with immune selection. More directly, the presence of an H2Kd binding epitope in M2 [34], [35] significantly reduces long-term MuHV-4 latent loads in BALB/c mice [29]. Therefore despite viral evasion, CTL help to regulate long-term infection [36], [37], and CTL recognition of M2/K1/LMP-2A, which in EBV may extend also to EBNA3A/B/C [38], [39], provides a potential point of attack. LMP-2A is also a candidate vaccine target for nasopharyngeal carcinoma [40]. Thus, how M2/K1/LMP-2A recognition works in vivo is important to understand.
CTL effector capacity broadly correlates with functional avidity, as determined by the capacity of T cell receptor (TcR) engagement to trigger CTL proliferation, cytokine production and target cell lysis at limiting antigen dose [41]. Therefore with limited γHV protein expression during latency, peptide affinity for MHC class I and TcR functional avidity are likely to be crucial for immune control. The diversity of LMP-2A, K1 and M2 prompted us to analyze in vivo the consequences of varying MHC class I binding and TcR functional avidity for a single epitope derived from M2. These parameters affected dramatically the control of virus-driven lymphoproliferation, even in the context of immune evasion. The capacity of MuHV-4 to correlate biochemical interactions with in vivo immune function allowed us to establish quantitative guidelines for infection control.
Results
Characterization of altered peptide ligands (APLs) by MHC class I binding and TcR functional avidity
To understand the CTL recognition requirements for γHV infection control, we expressed from MuHV-4 a well-characterized, H2Kb-restricted epitope comprising amino acid residues 257–264 of ovalbumin (OVA), or APL derivatives (Figure 1A). OVA binds to H2Kb with high affinity (KD = 4.1 nM) [42]. We compared OVA and APL binding by H2Kb stabilization on TAP-deficient RMA/S cells (Figure 1B) [43]. The OVA concentration giving 50% maximal stabilization (EC50) was 40 nM, in close agreement with published data [44]. APLs Q4, V4, G4 and R4 were similar to OVA (EC50 within 2-fold), consistent with residue 4 being solvent-exposed in the H2Kb-peptide complex [45]. E1 required 6-fold more peptide for equivalent H2Kb stabilization, consistent with this residue being only partly exposed; A8, which has a mutated anchor residue, required 10-fold more peptide again; and the control peptide A5A8, with 2 mutated anchor residues, gave no significant stabilization. The H2Kb/OVA/β2M complex has an estimated half-life of 8 h [44]. Its stability is determined primarily by the peptide off-rate, so the E1 complex is likely to have a half-life of approximately 1.3 h.

We assessed the functional avidity of the H2Kb-OVA-specific TcR of OT-I [46] for each APL by ex vivo stimulation of CD8+ T cells from OT-I mice with graded peptide doses (Figure 1C). There was a clear hierarchy in dose-response, with OVA>Q4 (14-fold)>V4 (a further 279-fold)>G4 (53-fold further still), consistent with published data [47]. The R4 antagonist peptide [48], [49] gave no stimulation. As predicted E1 and A8, which have lower MHC class I binding, generated the lowest dose-responses.
Generation of MuHV-4 recombinants expressing OVA or APLs linked to M2
We next introduced each epitope at the MuHV-4 M2 C-terminus to ensure expression in latency without compromising M2 function [29]. CTL recognition of an endogenous M2 epitope reduces long-term MuHV-4 latent loads in H2d mice [29]. The lack of an endogenous H2b-restricted M2 epitope therefore allowed us to introduce new targets in a context where this is known to be important. Each recombinant virus was also made with a yellow fluorescent protein (YFP) reporter construct [50] to aid infection tracking (Figure S1). Correct epitope insertion and assembly of the surrounding genome were demonstrated by PCR of plaque-purified viral DNA (Figure 1D). Each recombinant virus showed equivalent in vitro growth (Figure 1E), equivalent lytic replication in the lungs of intranasally (i.n.) infected C57BL/6 mice (Figure 1F) - with peak titers at 4–7 days post-inoculation and clearance by day 11 - and normal latency establishment in H2d BALB/c mice - with equivalent splenic infectious center assay titers 14 days after i.n. inoculation (Figure 1G). Therefore none showed a replication defect independent of H2b-restricted latent epitope expression.
MHC class I binding by a latency-associated epitope impairs host colonization
We then tested latency establishment in H2b mice. Infectious center assays (Figure 2A) showed attenuation of any virus with an H2Kb binding epitope attached to M2 (vOVA, vQ4, vV4, vG4, vR4): splenic infection was established at day 11, but then cleared rather than amplified by days 14–21. In contrast, the virus expressing a poorly binding epitope (vA8) was indistinguishable from the epitope-negative wild-type (vWT). Interestingly vE1, which expresses an epitope with 6-fold lower EC50 for H2Kb stabilization (Figure 1B), showed an intermediate phenotype with normal titers at day 11 followed by a gradual reduction.
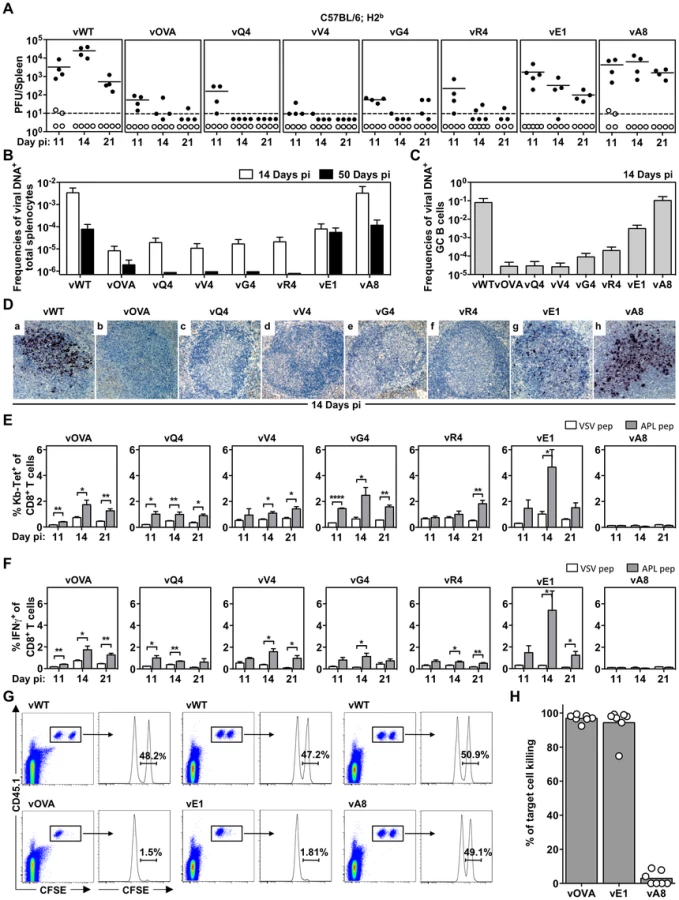
Not every latently infected cell necessarily reactivates its virus ex vivo. We therefore used PCR of viral DNA at limiting dilution (Figure 2B; Table 1) as a second measure of infected cell frequency. We looked at the peak of latent infection (14 days post-inoculation) and at the steady state (50 days). These results supported the infectious centre assays: vOVA, vQ4, vV4, vG4 and vR4 were all markedly attenuated (>100-fold reduction); vA8 was equivalent to vWT; and vE1 showed an intermediate phenotype, with strongly decreased acute titers but long-term titers close to vA8 and vWT. MuHV-4-specific CTL responses peak at 14–21 days post-infection [51]. Thus a weakly binding latent epitope (E1) allowed some control when CTL responses were at their peak, but not in the long-term when CTL responses decrease in size.

MuHV-4 colonizes multiple cell types in acutely infected spleens. Many are B cells, which change in phenotype as they pass through germinal centers; others are myeloid cells. The main proliferating population is GC B cells, and these also connect most directly to the long-term latency reservoir of resting memory B cells [9], [10]. Therefore to understand better the relationship between acute and long-term viral loads, we measured viral genome prevalence in flow cytometrically sorted GC B cells (Figure 2C; Table 2). They showed marked reductions for vOVA, vQ4, vV4, vG4 and vR4, equivalent frequencies for vA8 and vWT, and intermediate frequencies for vE1. These data were further supported by in situ hybridization for latently expressed viral tRNA/miRNA homologs [29] (Figure 2D), which showed abundant GC infection by vWT and vA8, severely impaired infection by vOVA, vQ4, vV4, vG4 and vR4, and intermediate infection by vE1. Therefore susceptibility to CTL attack during acute lymphoproliferation varied with cell type, and the relative sparing of vE1+ GC B cells appeared to allow high long-term viral loads.

CTL responses to epitopes expressed in latent infection
We measured epitope-specific CTL responses with H2Kb-peptide tetramers (Figure 2E) and by staining for intracellular IFN-γ after ex vivo stimulation (Figure 2F). Responses to vA8 were uniformly low despite high viral loads, presumably because this epitope was not produced in sufficient amounts to compensate for its poor H2Kb binding. Responses to vOVA, vQ4, vV4, vG4 and vR4 were detectable, although small compared to those reported for lytic antigens [51]. Surprisingly, the largest CTL response was elicited by the intermediate phenotype virus, vE1. This could not be explained by lytic infection, since this was high in lungs for all viruses (Figure 1F).
We confirmed the functionality of vE1-specific CTL by in vivo killing of CFSE-labelled, peptide-exposed targets (Figure 2G,H): vE1-induced CTL showed target cell elimination comparable to vOVA, whereas mice infected with vWT or vA8 showed none. Therefore the relatively weak H2Kb binding of E1 was sufficient to stimulate large, functional CTL responses, but not for those CTL to curtail efficiently virus-driven lymphoproliferation. This result suggested that at least for vE1, most CTL stimulation comes from a population distinct from that engaged in lymphoproliferation.
CTL functional avidity also determines infection control by latency epitope recognition
The capacity of C57BL/6 mice to control MuHV-4-driven lymphoproliferation through the recognition of latently expressed OVA, Q4, V4, G4 or R4 indicated that the key requirement in a polyclonal TcR setting is the availability of an epitope capable of strong MHC class I binding: T cells from the naive repertoire could recognize either OVA or an APL. However responses to EBV can involve oligoclonal or even monoclonal CTL expansions [52]–[54]. Therefore to understand better the quantitative requirements of TcR functional avidity for in vivo γHV control, we focussed on the well-characterized OT-I TcR (Figure 3).

We first infected OT-I mice with MuHV-4 expressing OVA or APLs with comparable H2Kb binding (Q4, V4, G4, R4), and measured host colonization by infectious center assay of spleens 9 and 11 days later (Figure 3A). vE1 and vA8 were not utilized since they bind MHC class I less efficiently precluding analysis of T cell functional avidity because target concentrations are different. There was a clear correlation between CTL functional avidity (Figure 1C) and in vivo virus control. The antagonist epitope (R4) allowed no control - titers were equivalent to those of the epitope-negative vWT; the others showed a hierarchy of control (OVA>Q4>V4>G4) that matched exactly their hierarchy of functional avidity (and not their minor differences in H2Kb binding). Low titers of pre-formed infectious virus were found in some mice, but generally in proportion to their latent titers, consistent with reactivation of a fixed fraction of the latent viral load; we saw no evidence that M2-associated epitope presentation created a significant new lytic CTL target.
To confirm that the immune control was by CTL, we treated mice with a depleting, CD8-specific mAb from the time of infection (Figure 3B–D). Each virus then reached equivalent titers to the wild-type. While the depletions were highly effective (Figure 3C), they had little effect on the day 11 spleen titers of vWT (Figure 3D). This result was consistent with previous publications [36], [55] and with the lack of known H2b-restricted MuHV-4 latency epitopes. Thus, introducing latent epitope recognition caused new, CD8-dependent virus attenuation in proportion to the functional avidity of that epitope for the dominant TcR.
CTL functional avidity in the context of normalized T cell repertoire
OT-I mice provided a useful starting point for in vivo analysis of single TcR function. However their limited CD4+ T cell repertoire impairs GC formation and so the ability of MuHV-4 to drive B cell proliferation. Hence, to define the impact of TcR functional avidity in an environment more conducive to lymphoproliferation, we adoptively transferred lymphocytes from Rag-1−/−OT-I mice and purified CD4+ T cells from C57BL/6 mice into TcRα−/− recipients (Figure 4A). Thus the reconstituted mice had polyclonal CD4+ T cells and a TcRαβ+CD8+ T cell compartment of modest size that was restricted to OT-I cells. (Most CD8+ T cells of TcRα−/− mice are TcRγδ+TcRαβ−.) Infecting these with vWT led to a robust proliferation of infected GC B cells (Figure S2 and S3). Infecting them with vOVA elicited a strong OT-I response (Figure 4B) and suppression of splenic colonization (Figure 4C); by contrast vR4, which expressed an antagonist epitope, elicited no OT-I response and reached high titers (Figure 4C). Therefore these mice provided a new and informative window onto how TcR engagement by a latency epitope affects virus-driven lymphoproliferation.

Sub-optimal CTL functional avidity still allows control of virus-driven lymphoproliferation
We then infected reconstituted mice with MuHV-4 expressing OVA or APLs (Figure 5). At day 16 post-infection OT-I T cell expansion was greatest for vOVA, reduced for vQ4, reduced further for vV4, and close to background for vG4 and vR4 (Figure 5A). Thus it correlated well with the epitope functional avidity measured in Figure 1C (OVA>Q4>V4>G4>R4). Specifically, the 14-fold avidity reduction of Q4 only modestly reduced CTL cell expansion, and the 4000-fold reduction of V4 caused further reduction but still did not ablate it entirely. The CTL response declined to background only when the avidity was reduced 200,000-fold (G4). Therefore the immune response showed a surprisingly large tolerance for sub-optimal TcR engagement.

Similar results were obtained for OT-I T cell activation (loss of CD62L, Figure 5B). We analyzed CTL function further by intracellular staining for IFN-γ (Figure 5C) and Granzyme B (Figure 5D) after ex vivo stimulation with the corresponding peptide epitope. The responses to vG4 and vR4 were hard to assess due to low CTL numbers; but those to vQ4 and vV4 showed comparable functionality to vOVA. (Note that the peptide concentration used was only just sufficient for maximal stimulation by V4 in Figure 1C) Therefore there was no sign of vQ4 and vV4 eliciting CTL responses that were functionally impaired (or functionally enhanced); they simply elicited responses that were smaller.
Virus titers (Figure 5E) were reduced markedly by OVA expression, only marginally less by Q4, and not significantly by G4 or R4. V4 expression gave an intermediate phenotype, with titers significantly below those of the vWT control and significantly above those of vOVA. The frequencies of viral DNA+ cells in spleens (Figure 5F and Table S1) showed a similar hierarchy (vWT = vG4 = vR4>vV4>vQ4>vOVA). The viral DNA+ frequencies of flow cytometrically sorted GC B cells (Figure 5G and Table 3) showed less discrimination. Nonetheless the trends were similar, and these results were further corroborated by analysis of YFP expression in GC B cells (Figure S4). Therefore high functional avidity (vOVA) gave marked CTL expansion and low virus titers; a 14-fold avidity reduction (vQ4) have remarkably similar results; a 200,000-fold avidity reduction abolished virus control (vG4); and a 4000-fold reduction gave an intermediate phenotype (vV4). OT-I TcR engagement by M2-derived OVA was therefore considerably above the threshold required for in vivo viral control, and low functional avidity compromised viral control via reduced CTL expansion, rather than by differentially affecting CTL effector function.

Discussion
Gamma-herpesvirus epitope recognition by CTL has been studied extensively [1], [54], but ours is the first quantitative assessment of how epitope/MHC class I/TcR complex formation affects host colonization. Where no latency epitope expression existed, introducing one led to a profound, CTL-dependent suppression of virus-driven lymphoproliferation. This was consistent with the impact of endogenous epitope presentation in H2d mice [29]. The latter affected only long-term viral loads; OVA expression in H2b mice also conferred susceptibility to CTL during acute lymphoproliferation, when trans-acting immune evasion operates [1]. This greater effect of epitope presentation possibly reflected differences in host susceptibility to immune evasion: the MuHV-4 K3 degrades H2Kb relatively poorly [19] and degrades TAP better in H2d than H2b cells [20].
The precise cellular targets for CD8+ T cell recognition of M2-linked epitopes remain unknown. One possibility is proliferating germinal centre B cells, as B cells are a major site of M2 expression [10], [34]. Infected B cells could also be recognized before the onset of proliferation; and as myeloid cells transfer infection to B cells [56], CD8+ T cells could also suppress lymphoproliferation indirectly, by targeting infected myeloid cells [1].
A key point for physiologically relevant epitope presentation is that it conforms to normal latent gene expression. Exogenous promoters such as HCMV IE1 show activity independent of endogenous viral gene expression [57] and this can lead to attenuation [58]. Previous analysis of endogenous M2 epitope [29] established its importance for determining the different long-term latent loads of H2d and H2b mice. Here, to identify presentation thresholds, we made use of the well-characterized SIINFEKL epitope, attaching it to a neutral region of M2 (its C-terminus). This allowed the generation of a very well-defined model epitope with the kinetics and copy number of a known endogenous epitope. Epitope presentation varies with MHC class I genotype. C57BL/6 mice have only 2 MHC class I molecules and appear not to recognize an endogenous M2 epitope. In this context, M2-SIINFEKL illustrated the impact of strong epitope presentation, and wild-type M2 (or M2-vA8) that of poor epitope presentation. The SIINFEKL variants covered the range between, and so allowed us to identify functional recognition thresholds.
Small differences (<1.6-fold) in H2Kb epitope binding had no obvious impact on in vivo CTL efficacy, but a 60-fold reduction abolished protection and a 6-fold reduction showed a partial phenotype. Thus, M2-linked epitope presentation left little room for sub-optimal MHC class I binding. By contrast when H2Kb binding was maintained, reducing TcR functional avidity 14-fold had little effect, reducing it 200,000-fold abolished control, and reducing it 4,000-fold gave an intermediate phenotype. Therefore this aspect of recognition was more flexible even for monoclonal, Rag-1−/− CTL, and a polyclonal population could attack any epitope so long as its MHC class I binding was strong.
In complex viral infections, larger CTL responses are not necessarily more effective responses. These parameters can correlate: MuHV-4 lacking its K3 evasion gene elicits more CTL and achieves lower titers [22]; and our reconstituted mice showed a correlation between more CTL and less virus. But as with latent epitope presentation downstream of ORF73 [11], OVA-specific CTL responses that completely suppressed lymphoproliferation were small compared to lytic epitope responses [51]; and mice infected with vE1 made large epitope-specific responses yet showed poor virus control. We hypothesize that CTL can be stimulated by the key, self-renewing population of infected B cells, when infection is suppressed, but also by infected cells less important to host colonization, when large responses may achieve little. Crucially, viral evasion may make the self-renewing population harder to target. Thus, vE1 showed a strong acute reduction in total viral DNA+ cell frequencies, but relative sparing of GC B cells and consequently high long-term virus loads. A position 1 mutation also impairs the control by Rag-1−/−OT-I mice of MuHV-4 expressing OVA from an HCMV IE1 promoter [59]. However such mice lack B cells or CD4+ T cells, and without CD4+ T cells MuHV-4 causes a lethal, chronic lytic infection even with a strong, polyclonal CTL response [60], [61]. Our reconstituted mice maintained both virus-driven lymphoproliferation and infection control without outgrowth of CTL escape mutants. Thus we could relate directly quantitative changes in epitope recognition to the control of lymphoproliferation.
An important task with EBV is to predict in vivo CTL efficacy. Extrapolating from CTL numbers and in vitro assays alone is clearly problematic. For example, large responses to lytic epitopes in infectious mononucleosis [54] could be interpreted as important, or simply as poor latency epitope recognition when better recognition might preclude large lytic responses and avoid symptoms. The precise relatedness of EBV memory B cell colonization via GCs to MuHV-4 memory B cell colonization via GCs is unknown. But all γHVs have evolved to colonize lymphocytes with maximal efficiency, within limits set ultimately by the immune system, so similar quantitative thresholds would not be surprising. Our data therefore have important general implications for γHV-specific CTL function, and for predicting in vivo CTL efficacy from biochemical measures.
Materials and Methods
Ethics statement
The study accorded with the Portuguese official Veterinary Directorate (Portaria 1005/92), European Guideline 86/609/EEC, and Federation of European Laboratory Animal Science Associations guidelines on laboratory animal welfare. It was approved by the Portuguese official veterinary department for welfare licensing (protocol AEC_2010_017_PS_Rdt_General) and by the IMM Animal Ethics Committee.
Mice
CD45.1 C57BL/6, OT-I, Rag-1−/− and TcRα−/− mice were obtained from Jackson Laboratories. CD45.1 Rag-1−/− OT-I mice were obtained by breeding OT-I onto a CD45.1 Rag-1−/− background. C57BL/6 and BALB/c mice were purchased from Charles River Laboratories. All mice were housed under specific pathogen-free conditions at the Instituto de Medicina Molecular and used when 6–12 weeks old. For adoptive transfers to TcRα−/− mice, CD4+ T cells were purified by negative selection from pooled lymph nodes of naïve C57BL/6 mice using the CD4+ T cell isolation kit (Miltenyi Biotech). OT-I T cells were obtained from pooled lymph nodes of naïve CD45.1 Rag-1−/− OT-I mice. 2×10⁶ CD4+ T cells and 106 CD45.1 Rag-1−/− OT-I T cells were adoptively transferred to TcRα−/− recipients via tail vein injection one day prior to infection.
Generation of recombinant viruses
MuHV-4 recombinants were generated from BAC-cloned viral genomes [29]. OVA and APL epitopes were introduced by PCR at the M2 C-terminus. Briefly, the M2 downstream region (genomic co-ordinates 3846-4029) containing a HindIII restriction site followed by the epitope coding region and a stop codon were PCR amplified (Table S2) to attach each epitope to the M2 C-terminus. The PCR products were inserted downstream of a HinDIII/XhoI MuHV-4 genomic fragment (nt 4029–5362) in pSP72 (Promega), using a genomic BglII site (nt 3846) and the engineered HinDIII (nt 4029) restriction site. The constructs were then subcloned into a HinDIII-E MuHV-4 genomic fragment in the pST76K-SR shuttle plasmid, using genomic BlnI (nt 3908) and XhoI (nt 5362) restriction sites. All PCR-derived regions were sequenced to confirm the integrity of the introduced epitopes and the M2 flanking region. Each recombinant HinDIII-E shuttle plasmid was transformed into E.coli carrying the wild type MuHV-4 BAC (pHA3) or a YFP+ BAC [50] obtained from Dr Samuel Speck (Emory Vaccine Center, Atlanta). Following multi-step selection, recombinant BAC clones were identified by restriction digestion with HinDIII. The integrity of each BAC was confirmed by digestion with BamHI and EcoRI. All viruses were reconstituted by transfecting BAC DNA into BHK-21 cells using FuGENE 6 or X-tremeGENE HP (Roche Applied Science). The loxP-flanked BAC cassette was then removed by viral passage through NIH-3T3-CRE cells and limiting dilution cloning. The integrity of each reconstituted virus was checked by PCR of viral DNA across the HinDIII-E region and DNA sequencing across M2.
Cell culture and viruses
Murine RMA/S cells were cultured in RPMI 1640 with 10% fetal calf serum, 2 mM glutamine and 100 U/ml penicillin and 100 µg/ml streptomycin. NIH-3T3 (ATCC)-CRE cells [22] were grown in Dulbecco's modified Eagle's medium (DMEM) with 10% fetal calf serum, 2 mM glutamine, 100 U/ml penicillin and 100 µg/ml streptomycin. Baby hamster kidney fibroblast cells (BHK-21, ATCC) were cultured in Glasgow's modified Eagle's medium (GMEM) supplemented as above plus 10% tryptose phosphate broth. To prepare viral stocks, low multiplicity infections (0.001 PFU per cell) of NIH-3T3-CRE or BHK-21 cells were harvested after 4 days and titrated by plaque assay [29].
H2Kb stabilization assay and OVA/APLs stimulatory potency
H2Kb stabilization was determined with TAP-deficient RMA/S cells. These were incubated overnight at 26°C to promote the export of empty H2Kb complexes, then loaded with graded concentrations of OVA or APL peptides (Thermo Scientific) for 2 h at 26°C and subsequently transferred to 37°C for 2 h to destabilize empty MHC molecules [43]. The cells were then washed twice, stained with anti-H2Kb (AF6-88.5.5.3, eBioscience), and analysed on a LSR Fortessa (BD Biosciences). Mean fluorescence intensities were determined with FlowJo (Tree Star). To measure the ex vivo stimulation of naïve OT-I T cells by OVA and APLs, CD8+ T cells from the spleens of naïve OT-I mice were purified by negative selection (CD8+ T cell isolation kit, Miltenyi Biotech); for equivalent peptide/MHC class I numbers, irradiated (7500 rads) RMA/S cells were loaded with different peptides at 26°C, then incubated at 37°C; and 5×10⁴ OT-I T cells were cultured with 2.5×10⁴ RMA/S cells for 72 h at 37°C. IFNγ levels in culture supernatants were measured by ELISA (DuoSet ELISA development kit, R&D Systems). The data were fitted to sigmoidal dose-response curves and EC50 values calculated using GraphPad Prism.
In vivo infections and virus assays
Groups of 6 - to 8-week old BALB/c and C57BL/6 mice were inoculated i.n. with 104 PFU of MuHV-4. 8 - to 12-week old OT-I and TCRα−/− mice were inoculated i.n. with 103 PFU of MuHV-4. All virus inoculations were in 20 µl of PBS under isofluorane anaesthesia. At different days post-infection lungs or spleens were removed and processed for subsequent analysis. Titres of infectious virus were determined by plaque assay of freeze-thawed lung or spleen homogenates using BHK-21 cells. Latent virus loads were quantified by explant co-culture of splenocytes with BHK-21 cells. Plates were incubated for 4 (plaque assay) or 5 (explant co-culture assay) days, then fixed with 4% formaldehyde and stained with 0.1% toluidine blue. Viral plaques were counted with a plate microscope. The frequency of MuHV-4 genome-positive cells was determined by limiting dilution combined with real time PCR [10]. Splenocytes were pooled from 4–5 mice. GC B cells (CD19+CD95hiGL7hi) were purified from pools of 4 or 5 spleens using a BD FACSAria Flow Cytometer (BD Biosciences). Cells were serially two-fold diluted and eight replicates of each dilution were analysed by real time PCR (Rotor Gene 6000, Corbett Life Science). The primer/probe sets were specific for the MuHV-4 M9 gene (5′ primer: GCCACGGTGGCCCTCTA; 3′ primer: CAGGCCTCCCTCCCTTTG; probe: 6-FAM-CTTCTGTTGATCTTCC-MGB). Samples were subjected to a melting step of 95°C for 10 min followed by 40 cycles of 15 s at 95°C and 1 min at 60°C. Real-time PCR data was analysed on the Rotor Gene 6000 software. The purity of sorted populations was always >96%. In situ hybridization with a digoxigenin-labelled riboprobe encompassing MuHV-4 vtRNAs 1–4 and microRNAs 1–6 was performed on formalin-fixed, paraffin-embedded spleen sections [29], using probes generated by T7 transcription of pEH1.4.
In vivo cytotoxicity assay
Splenocytes from naïve CD45.1 C57BL/6 mice were used as targets and controls. Targets were pulsed with 1 µM OVA, E1 or A8 peptides for 1 h at 37°C, then labeled with 1 µM carboxyfluorescein succinimidyl ester (CFSE) (Molecular Probes). Controls were left unpulsed and labeled with 0.1 µM CFSE. Cells were washed three times then injected intravenously as a 50∶50 mix of CFSEhi and CFSElo cells (4×10⁶) into mice infected with vWT, vOVA, vE1 or vA8. The same mixes were injected intravenously into vWT infected C57BL/6 controls to ensure equal transfer. On the next day splenocytes were harvested and the proportion of CFSEhi and CFSElo cells among CD45.1 splenocytes was analysed by FACS. Target cell killing was calculated as (% CFSElo/% CFSEhi), with % = 100−(ratio in vWT infected/ratio in vOVA, vE1 or vA8 infected)×100.
CD8+ T cell depletions
MuHV-4 infected OT-I mice were depleted of CD8+ T cells by 5 intraperitoneal injections of 200 µg monoclonal antibody YTS 169.4. Splenocytes from control or depleted mice were stained with anti-CD8α (53-6.7) (BD Pharmingen) and analysed on a LSR Fortessa (BD Biosciences).
Ex vivo stimulation and intracellular cytokine staining
Splenocytes (2×10⁶) from infected mice were stimulated for 5 h at 37°C with 10 µg/ml peptide (OVA, APLs or VSV NP52-59) in RPMI 1640/10% fetal calf serum/2 mM glutamine/100 U/ml penicillin/100 µg/ml streptomycin/50 µM 2-mercaptoethanol/10 U/ml recombinant murine IL-2 (PeproTech)/10 µg/ml Brefeldin A. Cells were then washed, blocked with anti-CD16/32 (2.4G2) (BD Pharmingen), surface stained with anti-CD8α ± anti-CD45.1 (for OT-I T cells), fixed and permeabilized with Foxp3 staining buffer (eBioscience) and stained with anti-IFNγ (XMG1.2) (BD Pharmingen), anti-Granzyme B (NGZB) or anti-IgG2ak Isotype control (eBioscience). Samples were analysed on a LSR Fortessa (BD Biosciences).
Flow cytometry
Splenocytes were treated with red blood cell lysis buffer, blocked with anti-CD16/32 (2.4G2, BD Pharmingen, 10 min), and stained at 4°C in PBS/2% FCS 30 minutes: anti-CD95 (Jo2), anti-CD19 (1D3), anti-CD8α (53-6.7), anti-IFNγ (XMG1.2) (BD Pharmingen); anti-CD45.1 (A20), anti-CD45.2 (104), anti-CD44 (IM7), anti-CD62L (MEL-14) (Biolegend); anti-GL7 (GL7), anti-H2Kb (AF6-88.5.5.3), anti-TCRβ (H57-597), anti-GranzymeB (NGZB), anti-IgG2ak Iso control (eBR2a) (eBioscience). For biotinylated antibodies, an additional 20 minutes incubation with streptavidin was performed. MuHV-4 infected cells were identified by YFP expression. H2Kb tetramers conjugated to PE were a kind gift from Dr Hidde L. Ploegh (Whitehead Institute for Biomedical Research, Massachusetts Institute of Technology, Cambridge). Conditional ligand was exchanged for SIINFEKL (OVA), SIIQFEKL (Q4), SIIVFEKL (V4), SIIGFEKL (G4), SIIRFEKL (R4), EIINFEKL (E1) or RGYVYQGL (VSV NP52-59) peptides (Thermo Scientific). Streptavidin-APC or -PerCP (BD Pharmingen) was used to reveal biotinylated antibodies. Samples were acquired on a LSR Fortessa using DIVA (BD Biosciences) and analysed with FlowJo (Tree Star, Inc.).
Statistical analysis
Data comparisons between groups were performed by an unpaired two-tailed t-test or ordinary one-way ANOVA as appropriate. Mean +/ − SEM and statistics were calculated with GraphPad Prism Software. For limiting dilution analysis 95% confidence intervals were determined as described [10].
PCR primers
Primers used for attaching each epitope to MuHV-4 M2 C-terminus are detailed in supplemental Table S2.
Supporting Information
Zdroje
1. StevensonPG, SimasJP, EfstathiouS (2009) Immune control of mammalian gamma-herpesviruses: lessons from murid herpesvirus-4. J Gen Virol 90 : 2317–2330.
2. BollardCM, RooneyCM, HeslopHE (2012) T-cell therapy in the treatment of post-transplant lymphoproliferative disease. Nat Rev Clin Oncol 9 : 510–519.
3. Thorley-LawsonDA (2001) Epstein-Barr virus: exploiting the immune system. Nat Rev Immunol 1 : 75–82.
4. SimasJP, EfstathiouS (1998) Murine gammaherpesvirus 68: a model for the study of gammaherpesvirus pathogenesis. Trends Microbiol 6 : 276–282.
5. SpeckSH, GanemD (2010) Viral latency and its regulation: lessons from the gamma-herpesviruses. Cell Host Microbe 8 : 100–115.
6. NashAA, DutiaBM, StewartJP, DavisonAJ (2001) Natural history of murine gamma-herpesvirus infection. Philos Trans R Soc Lond B Biol Sci 356 : 569–579.
7. VirginHWt, LatreilleP, WamsleyP, HallsworthK, WeckKE, et al. (1997) Complete sequence and genomic analysis of murine gammaherpesvirus 68. J Virol 71 : 5894–5904.
8. SimasJP, MarquesS, BridgemanA, EfstathiouS, AdlerH (2004) The M2 gene product of murine gammaherpesvirus 68 is required for efficient colonization of splenic follicles but is not necessary for expansion of latently infected germinal centre B cells. J Gen Virol 85 : 2789–2797.
9. FlanoE, KimIJ, WoodlandDL, BlackmanMA (2002) Gamma-herpesvirus latency is preferentially maintained in splenic germinal center and memory B cells. J Exp Med 196 : 1363–1372.
10. MarquesS, EfstathiouS, SmithKG, HauryM, SimasJP (2003) Selective gene expression of latent murine gammaherpesvirus 68 in B lymphocytes. J Virol 77 : 7308–7318.
11. BennettNJ, MayJS, StevensonPG (2005) Gamma-herpesvirus latency requires T cell evasion during episome maintenance. PLoS Biol 3: e120.
12. LevitskayaJ, CoramM, LevitskyV, ImrehS, Steigerwald-MullenPM, et al. (1995) Inhibition of antigen processing by the internal repeat region of the Epstein-Barr virus nuclear antigen-1. Nature 375 : 685–688.
13. HislopAD, RessingME, van LeeuwenD, PudneyVA, HorstD, et al. (2007) A CD8+ T cell immune evasion protein specific to Epstein-Barr virus and its close relatives in Old World primates. J Exp Med 204 : 1863–1873.
14. HorstD, van LeeuwenD, CroftNP, GarstkaMA, HislopAD, et al. (2009) Specific targeting of the EBV lytic phase protein BNLF2a to the transporter associated with antigen processing results in impairment of HLA class I-restricted antigen presentation. J Immunol 182 : 2313–2324.
15. CroftNP, Shannon-LoweC, BellAI, HorstD, KremmerE, et al. (2009) Stage-specific inhibition of MHC class I presentation by the Epstein-Barr virus BNLF2a protein during virus lytic cycle. PLoS Pathog 5: e1000490.
16. ZuoJ, CurrinA, GriffinBD, Shannon-LoweC, ThomasWA, et al. (2009) The Epstein-Barr virus G-protein-coupled receptor contributes to immune evasion by targeting MHC class I molecules for degradation. PLoS Pathog 5: e1000255.
17. ZuoJ, QuinnLL, TamblynJ, ThomasWA, FeederleR, et al. (2011) The Epstein-Barr virus-encoded BILF1 protein modulates immune recognition of endogenously processed antigen by targeting major histocompatibility complex class I molecules trafficking on both the exocytic and endocytic pathways. J Virol 85 : 1604–1614.
18. FruhK, BarteeE, GouveiaK, MansouriM (2002) Immune evasion by a novel family of viral PHD/LAP-finger proteins of gamma-2 herpesviruses and poxviruses. Virus Res 88 : 55–69.
19. BonameJM, StevensonPG (2001) MHC class I ubiquitination by a viral PHD/LAP finger protein. Immunity 15 : 627–636.
20. BonameJM, de LimaBD, LehnerPJ, StevensonPG (2004) Viral degradation of the MHC class I peptide loading complex. Immunity 20 : 305–317.
21. BonameJM, MayJS, StevensonPG (2005) The murine gamma-herpesvirus-68 MK3 protein causes TAP degradation independent of MHC class I heavy chain degradation. Eur J Immunol 35 : 171–179.
22. StevensonPG, MayJS, SmithXG, MarquesS, AdlerH, et al. (2002) K3-mediated evasion of CD8(+) T cells aids amplification of a latent gamma-herpesvirus. Nat Immunol 3 : 733–740.
23. RodriguesL, Pires de MirandaM, CalocaMJ, BusteloXR, SimasJP (2006) Activation of Vav by the gammaherpesvirus M2 protein contributes to the establishment of viral latency in B lymphocytes. J Virol 80 : 6123–6135.
24. Pires de MirandaM, LopesFB, McVeyCE, BusteloXR, SimasJP (2013) Role of Src homology domain binding in signaling complexes assembled by the murid gamma-herpesvirus M2 protein. J Biol Chem 288 : 3858–3870.
25. SiegelAM, HerskowitzJH, SpeckSH (2008) The MHV68 M2 protein drives IL-10 dependent B cell proliferation and differentiation. PLoS Pathog 4: e1000039.
26. RangaswamyUS, SpeckSH (2014) Murine gammaherpesvirus M2 protein induction of IRF4 via the NFAT pathway leads to IL-10 expression in B cells. PLoS Pathog 10: e1003858.
27. BurkhardtAL, BolenJB, KieffE, LongneckerR (1992) An Epstein-Barr virus transformation-associated membrane protein interacts with src family tyrosine kinases. J Virol 66 : 5161–5167.
28. LeeH, GuoJ, LiM, ChoiJK, DeMariaM, et al. (1998) Identification of an immunoreceptor tyrosine-based activation motif of K1 transforming protein of Kaposi's sarcoma-associated herpesvirus. Mol Cell Biol 18 : 5219–5228.
29. MarquesS, AlenquerM, StevensonPG, SimasJP (2008) A single CD8+ T cell epitope sets the long-term latent load of a murid herpesvirus. PLoS Pathog 4: e1000177.
30. WangX, LiuX, JiaY, ChaoY, XingX, et al. (2010) Widespread sequence variation in the Epstein-Barr virus latent membrane protein 2A gene among northern Chinese isolates. J Gen Virol 91 : 2564–2573.
31. StebbingJ, BourbouliaD, JohnsonM, HendersonS, WilliamsI, et al. (2003) Kaposi's sarcoma-associated herpesvirus cytotoxic T lymphocytes recognize and target Darwinian positively selected autologous K1 epitopes. J Virol 77 : 4306–4314.
32. GuihotA, DupinN, MarcelinAG, GorinI, BedinAS, et al. (2006) Low T cell responses to human herpesvirus 8 in patients with AIDS-related and classic Kaposi sarcoma. J Infect Dis 194 : 1078–1088.
33. BranderC, O'ConnorP, SuscovichT, JonesNG, LeeY, et al. (2001) Definition of an optimal cytotoxic T lymphocyte epitope in the latently expressed Kaposi's sarcoma-associated herpesvirus kaposin protein. J Infect Dis 184 : 119–126.
34. HusainSM, UsherwoodEJ, DysonH, ColecloughC, CoppolaMA, et al. (1999) Murine gammaherpesvirus M2 gene is latency-associated and its protein a target for CD8(+) T lymphocytes. Proc Natl Acad Sci U S A 96 : 7508–7513.
35. UsherwoodEJ, RoyDJ, WardK, SurmanSL, DutiaBM, et al. (2000) Control of gammaherpesvirus latency by latent antigen-specific CD8(+) T cells. J Exp Med 192 : 943–952.
36. StevensonPG, CardinRD, ChristensenJP, DohertyPC (1999) Immunological control of a murine gammaherpesvirus independent of CD8+ T cells. J Gen Virol 80 (Pt 2) 477–483.
37. TibbettsSA, van DykLF, SpeckSH, VirginHWt (2002) Immune control of the number and reactivation phenotype of cells latently infected with a gammaherpesvirus. J Virol 76 : 7125–7132.
38. MidgleyRS, BellAI, McGeochDJ, RickinsonAB (2003) Latent gene sequencing reveals familial relationships among Chinese Epstein-Barr virus strains and evidence for positive selection of A11 epitope changes. J Virol 77 : 11517–11530.
39. MidgleyRS, BellAI, YaoQY, Croom-CarterD, HislopAD, et al. (2003) HLA-A11-restricted epitope polymorphism among Epstein-Barr virus strains in the highly HLA-A11-positive Chinese population: incidence and immunogenicity of variant epitope sequences. J Virol 77 : 11507–11516.
40. ChenY, YaoK, WangB, QingJ, LiuG (2008) Potent dendritic cell vaccine loaded with latent membrane protein 2A (LMP2A). Cell Mol Immunol 5 : 365–372.
41. ViganoS, UtzschneiderDT, PerreauM, PantaleoG, ZehnD, et al. (2012) Functional avidity: a measure to predict the efficacy of effector T cells? Clin Dev Immunol 2012 : 153863.
42. MatsumuraM, SaitoY, JacksonMR, SongES, PetersonPA (1992) In vitro peptide binding to soluble empty class I major histocompatibility complex molecules isolated from transfected Drosophila melanogaster cells. J Biol Chem 267 : 23589–23595.
43. SchumacherTN, HeemelsMT, NeefjesJJ, KastWM, MeliefCJ, et al. (1990) Direct binding of peptide to empty MHC class I molecules on intact cells and in vitro. Cell 62 : 563–567.
44. ChenW, KhilkoS, FecondoJ, MarguliesDH, McCluskeyJ (1994) Determinant selection of major histocompatibility complex class I-restricted antigenic peptides is explained by class I-peptide affinity and is strongly influenced by nondominant anchor residues. J Exp Med 180 : 1471–1483.
45. FremontDH, SturaEA, MatsumuraM, PetersonPA, WilsonIA (1995) Crystal structure of an H-2Kb-ovalbumin peptide complex reveals the interplay of primary and secondary anchor positions in the major histocompatibility complex binding groove. Proc Natl Acad Sci U S A 92 : 2479–2483.
46. AlamSM, TraversPJ, WungJL, NasholdsW, RedpathS, et al. (1996) T-cell-receptor affinity and thymocyte positive selection. Nature 381 : 616–620.
47. ZehnD, LeeSY, BevanMJ (2009) Complete but curtailed T-cell response to very low-affinity antigen. Nature 458 : 211–214.
48. JamesonSC, CarboneFR, BevanMJ (1993) Clone-specific T cell receptor antagonists of major histocompatibility complex class I-restricted cytotoxic T cells. J Exp Med 177 : 1541–1550.
49. HogquistKA, JamesonSC, HeathWR, HowardJL, BevanMJ, et al. (1994) T cell receptor antagonist peptides induce positive selection. Cell 76 : 17–27.
50. CollinsCM, BossJM, SpeckSH (2009) Identification of infected B-cell populations by using a recombinant murine gammaherpesvirus 68 expressing a fluorescent protein. J Virol 83 : 6484–6493.
51. StevensonPG, BelzGT, AltmanJD, DohertyPC (1999) Changing patterns of dominance in the CD8+ T cell response during acute and persistent murine gamma-herpesvirus infection. Eur J Immunol 29 : 1059–1067.
52. PriceDA, BrenchleyJM, RuffLE, BettsMR, HillBJ, et al. (2005) Avidity for antigen shapes clonal dominance in CD8+ T cell populations specific for persistent DNA viruses. J Exp Med 202 : 1349–1361.
53. CallanMF, StevenN, KrausaP, WilsonJD, MossPA, et al. (1996) Large clonal expansions of CD8+ T cells in acute infectious mononucleosis. Nat Med 2 : 906–911.
54. HislopAD, TaylorGS, SauceD, RickinsonAB (2007) Cellular responses to viral infection in humans: lessons from Epstein-Barr virus. Annu Rev Immunol 25 : 587–617.
55. EhtishamS, Sunil-ChandraNP, NashAA (1993) Pathogenesis of murine gammaherpesvirus infection in mice deficient in CD4 and CD8 T cells. J Virol 67 : 5247–5252.
56. FredericoB, ChaoB, MayJS, BelzGT, StevensonPG (2014) A murid gamma-herpesviruses exploits normal splenic immune communication routes for systemic spread. Cell Host Microbe 15 : 457–470.
57. SmithCM, GillMB, MayJS, StevensonPG (2007) Murine gammaherpesvirus-68 inhibits antigen presentation by dendritic cells. PLoS ONE 2: e1048.
58. El-GogoS, FlachB, StaibC, SutterG, AdlerH (2008) In vivo attenuation of recombinant murine gammaherpesvirus 68 (MHV-68) is due to the expression and immunogenicity but not to the insertion of foreign sequences. Virology 380 : 322–327.
59. LohJ, PopkinDL, DroitL, BraatenDC, ZhaoG, et al. (2012) Specific mutation of a gammaherpesvirus-expressed antigen in response to CD8 T cell selection in vivo. J Virol 86 : 2887–2893.
60. CardinRD, BrooksJW, SarawarSR, DohertyPC (1996) Progressive loss of CD8+ T cell-mediated control of a gamma-herpesvirus in the absence of CD4+ T cells. J Exp Med 184 : 863–871.
61. BelzGT, StevensonPG, CastrucciMR, AltmanJD, DohertyPC (2000) Postexposure vaccination massively increases the prevalence of gamma-herpesvirus-specific CD8+ T cells but confers minimal survival advantage on CD4-deficient mice. Proc Natl Acad Sci U S A 97 : 2725–2730.
Štítky
Hygiena a epidemiologie Infekční lékařství LaboratořČlánek vyšel v časopise
PLOS Pathogens
2014 Číslo 6
- Farmakovigilanční studie perorálních antivirotik indikovaných v léčbě COVID-19
- Jak souvisí postcovidový syndrom s poškozením mozku?
- Měli bychom postcovidový syndrom léčit antidepresivy?
- 10 bodů k očkování proti COVID-19: stanovisko České společnosti alergologie a klinické imunologie ČLS JEP
Nejčtenější v tomto čísle
- Fungal Nail Infections (Onychomycosis): A Never-Ending Story?
- Profilin Promotes Recruitment of Ly6C CCR2 Inflammatory Monocytes That Can Confer Resistance to Bacterial Infection
- IscR Is Essential for Type III Secretion and Virulence
- Contribution of Specific Residues of the β-Solenoid Fold to HET-s Prion Function, Amyloid Structure and Stability