
Sex-Specific Genetic Structure and Social Organization in Central Asia: Insights from a Multi-Locus Study
In the last two decades, mitochondrial DNA (mtDNA) and the non-recombining portion of the Y chromosome (NRY) have been extensively used in order to measure the maternally and paternally inherited genetic structure of human populations, and to infer sex-specific demography and history. Most studies converge towards the notion that among populations, women are genetically less structured than men. This has been mainly explained by a higher migration rate of women, due to patrilocality, a tendency for men to stay in their birthplace while women move to their husband's house. Yet, since population differentiation depends upon the product of the effective number of individuals within each deme and the migration rate among demes, differences in male and female effective numbers and sex-biased dispersal have confounding effects on the comparison of genetic structure as measured by uniparentally inherited markers. In this study, we develop a new multi-locus approach to analyze jointly autosomal and X-linked markers in order to aid the understanding of sex-specific contributions to population differentiation. We show that in patrilineal herder groups of Central Asia, in contrast to bilineal agriculturalists, the effective number of women is higher than that of men. We interpret this result, which could not be obtained by the analysis of mtDNA and NRY alone, as the consequence of the social organization of patrilineal populations, in which genetically related men (but not women) tend to cluster together. This study suggests that differences in sex-specific migration rates may not be the only cause of contrasting male and female differentiation in humans, and that differences in effective numbers do matter.
Published in the journal:
. PLoS Genet 4(9): e32767. doi:10.1371/journal.pgen.1000200
Category:
Research Article
doi:
https://doi.org/10.1371/journal.pgen.1000200
Summary
In the last two decades, mitochondrial DNA (mtDNA) and the non-recombining portion of the Y chromosome (NRY) have been extensively used in order to measure the maternally and paternally inherited genetic structure of human populations, and to infer sex-specific demography and history. Most studies converge towards the notion that among populations, women are genetically less structured than men. This has been mainly explained by a higher migration rate of women, due to patrilocality, a tendency for men to stay in their birthplace while women move to their husband's house. Yet, since population differentiation depends upon the product of the effective number of individuals within each deme and the migration rate among demes, differences in male and female effective numbers and sex-biased dispersal have confounding effects on the comparison of genetic structure as measured by uniparentally inherited markers. In this study, we develop a new multi-locus approach to analyze jointly autosomal and X-linked markers in order to aid the understanding of sex-specific contributions to population differentiation. We show that in patrilineal herder groups of Central Asia, in contrast to bilineal agriculturalists, the effective number of women is higher than that of men. We interpret this result, which could not be obtained by the analysis of mtDNA and NRY alone, as the consequence of the social organization of patrilineal populations, in which genetically related men (but not women) tend to cluster together. This study suggests that differences in sex-specific migration rates may not be the only cause of contrasting male and female differentiation in humans, and that differences in effective numbers do matter.
Introduction
Understanding the extent to which sex-specific processes shape human genetic diversity has long been a matter of great interest for human population geneticists [1],[2]. To date, as detailed in Table 1, the focus has mainly been on the analysis of uniparentally inherited markers: mitochondrial DNA (mtDNA) and the non-recombining portion of the Y chromosome (NRY). A large number of studies have found that the level of differentiation was greater for the Y chromosome than for mtDNA, both at a global [3] and a local scale [4]–[11], for a review see [12]. This result has mainly been explained by patrilocality, a widespread tendency for men to stay in their birthplace while women move to their husband's house [13] (see Table 1 for more detailed interpretations). This hypothesis of a higher migration rate of women has been especially strengthened by the comparison of patrilocal and matrilocal populations at a local scale [14]–[17]. These studies have shown that in patrilocal populations, genetic differentiation is stronger among men than among women, while the reverse is observed in matrilocal populations. It is also noteworthy that the absolute difference between male and female genetic structure is more pronounced in patrilocal than in matrilocal populations [16]. Interestingly, while social practices seem to consistently influence the sex-specific demography at a local scale, the robustness of a sex-specific genetic structure at a global scale is still a challenging issue (see Table 1). A recent analysis of mtDNA and NRY variation at a global scale, which used the same panel of populations for both categories of markers (an omission that was criticized in Seielstad et al.'s [3] study [18]) showed no difference between the male and female genetic structure [19]. Consistent with this result, an analysis of the autosomal and X-linked microsatellite markers in the HGDP-CEPH Human Genome Diversity Cell Line Panel showed no major differences between the demographic history of men and women [20]. The apparent paradox between local and global trends can be resolved though, since the geographical clustering of populations with potentially different lifestyles may minimize the differences in sex-specific demography at a global scale [21],[22]. It may also be that the global structure reflects more ancient, pre-agricultural, social patterns, as patrilocality may only have increased in human societies only with the recent transition to agriculture [12].
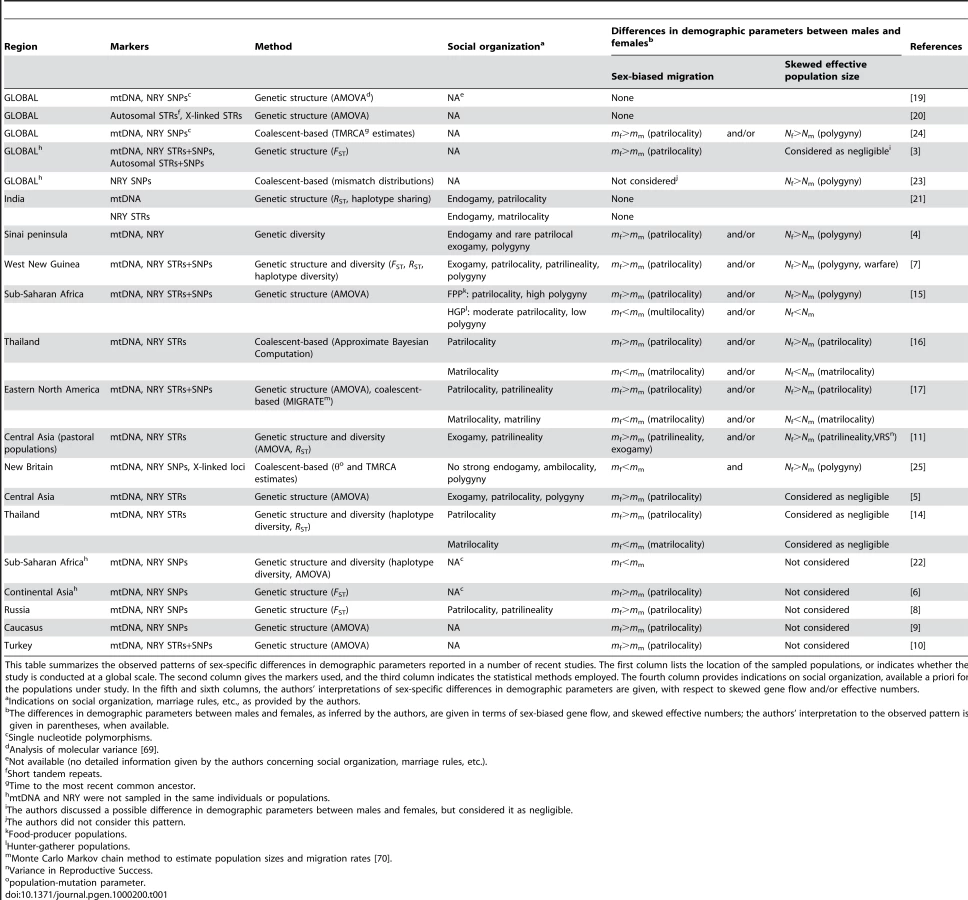
The higher differentiation level found on the NRY as compared to mtDNA at a local scale could also be the consequence of a higher effective number of women, for example through the practice of polygyny, a tendency for men (but not for women) to have multiple mates [4], [7], [15], [23]–[25], and/or through the paternal transmission of reproductive success [11]. However, the influence of such processes on genetic structure has often been considered as negligible, since realistic rates of polygyny cannot create large differences in male and female genetic structure [3],[5],[14]. Hence, until now, the effect of local social processes on male and female effective numbers has not been investigated directly, possibly because current methods fail to unravel the relative contribution of effective number and migration rate on the differentiation level [26]. The consequence is that the vast majority of studies fail to show whether the observed differentiation arises from sex-specific differences in migration rate, effective numbers, or both (see Table 1). New methods need therefore to be developed in order to appreciate the relative influence of sex-biased dispersal and differences in effective numbers on genetic structure.
Another limitation to the use of uniparentally inherited markers stems from the fact that each of them is, in effect, a single genetic locus. For that reason, we cannot test for the robustness of the sex-specific genetic structure on these markers. We cannot either rule out the possibility that mtDNA and NRY, which contain multiple linked genes, may be shaped by selection [27],[28]. This raises the question of whether results based on uniparentally inherited markers simply reflect stochastic variation, or real differences in sex-specific demography. To answer this question, we propose a novel approach based on the joint analysis of autosomal and X-linked markers. This multi-locus analysis has the potential of providing more robust information, as these markers give an independent picture of sex-specific demography. This approach also aims to disentangle the effects of sex-biased dispersal and effective numbers on genetic structure.
In order to recognize the impact of social organization on these differences, we investigate sex-specific genetic structure in human populations of Central Asia (Figure 1), where various ethnic groups, characterized by different languages, lifestyles and social organizations, co-exist. Although all groups share a patrilocal organization, Tajiks (sedentary agriculturalists) are bilineal, i.e. they are organized into nuclear or extended families where blood links and rights of inheritance through both male and female ancestors are of equal importance, and they preferentially establish endogamous marriages with cousins. By contrast, Kazaks, Karakalpaks, Kyrgyz and Turkmen (traditionally nomadic herders) are patrilineal, i.e. they are organized into paternal descent groups (tribes, clans, lineages), and they practice exogamous marriages, in which a man chooses a bride from a different clan.

Results/Discussion
Uniparentally-Inherited Markers
We sampled 780 healthy adult men from 10 populations of bilineal agriculturalists and 11 populations of patrilineal herders from West Uzbekistan to East Kyrgyzstan, representing 5 ethnic groups (Tajiks, Kyrgyz, Karakalpaks, Kazaks, and Turkmen) (see Figure 1 and Table 2). We genotyped all bilineal populations, and 8 out of 11 patrilineal populations at the HVS-I locus of mtDNA, and at 11 microsatellite markers on the NRY (for more details on the markers used, see Table 3). The overall genetic differentiation was higher for NRY, as compared to mtDNA, both among the 10 bilineal agriculturalist populations , and among the subset of 8 patrilineal herder populations . Assuming an island model of population structure, this implies that female migration rate (mf), and/or the effective number of females (Nf), is higher than of the corresponding parameters for males (mm and Nm). These results also suggest that the differences in sex-specific genetic structure are much more pronounced in the patrilineal herders than in the bilineal agriculturalists. From the above FST estimates, we obtained the female-to-male ratio of the effective number of migrants per generation (see the Methods section for details): Nfmf/Nmmm≈2.1 for bilineal populations and Nfmf/Nmmm≈21.6 for patrilineal populations. The ratio in patrilineal populations is thus one order of magnitude higher than in bilineal populations. However, since each of these markers is a single genetic locus, we cannot test for the robustness of the sex-specific genetic structure on these markers. We therefore examined the amount of information contained in multi-locus data on autosomal and X-linked markers, both of which average over male and female histories.


A New Multi-Locus Approach
In the infinite island model of population structure with two classes of individuals (males and females), we obtained the following expressions of FST (see the Methods section for details):(1)for autosomal genes, and(2)for X-linked genes. A special case of interest occurs when , i.e. when the differentiation of X-linked genes exactly equals that of autosomal genes. Combining eqs (1) and (2), we find that this occurs for , with N = Nf+Nm and m = mf+mm. Furthermore, as shown in Figure 2, if we observe a lower genetic differentiation of autosomal markers, as compared to X-linked markers (blue zone in Figure 2), this suggests that . This may happen, e.g., for Nf = Nm and mf = mm, i.e. for equal effective numbers of males and females and unbiased dispersal. But if autosomal markers are more differentiated than X-linked markers (, see the red upper-right triangle in Figure 2), this implies that . In this case, since mf/m and Nf/N are ratios varying between 0 and 1, the effective number of females must be higher than that of males (Nf>Nm), and the female migration rate must be higher than half the male migration rate (mf>mm/2). Hence, a prediction from this model is that when , the effective number of females is higher than that of males, whatever the pattern of sex-specific dispersal. This suggests that it is indeed possible to test for differences in effective numbers between males and females from the joint analysis of autosomal and X-linked data. We note however that when , we cannot conclude on the relative male and female effective numbers and migration rates.

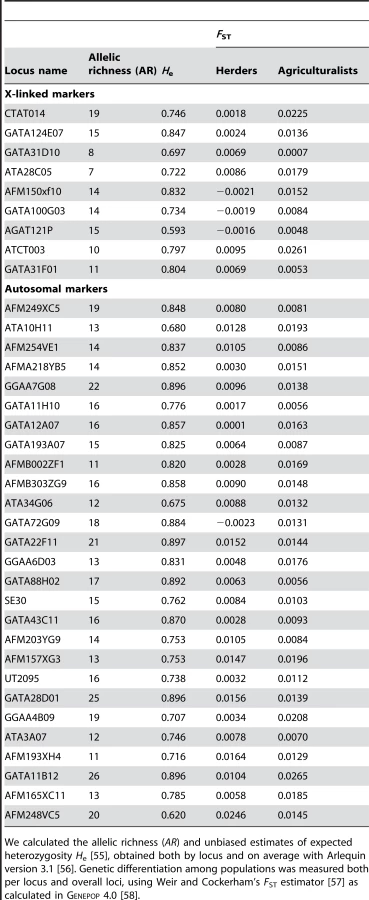
We tested the above prediction in the 10 bilineal agriculturalist populations and 11 patrilineal herder populations sampled in Central Asia by comparing the genetic structure estimated from 27 unlinked polymorphic autosomal microsatellite markers (AR = 16.2, He = 0.803 on average) to that from 9 unlinked polymorphic X-linked microsatellite markers (AR = 12.6, He = 0.752 on average) (for more details on the markers used, see Table 4). Overall heterozygosity was not significantly different between X-linked and autosomal markers, neither in the pooled sample (two-tailed Wilcoxon sum rank test; p = 0.09), nor in the bilineal agriculturalists (p = 0.13) or the patrilineal herders (p = 0.12). The overall population structure was significantly higher for autosomal as compared to X-linked markers among patrilineal herders: (one-tailed Wilcoxon sum rank test; ; p = 0.02). Among bilineal agriculturalists, the result was not significant: (p = 0.36). From these results, and following our model predictions, we conclude that in patrilineal herders (where ), the effective number of females is higher than that of males. This conclusion does not hold for the bilineal agriculturalists.
From our model, it is possible to get more precise indications on the sets of (Nf/N, mf/m) values that are compatible with our data. Rearranging eqs (1–2), we get:(3)i.e.:(4)
For any given set of (Nf/N, mf/m) values, we can therefore calculate from eq. (4) the expected value of for each estimate in the dataset. We can then test the null hypothesis by comparing the distribution of observed and expected values. If the hypothesis can be rejected at the α = 0.05 level, then the corresponding set of (Nf/N, mf/m) values can also be rejected. Following Ramachandran et al. [20], we varied the values of the ratios Nf/N and mf/m (respectively, the female fraction of effective number, and the female fraction of the total migration rate) from 0 to 1, with an interval of 0.01 between consecutive values. For each set of (Nf/N, mf/m) values, we applied the transformation in eq. (4) to each of the 27 locus-specific values observed. Thus, for each set of (Nf/N, mf/m) values, we obtained 27 expected values of , given our data. These expected values of were then compared to the 9 observed locus-specific in our dataset, and we calculated the p-value for a two-sided Wilcoxon sum rank test between the list of 27 expected values and the 9 observed in the dataset. The results are depicted in Figure 3. Significant p-values (p≤0.05) correspond to a significant difference between the observed and expected values, thus to sets of (Nf/N, mf/m) values that are rejected, given our data (see the blue region in Figure 3). Conversely, non-significant p-values (p>0.05) correspond to sets of (Nf/N, mf/m) values that cannot be rejected (see the red region in Figure 3).

For the patrilineal herder populations (Figures 3A–3B), most sets of (Nf/N, mf/m) values are rejected, except those corresponding to larger effective numbers for females (from Figures 3A–3B: Nf/N>0.55, i.e. Nf>1.27Nm) and mf>0.67mm. Because the multi-locus estimate of is significantly higher than the estimate of , we expected to find such patterns of non-significant values (see Figure 2). For the bilineal agriculturalist populations, we could not reject the hypothesis that the effective numbers and migration rates are equal across males and females or even lower in females (see Figures 3C–3D). This is also reflected by the fact that the estimates of were not significantly higher than the estimates of in those populations.
Finally, we have shown that the effective number of women is higher than that of men among patrilineal herders, but not necessarily among bilineal agriculturalists. Furthermore, a close inspection of the results depicted in Figures 3A and 3B reveals that, among herders, we reject all the sets of (Nf/N, mf/m) values for which mf<mm at the α = 0.10 level. This is not true for agriculturalists. This suggests that the migration rates are also likely to be higher for women than for men in patrilineal populations, as compared to bilineal populations (compare Figures 3B and 3D). Although both groups are patrilocal, such a difference in sex-specific migration patterns might be expected, since patrilineal herders are exogamous (among clans) and bilineal agriculturalists are preferentially endogamous. For example, it was observed that in patrilocal and matrilocal Indian populations, where migrations are strictly confined within endogamous groups, sex-specific patterns were not influenced by post-marital residence [21].
What Could Explain a Larger Effective Number of Females?
While an influence of post-marital residence on the migration rate of women and men has already been widely proposed [14]–[17] (see also Table 1), the factors that may locally affect the effective number of women, relatively to that of men, are not well recognized. As seen in Table 1, although a number of studies have compared matrilocal and patrilocal populations, few have compared contrasting groups of populations with respect to other factors as, e.g., the tendency for polygyny [15]. Furthermore, a number of these studies lack ethnological information a priori, concerning social organization, marriage rules, etc., which makes interpretation somewhat difficult (see Table 1). Here, we compared two groups of patrilocal populations with contrasting social organizations, and at least five non-mutually exclusive interpretations for a larger effective number of females can be invoked:
-
Social organization, i.e. the way children are affiliated to their parents, can deeply affect sex-specific genetic variation. In Central Asia, herder populations are organized in patrilineal descent groups (tribes, clans, lineages). This implies that children are systematically affiliated with the descent groups of the father. Chaix et al. [11] showed that the average number of individuals carrying the same Y chromosome haplotype was much higher in patrilineal herder populations than in bilineal agriculturalist populations (where children are affiliated both to the mother and the father). These “identity cores” would be the direct consequence of the internal dynamics of their patrilineal organization. Indeed, the descent groups are not formed randomly and related men tend to cluster together, e.g. through the recurrent lineal fission of one population into new groups. This particular dynamics increases relatedness among men, and may therefore reduce the effective number of men, as compared to women.
-
Indirectly, the social organization can also deflate the effective number of men through the transmission of reproductive success [29] if this success is culturally transmitted exclusively from fathers to sons. Because herders are patrilineal (so that inheritance is organized along paternal descent groups), social behaviors are more likely to be inherited through the paternal line of descent only. It has recently been argued that the rapid spread of Genghis Khan's patrilineal descendants throughout Central Asia was explained by this social selection phenomenon [30]. The correlation of fertility through the patriline has also been described in patrilineal tribes in South America [31]. By contrast, in bilineal societies such as the agriculturalists of Central Asia, social behaviors that influence reproductive success are more likely to be transmitted by both sexes. Furthermore, differences of cultural transmission of fitness between hunter-gatherers and agriculturalists have already been reported [32]. Interestingly, a slightly higher matrilineal intergenerational correlation in offspring number has been observed in the Icelandic population, which suggests that in some populations, reproductive behaviors can be maternally-inherited [33].
-
Polygyny, in which the husband may have multiple wives, has often been invoked as a factor that could reduce the effective number of men [4], [7], [15], [23]–[25]. While we could not find any evidence of polygyny in present-day Central Asian populations, this custom was traditionally practiced in the nomadic herder Kazak populations, although limited to the top 10 percent of men from the highest social rank [5],[34]. Hence, even though we lack ethnological data to determine to what extent herders are or were practicing polygyny in a recent past, the practice of polygyny among herders in Central Asia might have influenced (at least partially) the observed differences in men and women effective numbers.
-
Recurrent bottlenecks in men due to a higher pre-reproductive mortality could also severely reduce the effective numbers of men. From the study of several groups in West Papua and Papua New Guinea [7],[35], it appears that warfare may indeed lead to the quasi-extinction of adult men in some communities, while the mass killing of adult women is far more rarely reported. However, this differential mortality could also be balanced by potentially high death rates of women during childbirth. In any case, a differential mortality is equally likely to arise in herder and agriculturalist populations. It may therefore not be relevant in explaining why we detect higher effective numbers of women (as compared to men) in patrilineal herders and not in bilineal agriculturalists.
-
Since our approach implicitly assumes equal male and female generation time, the observed higher effective number of women, relatively to that of men, could result from a shorter generation time for women, due to the tendency of women to reproduce earlier in life than men and the ability of men to reproduce at a later age than women. This has indeed been described in a number of populations with different lifestyles, from complete genealogical records or mean-age-at-first-marriage databases [33],[36],[37]. It has even been proposed to be a nearly universal trait in humans, although its magnitude varies across regions and cultures [37]. Tang et al. [38] suggested that accounting for longer generation time in males could minimize the difference between maternal and paternal demography. However, the differences in sex-specific generation times that have been reported (e.g., 28 years for the matrilines and 31 years for the patrilines in Iceland [33], 29 years for the matrilines and 35 years for the patrilines in Quebec [36]) are unlikely to explain the observed differences in male and female effective numbers [24].
Limits of the Approach
There might also be non-biological explanations of our results, however, as they are based on the simplifying assumptions of Wright's infinite island model of population structure [39]. This model assumes (i) that there is no selection and that mutation is negligible, (ii) that each population has the same size, and sends and receives a constant fraction of its individuals to or from a common migrant pool each generation (so that geographical structure is absent), and (iii) that equilibrium is reached between migration, mutation and drift. On the first point, we did not find any evidence of selection, for any marker, based on Beaumont and Nichols' method [40] for detecting selected markers from the analysis of the null distribution generated by a coalescent-based simulation model (data not shown). As for the second point, we tested for the significance of the correlation between the pairwise FST/(1−FST) estimates and the natural logarithm of their geographical distances [41]. We found no evidence for isolation by distance, either for X-linked markers (p = 0.47 for agriculturalists, p = 0.24 for herders), or for autosomal markers (p = 0.92 for agriculturalists, p = 0.45 for herders). As for the third point, the X-to-autosomes (X/A) effective size ratio can significantly deviate from the expected three-quarters (assuming equal effective numbers of men and women) following a bottleneck or an expansion [42]. This is because X-linked genes have a smaller effective size, and hence reach equilibrium more rapidly. After a reduction of population size, the X/A diversity ratio is lower than expected, while after an expansion, the diversity of X-linked genes recovers faster than on the autosomes, and the X/A diversity ratio is then closer to unity. In the latter case, would be reduced and could then tend towards . However, neither reduction nor expansion should lead to , as we found in herder populations of Central Asia. Therefore, we do not expect the limits of Wright's island model to undermine our approach.
Evaluation by Means of Stochastic Simulations
We aimed to investigate to what extent the approach proposed here is able to detect differences in male and female effective numbers. To do this, we performed coalescent simulations in a finite island model, for a wide range of (Nf/N, mf/m) values. The simulation parameters were set to match those of our dataset: 11 sampled demes, 30 males genotyped at 27 autosomal and 9 X-linked markers per deme (for further details concerning the simulations, see the Methods section). We used 1421 sets of (Nf/N, mf/m) values, covering the whole parameter space (represented as white dots in Figure 4B). For each set of (Nf/N, mf/m) parameter values, we simulated 100 independent datasets. For each dataset, we calculated the estimates of at all loci, and we calculated the p-value for a one-sided Wilcoxon sum rank test for the list of estimates . Hence, for each set of (Nf/N, mf/m) parameter values, we could calculate the proportion of significant tests at the α = 0.05 level, among the 100 independent datasets. Figure 4 shows the distribution of the percentage of significant tests in the (Nf/N, mf/m) parameter space. Theory predicts that in the upper-right triangle where , we should have . One can see from Figure 4 that, given the simulation parameters used, the method is conservative: the proportion of significant tests at the α = 0.05 level is null outside of the upper-right triangle. However, we find a fairly large proportion of significant tests for large Nf/N and mf/m ratios which indicates (i) that the method presented here has the potential to detect differences in male and female effective numbers, but (ii) that only strong differences might be detected, for similarly sized datasets as the one considered here.

Robustness to the Sampling Scheme
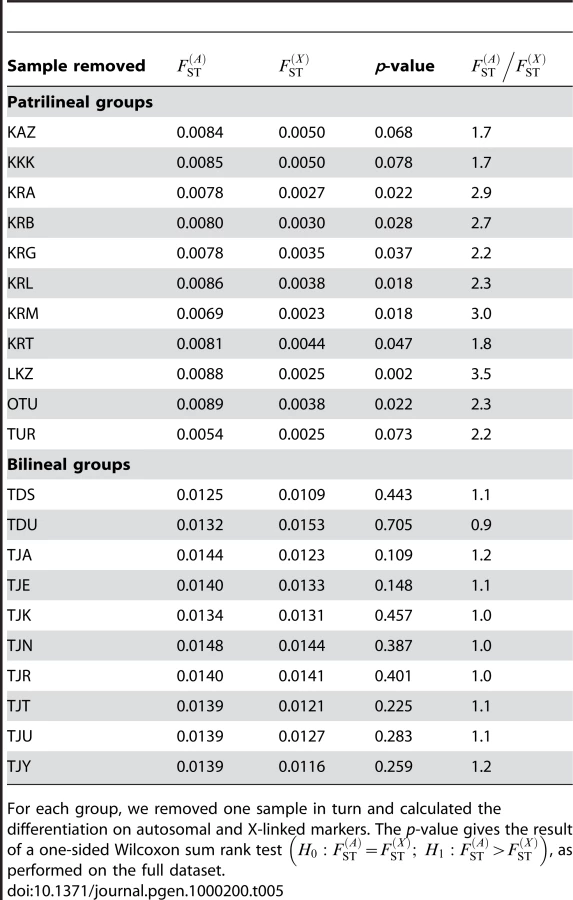
We also aimed to investigate whether the results obtained here were robust to our sampling scheme, and that our results were not biased by the inclusion of particular populations. To do this, we re-analyzed both the bilineal agriculturalists and the patrilineal herders datasets, removing one population at a time in each group. For each of these jackknifed datasets, we calculated the p-value of a one-sided Wilcoxon sum rank test , as done on the full datasets. The results are given in Table 5. We found no significant test for any of the bilineal agriculturalist groupings (p>0.109), which supports the idea that, in those populations, both the migration rate and the number of reproductive individuals can be equal for both sexes. In patrilineal herders, the tests were significant at the α = 0.05 level for 8 out of 11 population groupings. For the 3 other groupings, the p-values were 0.068, 0.078 and 0.073 (see Table 5). Overall, the ratio of multi-locus estimates ranged from 1.7 to 3.5 in patrilineal herders (and from 0.9 to 1.2 in bilineal agriculturalists). Although in some particular groupings of patrilineal herder populations, the difference in the distributions of may not be strong enough to be significant, we can clearly distinguish the pattern of differentiation for autosomal and X-linked markers in patrilineal and bilineal groups. Results from coalescent simulations (see above) suggest that this lack of statistical power might be expected for ratios close to unity. Indeed, we found that the tests were more likely to be significant for fairly large Nf/N and mf/m ratios (the upper-right red region in Figure 4) which would correspond to ratios much greater than one.
Comparison with Uniparentally-Inherited Markers
Importantly, our results on X-linked and autosomal markers are consistent with those obtained from NRY and mtDNA (see Figures 3B–3D): in these figures, the dashed line gives all the sets of (Nf/N, mf/m) values that are compatible with the observed estimates. These are the sets of values that satisfy for the bilineal populations, and for the patrilineal populations, since we inferred Nfmf/Nmmm≈2.1 and Nfmf/Nmmm≈21.6, respectively, for the two groups. For the bilineal agriculturalists (Figure 3D), the set of (Nf/N, mf/m) values inferred from the estimates fall within the range that was not rejected, given our data on X-linked and autosomal markers. For the patrilineal herders (Figure 3B), the overlap is only partial: from the NRY and mtDNA data only, low Nf/N ratios associated with high mf/m ratios are as likely as high Nf/N ratios associated with low mf/m ratios. Yet, it is clear from this figure that a large set of (Nf/N, mf/m) values inferred from the single-locus estimates can be rejected, given the observed differentiation on X-linked and autosomal markers. All genetic systems (mtDNA, NRY, X-linked and autosomal markers) converge toward the notion that patrilineal herders, in contrast to bilineal agriculturalists, have a strong sex-specific genetic structure. Yet, the information brought by X-linked and autosomal markers is substantial, since we show that this is likely due to both higher migration rates and larger effective numbers for women than for men.
Comparison with Other Studies
Our results, based on the X chromosome and the autosomes, also confirm previous analyses based on the mtDNA and the NRY, showing that men are genetically more structured than women in other patrilocal populations [3]–[10], [14]–[17] (see also Table 1). A handful of studies have also shown a reduced effective number of men compared to that of women, based on coalescent methods [23],[24], but none have considered the influence of social organization on this dissimilarity (see Table 1).
In some respects, our results contrast with those of Wilder and Hammer [25], who studied sex-specific population genetic structure among the Baining of New Britain, using mtDNA, NRY, and X-linked markers. Interestingly, they found that Nf>Nm, but mf<mm, and claimed that a similar result, although left unexplored by the authors, was to be found in a recent study by Hamilton et al. [16]. This raises the interesting point that sex-specific proportions of migrants (m) are likely to be shaped by factors that may only partially overlap with those that affect the sex-specific effective numbers (N). Further studies of human populations with contrasted social organizations, as well as further theoretical developments, are needed to appreciate this point.
In order to ask to what extent our results generalize to other human populations, we investigated sex-specific patterns in the 51 worldwide populations represented in the HGDP-CEPH Human Genome Diversity Cell Line Panel dataset [43], for which the data on the differentiation of 784 autosomal microsatellites and 36 X-linked microsatellites are available (data not shown). By doing this, we found a larger differentiation for X-linked than for autosomal markers . Therefore, we confirmed Ramachandran et al.'s [20] result that no major differences in demographic parameters between males and females are required to explain the X-chromosomal and autosomal results in this worldwide sample. Ramachandran et al.'s approach [20] is based upon a pure divergence model from a single ancestral population, which is very different from the migration-drift equilibrium model considered here. In real populations, however, genetic differentiation almost certainly arises both through divergence and limited dispersal, which places these two models at two ends of a continuum. Yet, importantly, if we apply Ramachandran et al.'s [20] model to the Central Asian data, our conclusions are left unchanged. In their model, the differentiation among populations is , where t is the time since divergence from an ancestral population and Ne the effective size of the populations (see, e.g., [44]). Hence, we get for autosomal and X-linked markers, respectively. Therefore, our observation that implies that , which requires that Nf>7Nm since (see, e.g., [45]). In this case, the female fraction of effective number is larger than that of males, which is consistent with our findings in a model with migration.
The HGDP-CEPH dataset does not provide any detailed ethnic information for the sampled groups, and we can therefore not distinguish populations with different lifestyles. However, at a more local scale in Pakistan, we were able to analyze a subset of 5 populations (Brahui, Balochi, Makrani, Sindhi and Pathan), which are presumed to be patrilineal [46]. For this subset, we found a higher differentiation for autosomal than for X-linked markers , although non-significantly (p = 0.12). This result seems to suggest that other patrilineal populations may behave like the Central Asian sample presented here. Therefore, because the geographical clustering of populations with potentially different lifestyles may minimize the differences in sex-specific demography at a global scale [21],[22], and/or because the global structure may reflect ancient (pre-agricultural) marital residence patterns with less pronounced patrilocality [12], we emphasize the point that large-scale studies may not be relevant to detect sex-specific patterns, which supports a claim made by many authors.
Conclusion
In conclusion, we have shown here that the joint analysis of autosomal and X-linked polymorphic markers provides an efficient tool to infer sex-specific demography and history in human populations, as suggested recently [12],[47]. This new multilocus approach is, to our knowledge, the first attempt to combine the information contained in mtDNA, NRY, X-linked and autosomal markers (see Table 1), which allowed us to test for the robustness of a sex-specific genetic structure at a local scale. Unraveling the respective influence of migration and drift upon neutral genetic structure is a long-standing quest in population genetics [48],[49]. Here, our analysis allowed us to show that differences in sex-specific migration rates may not be the only cause of contrasted male and female differentiation in humans and that, contrary to the conclusion of a number of studies (see Table 1), differences in effective numbers may also play an important role. Indeed, we have demonstrated that sex-specific differences in population structure in patrilineal herders may be the consequence of both higher female effective numbers and female effective dispersal. Our results also illustrate the importance of analyzing human populations at a local scale, rather than global or even continental scale [2],[19],[21]. The originality of our approach lies in the comparison of identified ethnic groups that differ in well-known social structures and lifestyles. In that respect, our study is among the very few which compare patrilineal vs. bilineal or matrilineal groups (see Table 1), and we believe that it contributes to the growing body of evidence showing that social organization and lifestyle have a strong impact on the distribution of genetic variation in human populations. Moreover, our approach could also be applied on a wide range of animal species with contrasted social organizations. Therefore, we expect our results to stimulate research on the comparison of X-linked and autosomal data to disentangle sex-specific demography.
Methods
DNA Samples
We sampled 10 populations of bilineal agriculturalists and 11 populations of patrilineal herders from West Uzbekistan to East Kyrgyzstan, representing 780 healthy adult men from 5 ethnic groups (Tajiks, Kyrgyz, Karakalpaks, Kazaks, and Turkmen) (see Table 2). The geographic distribution of the samples and information about lifestyle is provided in Figure 1. Also living in Central Asia, Uzbeks are traditionally patrilineal herders too, but they have recently lost their traditional social organization [11], and we therefore chose not to include any sample from this ethnic group for the purpose of this study. We collected ethnologic data prior to sampling, including the recent genealogy of the participants. Using this information, we retained only those individuals that were unrelated for at least two generations back in time. All individuals gave their informed consent for participation in this study. Total genomic DNA was isolated from blood samples by a standard phenol-chloroform extraction [50].
Uniparentally Inherited Markers
The mtDNA first hypervariable segment of the mtDNA control region (HVS-I) was amplified using primers L15987 (5′TCAAATGGGCCTGTCCTTGTA) and H580 (5′TTGAGGAGGTAAGCTACATA) in 18 populations out of 21 (674 individuals, see Table 2). The amplification products were subsequently purified with the EXOSAP standard procedure. The sequence reaction was performed using primers L15925 (5′TAATACACCAGTCTTGTAAAC) and HH23 (5′AATAGGGTGATAGACCTGTG). Sequences from positions 16 024–16 391 were obtained. Eleven Y-linked microsatellite markers (see Table 3) were genotyped in the same individuals, following the protocol described by Parkin et al. [51].
Multi-Locus Markers
27 autosomal and 9 X-linked microsatellite markers (see Table 4) were genotyped in the same individuals. We used the informativeness for assignment index In [52] to select subsets of microsatellite markers on the X chromosome and the autosomes from the set of markers used in Rosenberg et al.'s worldwide study [43]. This statistic measures the amount of information that multiallelic markers provide about individual ancestry [52]. This index was calculated among a subset of 14 populations, chosen from the Rosenberg et al.'s dataset [43] to be genetically the closest to the Central Asian populations (Balochi, Brahui, Burusho, Hazara, Pathan, Shindi, Uygur, Han, Mongola, Yakut, Adygei, Russian, Druze and Palestinian). The rationale was to infer the information provided by individual loci about ancestry from this subset of populations, and to extrapolate the results to the populations studied here. For the X chromosome data, we pooled the ‘Screening Set10’ and ‘Screening Set52’ from the HGDP-CEPH Human Genome Diversity Cell Line Panel [53] analyzed by Rosenberg et al. [43] which represented a total of 36 microsatellites. We chose 9 markers among the 11 with the highest In. For autosomal data, we used the ‘Screening Set10’, which represented a total of 377 microsatellites, and chose 27 markers among the 30 with the highest In. All markers were chosen at a minimum of 2 cM apart from each others [54]. PCR amplifications were performed in a 20 µl final volume composed of 1× Eppendorf buffer, 125 µM each dNTP, 0.5U Eppendorf Taq polymerase, 125 nM of each primer, and 10 ng DNA. The reactions were performed in a Eppendorf Mastercycler with an initial denaturation step at 94°C for 5 min; followed by 36 cycles at 94°C for 30 s, 55°C for 30 s, 72°C for 20 s, and 72°C for 10 min as final extension. Forward primers were fluorescently labeled and reactions were further analyzed by capillary electrophoresis (ABI 310, Applied Biosystems). We used the software package Genemarker (SoftGenetics LLC) to obtain allele sizes from the analysis of PCR products (allele calling).
Statistical Analyses
We calculated the total allelic richness (AR) (over all populations), the unbiased estimate of expected heterozygosity He [55], the total number of polymorphic sites and FST for mtDNA using Arlequin version 3.1. [56]. Genetic differentiation among populations for the autosomes, the X and the Y chromosome was measured both per locus and overall loci using Weir and Cockerham's FST estimator [57], as calculated in Genepop 4.0. [58]. The 95% confidence intervals were obtained by bootstrapping over loci [58], using the approximate bootstrap confidence intervals (ABC) method described by DiCiccio and Efron [59]. Isolation by distance (i.e. the correlation between the genetic and the geographic distances) was analyzed by computing the regression of pairwise FST/(1−FST) estimates between pairs of populations to the natural logarithm of their geographical distances, and rank correlations were tested using the Mantel permutation procedure [60], as implemented in Genepop 4.0. [58]. All other statistical tests were performed using the software package R v. 2.2.1 [61].
Sex-Biased Dispersal in the Island Model
Let us consider an infinite island model of population structure [62], with two classes of individuals (males and females), which describes a infinite set of populations with constant and equal sizes that are connected by gene flow. Then the expected values of FST for uniparentally inherited markers depend on the effective number Nm (resp. Nf) of adult males (resp. females) per population and the migration rate mm (resp. mf) of males (resp. females) per generation, as: (see, e.g., [63]). We can therefore calculate the female-to-male ratio of the effective number of migrants per generation as: .
In this model, we can also compute for the autosomes and the X chromosome the reproductive values for each class (sex), which are interpreted here as the probability that an ancestral gene lineage was in a given class in a distant past [64]. From these, we can obtain the well-known expressions of effective size Ne for autosomal and X-linked genes: , respectively [45]. Note that Ne is expressed here as a number of gene copies (i.e., twice the effective number of diploid individuals for autosomes). Likewise, the effective migration rate, i.e. the average dispersal rate of an ancestral gene lineage, is given by for autosomal genes, and for X-linked genes, respectively. Substituting these expressions into the well-known equation: FST≈1/(1+2Neme) [64], we get:(5)for autosomal genes, and(6)for X-linked genes.
Evaluation of the Approach through Stochastic Simulations
We performed coalescent simulations, using an algorithm in which coalescence and migration events are considered generation-by-generation until the common ancestor of the whole sample has been reached (see [65]). We simulated a finite island model with 50 demes, each made of N = Nf+Nm = 500 diploid individuals, with a migration parameter m = mf+mm = 0.2. Using these total values for N and m, we then varied the sex-specific parameters to cover the (Nf/N, mf/m) parameter space evenly. Note that the parameter m is the total migration rate, which corresponds to twice the effective migration rate for autosomal markers. Hence, for each set of (Nf/N, mf/m) values, the total number of individuals is 500 (although the number of females may vary from 1 to 499) and the effective migration rate for autosomal markers is . We chose these total values for N and m such that, for a ratio Nfmf/Nmmm = 21.6 (as observed for the herder populations), the distribution of FST estimates on uniparentally-inherited markers in the simulations were close to the observations: for mtDNA, the 95% highest posterior density interval (see [66], pp. 38–39) for the distribution of FST estimates in the simulations was [0.007; 0.033] with a mode at 0.014 (estimated value from the real dataset: among the herders) while for the NRY, the 95% highest posterior density interval was [0.088; 0.374] with a mode at 0.187 (estimated value from the real dataset: ).
Each simulated sample consisted in 330 sampled males from 11 populations (30 males per population), genotyped at 27 autosomal, 9 X-linked markers as well as 10 Y-linked markers and a single mtDNA locus. Each locus was assumed to follow a Generalized Stepwise Model (GSM) [67] with a possible range of 40 contiguous allelic states, except the mtDNA, which was assumed to follow an infinite allele model of mutation. The average mutation rate was 5.10−3, and the mean parameter of the geometric distribution of the mutation step lengths for microsatellites was set to 0.2 [67],[68].
Zdroje
1. DisotellTR
1999 Human evolution: sex-specific contributions to genome variation. Curr Biol 9 R29 31
2. WilkinsJF
2006 Unraveling male and female histories from human genetic data. Curr Opin Genet Dev 16 611 617
3. SeielstadMT
MinchE
Cavalli-SforzaLL
1998 Genetic evidence for a higher female migration rate in humans. Nat Genet 20 278 280
4. SalemAH
BadrFM
GaballahMF
PääboS
1996 The genetics of traditional living: Y-chromosomal and mitochondrial lineages in the Sinai Peninsula. Am J Hum Genet 59 741 743
5. Perez-LezaunA
CalafellF
ComasD
MateuE
BoschE
1999 Sex-specific migration patterns in Central Asian populations, revealed by analysis of Y-chromosome short tandem repeats and mtDNA. Am J Hum Genet 65 208 219
6. OotaH
KitanoT
JinF
YuasaI
WangL
2002 Extreme mtDNA homogeneity in continental Asian populations. Am J Phys Anthropol 118 146 153
7. KayserM
BrauerS
WeissG
SchiefenhovelW
UnderhillP
2003 Reduced Y-chromosome, but not mitochondrial DNA, diversity in human populations from West New Guinea. Am J Hum Genet 72 281 302
8. MalyarchukB
DerenkoM
GrzybowskiT
LunkinaA
CzarnyJ
2004 Differentiation of mitochondrial DNA and Y chromosomes in Russian populations. Hum Biol 76 877 900
9. NasidzeI
LingEY
QuinqueD
DupanloupI
CordauxR
2004 Mitochondrial DNA and Y-chromosome variation in the Caucasus. Ann Hum Genet 68 205 221
10. NasidzeI
QuinqueD
OzturkM
BendukidzeN
StonekingM
2005 MtDNA and Y-chromosome variation in Kurdish groups. Ann Hum Genet 69 401 412
11. ChaixR
Quintana-MurciL
HegayT
HammerMF
MobasherZ
2007 From social to genetic structures in central Asia. Curr Biol 17 43 48
12. WilkinsJF
MarloweFW
2006 Sex-biased migration in humans: what should we expect from genetic data? Bioessays 28 290 300
13. BurtonML
MooreCC
WhitingJWM
RomneyAK
1996 Regions based on social structure. Curr Anthro 37 87 123
14. OotaH
Settheetham-IshidaW
TiwawechD
IshidaT
StonekingM
2001 Human mtDNA and Y-chromosome variation is correlated with matrilocal versus patrilocal residence. Nat Genet 29 20 21
15. Destro-BisolG
DonatiF
CoiaV
BoschiI
VerginelliF
2004 Variation of female and male lineages in sub-Saharan populations: the importance of sociocultural factors. Mol Biol Evol 21 1673 1682
16. HamiltonG
StonekingM
ExcoffierL
2005 Molecular analysis reveals tighter social regulation of immigration in patrilocal populations than in matrilocal populations. Proc Natl Acad Sci U S A 102 7476 7480
17. BolnickDA
BolnickDI
SmithDG
2006 Asymmetric male and female genetic histories among Native Americans from Eastern North America. Mol Biol Evol 23 2161 2174
18. StonekingM
1998 Women on the move. Nat Genet 20 219 220
19. WilderJA
KinganSB
MobasherZ
PilkingtonMM
HammerMF
2004 Global patterns of human mitochondrial DNA and Y-chromosome structure are not influenced by higher migration rates of females versus males. Nat Genet 36 1122 1125
20. RamachandranS
RosenbergNA
ZhivotovskyLA
FeldmanMW
2004 Robustness of the inference of human population structure: a comparison of X-chromosomal and autosomal microsatellites. Hum Genomics 1 87 97
21. KumarV
LangstiehBT
MadhaviKV
NaiduVM
SinghHP
2006 Global patterns in human mitochondrial DNA and Y-chromosome variation caused by spatial instability of the local cultural processes. PLoS Genet 2 e53
22. HammerMF
KarafetTM
ReddAJ
JarjanaziH
Santachiara-BenerecettiS
2001 Hierarchical patterns of global human Y-chromosome diversity. Mol Biol Evol 18 1189 1203
23. DupanloupI
PereiraL
BertorelleG
CalafellF
PrataMJ
2003 A recent shift from polygyny to monogamy in humans is suggested by the analysis of worldwide Y-chromosome diversity. J Mol Evol 57 85 97
24. WilderJA
MobasherZ
HammerMF
2004 Genetic evidence for unequal effective population sizes of human females and males. Mol Biol Evol 21 2047 2057
25. WilderJA
HammerMF
2007 Extraordinary population structure among the Baining of New Britain.
FriedlaenderJS
Genes, Language, and Culture History in the Southwest Pacific Oxford, UK Oxford University Press 199 207
26. SeielstadM
2000 Asymmetries in the maternal and paternal genetic histories of Colombian populations. Am J Hum Genet 67 1062 1066
27. LangergraberKE
SiedelH
MitaniJC
WranghamRW
ReynoldsV
2007 The genetic signature of sex-biased migration in patrilocal chimpanzees and humans. PLoS ONE 2 e973
28. BazinE
GleminS
GaltierN
2006 Population size does not influence mitochondrial genetic diversity in animals. Science 312 570 572
29. HeyerE
SibertA
AusterlitzF
2005 Cultural transmission of fitness: genes take the fast lane. Trends Genet 21 234 239
30. ZerjalT
XueY
BertorelleG
WellsRS
BaoW
2003 The genetic legacy of the Mongols. Am J Hum Genet 72 717 721
31. NeelJV
1970 Lessons from a “primitive” people. Science 170 815 822
32. BlumMG
HeyerE
FrancoisO
AusterlitzF
2006 Matrilineal fertility inheritance detected in hunter-gatherer populations using the imbalance of gene genealogies. PLoS Genet 2 e122
33. HelgasonA
HrafnkelssonB
GulcherJR
WardR
StefanssonK
2003 A populationwide coalescent analysis of Icelandic matrilineal and patrilineal genealogies: evidence for a faster evolutionary rate of mtDNA lineages than Y chromosomes. Am J Hum Genet 72 1370 1388
34. WhiteDR
1988 Rethinking polygyny: co-wives, codes, and cultural systems. Curr Anthro 29 529 558
35. HeiderKG
1997 Grand valley Dani: peaceful warriors.
GS
LS
Case studies in cultural anthropology Forth Worth, Texas Harcourt Brace College Publishers
36. TremblayM
VezinaH
2000 New estimates of intergenerational time intervals for the calculation of age and origins of mutations. Am J Hum Genet 66 651 658
37. FennerJN
2005 Cross-cultural estimation of the human generation interval for use in genetics-based population divergence studies. Am J Phys Anthropol 128 415 423
38. TangH
SiegmundDO
ShenP
OefnerPJ
FeldmanMW
2002 Frequentist estimation of coalescence times from nucleotide sequence data using a tree-based partition. Genetics 161 447 459
39. WhitlockMC
McCauleyDE
1999 Indirect measures of gene flow and migration: FST≠1/(4Nm+1). Heredity 82 117 125
40. BeaumontM
NicholsRA
1996 Evaluating loci for use in the genetic analysis of population structure. Proc R Soc Lond 263 1619 1626
41. RoussetF
1997 Genetic differentiation and estimation of gene flow from F-statistics under isolation by distance. Genetics 145 1219 1228
42. PoolJE
NielsenR
2007 Population size changes reshape genomic patterns of diversity. Evolution 61 3001 3006
43. RosenbergNA
PritchardJK
WeberJL
CannHM
KiddKK
2002 Genetic structure of human populations. Science 298 2381 2385
44. ReynoldsJ
WeirBS
CockerhamCC
1983 Estimation of the Coancestry Coefficient: Basis for a Short-Term Genetic Distance. Genetics 105 767 779
45. WrightS
1939 Statistical genetics in relation to evolution. Actualités scientifiques et industrielles 802 Exposés de Biométrie et de Statistique Biologique XIII Paris Hermann et Cie
46. TamisierJC
1998 Dictionnaire des peuples. Sociétés d'Afrique, d'Amérique, d'Asie et d'Océanie Paris Larousse-Bordas
47. BalaresqueP
JoblingMA
2007 Human populations: houses for spouses. Curr Biol 17 R14 16
48. Lawson-HandleyLJ
PerrinN
2007 Advance in our understanding of mammalian sex-biased dispersal. Molecular Ecology 16 1559 1578
49. HurlesME
JoblingMA
2001 Haploid chromosomes in molecular ecology: lessons from the human Y. Mol Ecol 10 1599 1613
50. ManiatisT
FritshEF
SJ
1982 Molecular cloning. A laboratory manual New York Cold Spring Laboratory
51. ParkinEJ
KraayenbrinkT
vDGL
TsheringK
de KnijffP
2006 26-Locus Y-STR typing in a Bhutanese population sample. Forensic Science International 161 1 7
52. RosenbergNA
LiLM
WardR
PritchardJK
2003 Informativeness of genetic markers for inference of ancestry. Am J Hum Genet 73 1402 1422
53. CannHM
de TomaC
CazesL
LegrandMF
MorelV
2002 A human genome diversity cell line panel. Science 296 261 262
54. WilsonJF
GoldsteinDB
2000 Consistent long-range linkage disequilibrium generated by admixture in a Bantu-Semitic hybrid population. Am J Hum Genet 67 926 935
55. NeiM
1978 Estimation of average heterozygosity and genetic distance from a small number of individuals. Genetics 89 583 590
56. ExcoffierL
LavalLG
SchneiderS
2005 Arlequin ver. 3.0: An integrated software package for population genetics data analysis. Evol Bioinfo Online 1 47 50
57. WeirBS
CockerhamCC
1984 Estimating F-statistics for the analysis of population structure. Evolution 38 1358 1370
58. RoussetF
2008 Genepop'007: a complete re-implementation of the genepop software for Windows and Linux. Mol Ecol Res 8 103 106
59. DiCiccioTJ
EfronB
1996 Bootstrap confidence intervals. Statistical Science 11 189 228
60. MantelN
1967 The detection of disease clustering and a generalized regression approach. Cancer Res 27 209 220
61. R Development Core Team 2007 R: A Language and Environment for Statistical Computing Vienna R Foundation for Statistical Computing
62. WrightS
1931 Evolution in mendelian populations. Genetics 16 97 159
63. HedrickPW
2007 Sex: differences in mutation, recombination, selection, gene flow, and genetic drift. Evolution 61 2750 2771
64. RoussetF
2004 Genetic Structure and Selection in Subdivided Populations Princeton, New Jersey Princeton University Press
65. LebloisR
EstoupA
RoussetF
2003 Influence of mutational and sampling factors on the estimation of demographic parameters in a “continuous” population under isolation by distance. Mol Biol Evol 20 491 502
66. GelmanA
CarlinJB
SternHS
RubinDB
2004 Bayesian Data Analysis. Second Edition New York Chapman & Hall/CRC
67. EstoupA
JarneP
CornuetJM
2002 Homoplasy and mutation model at microsatellite loci and their consequences for population genetics analysis. Mol Ecol 11 1591 1604
68. DibC
FaureS
FizamesC
SamsonD
DrouotN
1996 A comprehensive genetic map of the human genome based on 5,264 microsatellites. Nature 380 152 154
69. ExcoffierL
SmousePE
QuattroJM
1992 Analysis of molecular variance inferred from metric distances among DNA haplotypes: application to human mitochondrial DNA restriction data. Genetics 131 479 491
70. BeerliP
FelsensteinJ
2001 Maximum likelihood estimation of a migration matrix and effective population sizes in n subpopulations by using a coalescent approach. Proc Natl Acad Sci U S A 98 4563 4568
Štítky
Genetika Reprodukční medicínaČlánek vyšel v časopise
PLOS Genetics
2008 Číslo 9
Nejčtenější v tomto čísle
- Missense Mutation in Exon 2 of SLC36A1 Responsible for Champagne Dilution in Horses
- Novel Mutations in (TDP-43) in Patients with Familial Amyotrophic Lateral Sclerosis
- Sex-Specific Genetic Structure and Social Organization in Central Asia: Insights from a Multi-Locus Study
- Chromosome Mechanics and Meiotic Engine Maintenance