
Genotype and Gene Expression Associations with Immune Function in
It is now well established that natural populations of Drosophila melanogaster harbor substantial genetic variation associated with physiological measures of immune function. In no case, however, have intermediate measures of immune function, such as transcriptional activity of immune-related genes, been tested as mediators of phenotypic variation in immunity. In this study, we measured bacterial load sustained after infection of D. melanogaster with Serratia marcescens, Providencia rettgeri, Enterococcus faecalis, and Lactococcus lactis in a panel of 94 third-chromosome substitution lines. We also measured transcriptional levels of 329 immune-related genes eight hours after infection with E. faecalis and S. marcescens in lines from the phenotypic tails of the test panel. We genotyped the substitution lines at 137 polymorphic markers distributed across 25 genes in order to test for statistical associations among genotype, bacterial load, and transcriptional dynamics. We find that genetic polymorphisms in the pathogen recognition genes (and particularly in PGRP-LC, GNBP1, and GNBP2) are most significantly associated with variation in bacterial load. We also find that overall transcriptional induction of effector proteins is a significant predictor of bacterial load after infection with E. faecalis, and that a marker upstream of the recognition gene PGRP-SD is statistically associated with variation in both bacterial load and transcriptional induction of effector proteins. These results show that polymorphism in genes near the top of the immune system signaling cascade can have a disproportionate effect on organismal phenotype due to the amplification of minor effects through the cascade.
Published in the journal:
. PLoS Genet 6(1): e32767. doi:10.1371/journal.pgen.1000797
Category:
Research Article
doi:
https://doi.org/10.1371/journal.pgen.1000797
Summary
It is now well established that natural populations of Drosophila melanogaster harbor substantial genetic variation associated with physiological measures of immune function. In no case, however, have intermediate measures of immune function, such as transcriptional activity of immune-related genes, been tested as mediators of phenotypic variation in immunity. In this study, we measured bacterial load sustained after infection of D. melanogaster with Serratia marcescens, Providencia rettgeri, Enterococcus faecalis, and Lactococcus lactis in a panel of 94 third-chromosome substitution lines. We also measured transcriptional levels of 329 immune-related genes eight hours after infection with E. faecalis and S. marcescens in lines from the phenotypic tails of the test panel. We genotyped the substitution lines at 137 polymorphic markers distributed across 25 genes in order to test for statistical associations among genotype, bacterial load, and transcriptional dynamics. We find that genetic polymorphisms in the pathogen recognition genes (and particularly in PGRP-LC, GNBP1, and GNBP2) are most significantly associated with variation in bacterial load. We also find that overall transcriptional induction of effector proteins is a significant predictor of bacterial load after infection with E. faecalis, and that a marker upstream of the recognition gene PGRP-SD is statistically associated with variation in both bacterial load and transcriptional induction of effector proteins. These results show that polymorphism in genes near the top of the immune system signaling cascade can have a disproportionate effect on organismal phenotype due to the amplification of minor effects through the cascade.
Introduction
Drosophila, like other insects, use a generalized immune response to combat pathogens. Unlike vertebrates, the insect immune response consists solely of an innate response, with cellular and humoral (cell-free) arms [reviewed in 1]. Despite considerable knowledge of the molecular basis of the Drosophila immune response, and increasing understanding of the extent of natural genetic variation for immunocompetence in this system [2]–[4], relatively little is known about the role of network structure in shaping the phenotypic consequences of genetic variation.
Linking genetic variation in transcriptional regulation to differences in complex phenotypes has the potential to illuminate mechanistic aspects of genotype-phenotype associations. Passador-Gurgel and coworkers [5] identified several genes in which transcript levels significantly associate with survival times after exposure of D. melanogaster to nicotine. Other studies in Drosophila have identified transcriptional variation associated with male reproductive success [6], male body size [7], aggressive behavior [8] and locomotive behavior [9]. While in some cases it has been possible to show that genetically determined transcriptional differences are statistically correlated with phenotypic differences, these studies have generally not identified causal genetic variants. In Drosophila, linking genetic variation to phenotypic variation via transcriptional changes has proven difficult [10],[11]. The Drosophila immune system provides an ideal opportunity to examine the consequences of genetic variation and differences among lines in patterns of gene expression in the context of a well-defined network.
In Drosophila, the humoral response is initiated by the recognition of microbial cell wall component by proteins such as PGRPs and GNBPs [12]–[14]. These proteins activate two primary signaling pathways, the Toll and Imd pathways. The Toll pathway is primarily activated after infection by fungi and Gram-positive bacteria, whereas the Imd pathway is primarily activated after infection by Gram-negative bacteria [15],[16], although this specificity is not absolute [17],[18]. In addition to these primary signaling pathways, the JAK/STAT and JNK pathways are thought to play a role in immune response, largely as part of the general stress response and wound healing [19],[20]. Activation of the Toll and Imd signaling pathways leads to the translocation of NF-κB transcription factors (Relish, DIF, Dorsal) to the nucleus where they drive transcription of effector genes, which encode proteins that are directly involved in bacterial clearance, such as antimicrobial peptides. These effectors are then released into the hemolymph, where they act to directly kill invading microorganisms [21].
Previously, we have examined associations between bacterial load after infection with each of four different bacteria and genetic markers (SNPs and indels) in candidate genes on the Drosophila melanogaster second chromosome [2],[3]. Here, using markers in candidate genes on the third chromosome, we examine both bacterial load and gene expression phenotypes, testing associations between genotype, sustained bacterial load, and transcription level of approximately 400 known and putative immune system genes.
Results
Genetic variation for immune function on the third chromosome in Drosophila
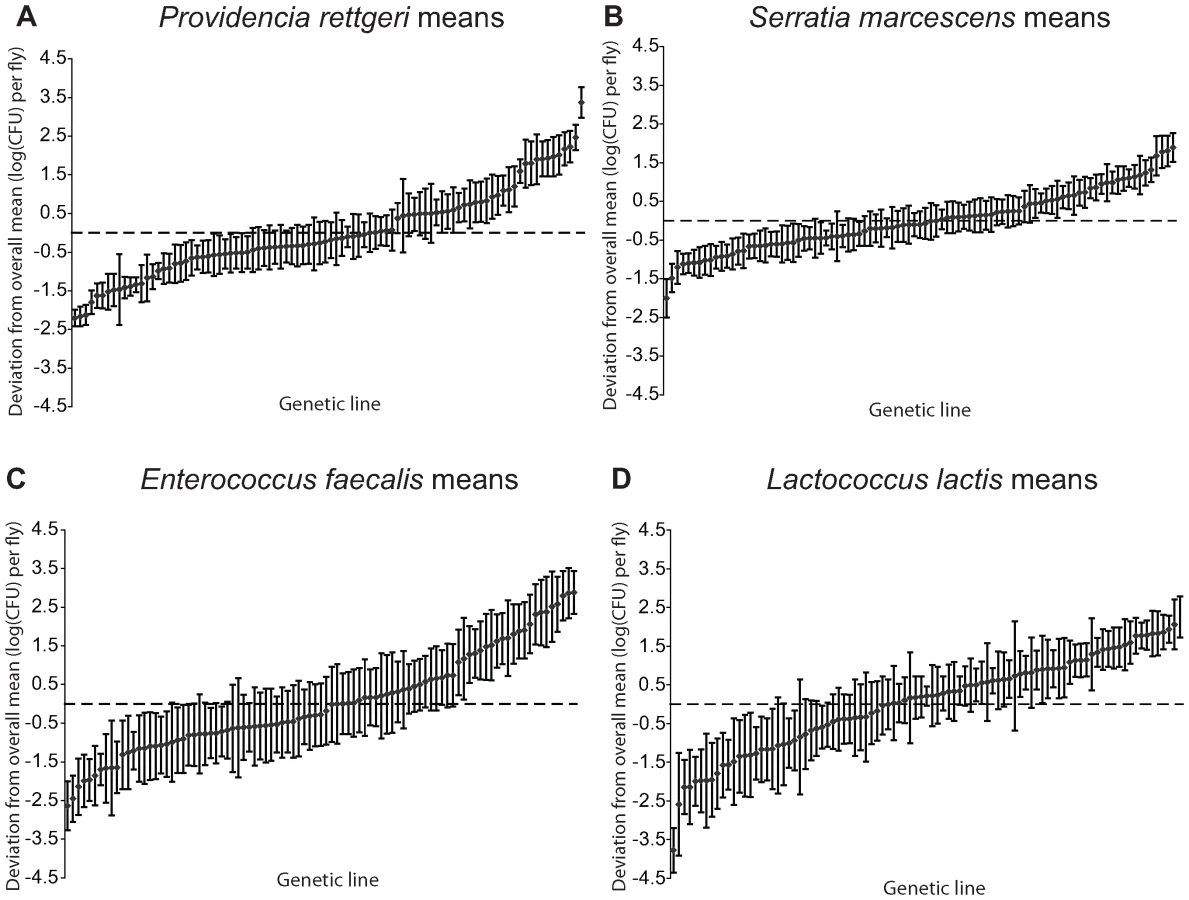
We examined a sample of 94 third-chromosome substitution lines for variation in bacterial load sustained 28 hours after infection with each of four different bacteria: Serratia marcescens, Providencia rettgeri, Enterococcus faecalis, and Lactococcus lactis (Figure 1). In order to assess the effect of different third chromosomes on bacterial load phenotypes, we compared the likelihood of the data under a statistical model that includes variation among genetic (third-chromosome) lines as a main effect to the likelihood of the data under a model that does not. Likelihood ratio tests reveal a large, highly significant effect of third chromosome line on phenotypic variation in bacterial load against all four bacteria (S. marcescens: χ2 = 128.42, d.f. = 1, P<2.2×10⁻¹⁶; P. rettgeri: χ2 = 263.88, d.f. = 1, P<2.2×10⁻¹⁶; E. faecalis: χ2 = 51.533, d.f. = 1, P = 7.04×10⁻¹³; L. lactis: χ2 = 35.391, d.f. = 1, P = 2.70×10⁻⁹). Genetic line explains 66.9% of the non-error variance (14.5% of the overall variance) for load sustained after S. marcescens infection and 58.3% (22.1%) for load sustained after P. rettgeri infection, but only 27.4% (7.2%) for E. faecalis and 19.5% (6.2%) for L. lactis (Table 1). Total variance in bacterial load is much higher for the two Gram-positive bacteria (E. faecalis and L. lactis), as is residual variance and the fraction of total variance explained by experimental factors, suggesting that these infections produce noisier data (Table 1). The smaller fraction of variance attributable to line after infection with these two bacteria presumably stems from stochastic events during initiation and establishment of infection. The overall mean load sustained after infection also varies among bacteria, ranging from a low of 2,186 colony forming units (CFU) per fly 28 hours after infection with S. marcescens to a high of 653,436 CFU per fly after infection with L. lactis. Correlations of line means between bacteria (measured as Spearman's ρ) are generally moderate and positive (Table 2). While the positive sign of correlations between bacteria suggests that some genetic lines may have generally better immune responses, the relatively small magnitude suggests substantial bacteria-specific effects.


Genotype-phenotype associations
We tested for statistical associations between bacterial load and genotypes at 137 polymorphisms in 26 genes and gene families on the third chromosome with known or suspected immune function. These included 6 antimicrobial peptide loci, 10 putative recognition loci (GNBPs and PGRPs), 8 known signaling loci, the Toll-like receptor Toll-9, and the iron-binding protein Transferrin 2 (Table 3). Our association test is based on mixed linear models: we assessed significance by comparing the observed model coefficient (effect size) for the marker in question to a null distribution generated from 5070 permuted data sets where phenotypes are randomly shuffled across lines while preserving linkage disequilibrium among genetic markers and correlations among bacterial loads after infection with different bacteria (see Methods for details of the permutation protocol).

We also tested for associations between SNP markers and the first principal component estimated from line means of bacteria after infection with each of the four different bacteria. This principal component is significantly positively correlated with load after infection with all four bacteria, suggesting that it represents a measure of general immune competence and/or general vigor. Results from this analysis recover statistical associations with markers that show significant associations with bacterial load measured after infection with multiple different bacteria, but do not uncover any additional general immune factors, and are not discussed further (Table S1). All statistical tests were implemented in R, as described in the Methods, and presented in Table S1.
Across all bacteria, 43 tests (7.85%) are significant at a nominal αof 0.05, and 12 tests (2.19%) are significant at a nominal α of 0.01; in both cases, we observe a significant excess of significant tests (α = 0.05: χ2 = 9.35, d. f. = 1, P-value = 0.0022; α = 0.01: χ2 = 7.84, d. f. = 1, P-value = 0.0051). Because some SNPs are in linkage disequilibrium and because bacterial loads across different pathogen challenges are weakly positively correlated, the 548 tests we conducted (137 markers by 4 phenotypes) are not likely to be independent. Thus, we also calculated the null distribution of significant SNPs based on permutations that preserve the correlation structure in the data (see Methods for additional details). We observe a mean of 28.6 significant tests under the null hypothesis at an α of 0.05, and a mean of 5.9 significant tests under the null hypothesis at an α of 0.01. In both cases, the number of significant tests we observe in the permuted data are significantly fewer than the values we observe in the real data (α = 0.05 : 43 observed significant tests, P-value = 0.0323; α = 0.01 : 12 observed significant tests, P-value = 0.0296).
Several markers in our dataset (8 and 2 at a nominal α of 0.05 and 0.01, respectively) are nominally associated with variation in multiple independent bacterial load phenotypes. Assuming all tests are independent, it is extremely unlikely that we would observe this number of SNPs associated with more than one bacterial load phenotype (α = 0.05: χ2 = 19.52, P-value (by simulation) = 0.00087; α = 0.01: χ2 = 45.42, P-value (by simulation) = 0.00299). To verify this conclusion in the face of non-independence among tests, we used a permutation approach to estimate the null distribution of the number of SNPs with two or more significant tests under the assumption of no genotype-phenotype associations (α = 0.05: P-value = 0.0118; α = 0.01: P-value = 0.0053; see Methods for details).
Significant tests at a nominal α of 0.01 (0.05) are not randomly distributed among bacteria: 83.3% (67.4%) of the significant cases represent associations between genotype and bacterial load after infection with Gram-negative bacteria (S. marcescens and P. rettgeri). Gram-positive bacterial load has higher residual error variance and higher experimental variance in our experiments (Table 1), which could lead to reduced power to detect associations with this phenotype. In order to test this hypothesis, we calculated power by simulation, assuming variances estimated from either the Gram-negative or Gram-positive bacteria in our study (see Methods for details). Although power is lower for our simulated Gram-positive data across a range of effect sizes and two assumptions about minor allele frequencies (Figure S1), if average effect size of associations is equal between the two bacterial types we would not expect to see such a substantial excess of Gram-negative associations. It is possible that the observed excess of associations with resistance to Gram-negative infection could be driven by a biological difference in the response of D. melanogaster to the specific Gram-negative and Gram-positive bacteria we employed in this study that results in less among-line variation in load after infection with these particular Gram-positive bacteria.
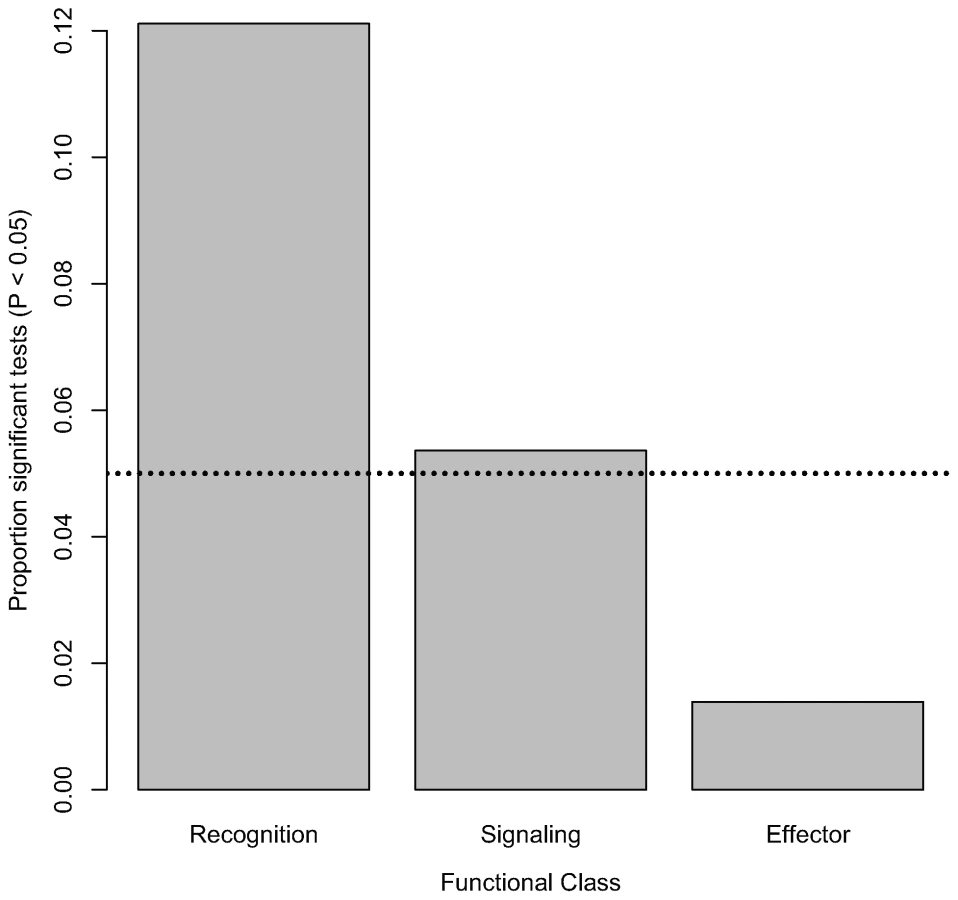
Nominally significant associations are also not evenly distributed within functional classes of the immune system. The proportion of tested markers that are associated with bacterial load phenotypes (at a nominal α of 0.05) significantly varies among functional classes (Figure 2; χ2 = 11.35, d. f. = 2, P = 0.0034). Markers in genes encoding recognition proteins have the highest proportion of significant associations with bacterial load (12.11% of tested markers in these genes are significantly associated with phenotype), followed by markers in genes encoding signaling proteins (5.36% of tested markers in these genes are significantly associated with phenotype). Markers in genes encoding effector proteins are rarely associated with differences in bacterial load (only 1.39% of tested markers in genes encoding effectors are significantly associated with phenotype). Average intralocus linkage disequilibrium is not significantly different among functional classes (data not shown), suggesting that this pattern is not driven by biases introduced by LD among SNPs. However, in order to rule out this possibility we generated a distribution for the fraction of significant associations in each of the three functional categories under the null hypothesis that there is no association between genotype and phenotype. Markers in genes encoding recognition proteins are significantly more likely to have significant associations (α = 0.05 : 31 observed significant tests compared to a mean of 13.3 in the permutated data, P = 0.0016; α = 0.01 : 10 observed vs. mean of 2.73 in permuted data, P = 0.0059). The same pattern does not hold, however, for markers in genes encoding signaling or effector proteins (α = 0.05: Psignaling = 0.492, Peffector = 0.965; α = 0.01: Psignaling = 0.500, Peffector = 1). Furthermore, while the average fraction of markers with significant associations at α = 0.05 (0.01) that are in recognition genes in the permuted dataset is 51.21% (50.96%), in the observed data it is 75.6% (83.3%).
Polymorphism at the GNBP75D locus, consisting of the genes GNBP1 and GNBP2, is particularly striking in the extent and significance of associations with resistance to Gram-negative bacteria (Figure 3). Seven of the 10 SNPs at this locus are nominally significantly associated with variation in bacterial load after infection with P. rettgeri, although average linkage disequilibrium is high at this locus (average pairwise r2 = 0.303; average pairwise D′ = 0.636). Four of those seven SNPs are also significantly associated with differences in bacterial load after infection with S. marcescens. These include one SNP in the 3′ UTR of GNBP2 (GNBP75D_1041), one SNP in the 5′ UTR of GNBP1 (GNBP75D_3350), and a pair of SNPs in the first intron of GNBP1 (GNBP75D_3696 and GNBP75D_3768). Notably, GNBP75D_3696 is one of two SNPs that is significantly associated with differences in bacterial load after infection with two different bacteria at a nominal α of 0.01.

The haplotype structure at the GNBP75D locus is unusual for D. melanogaster. Despite spanning more than 2 kb, the four SNPs mentioned previously are found in only 6 of the 16 possible haplotypes in 91 of the 94 genetic lines (the remaining three lines have unique haplotypes). There are two major haplotypes (A-A-A-T and C-G-G-A) at frequencies of 0.244 and 0.449 respectively. When the phenotypes of the lines that carry these two haplotypes are compared directly using nonparametric tests, the A-A-A-T haplotype has a significantly higher median bacterial load after infection with both S. marcescens (medianAAAT = 8.12, medianCGGA = 7.48, Mann-Whitney U P = 0.036) and P. rettgeri (medianAAAT = 13.16, medianCGGA = 12.26, Mann-Whitney U P = 0.000299).
Further support for a biologically meaningful association of genetic differences at the GNBP75D locus with phenotypic variation comes from an analysis of per-gene significance. Because of the high intra-locus LD, we applied permutation tests to assess significance of effects attributable to genetic variation at each gene. We generated a null distribution of the sum of the χ2 test statistics for each marker within a locus under the assumption of no association between genotype and phenotype, while controlling for confounding effects of correlation among markers within a locus, and compared the observed sum of the χ2 test statistics to this permuted distribution (see Methods for details; full results in Table S2). We find significant evidence for an association between markers in GNBP75D and bacterial load after infection with P. rettgeri (P = 0.00059; P = 0.015 after multiple test correction using the Holm method implemented in the R function p.adjust) and, more weakly, S. marcescens (P = 0.023; P = 0.577 after multiple test correction as above).
PGRP-LC is another recognition gene with repeatable evidence for a significant association between SNPs and bacterial load, albeit somewhat weaker than the evidence for the GNBP75D association. In this case, genotypes at two out of 10 SNPs are associated with variation in bacterial load against at least two different bacteria at a nominal α of 0.05, and a third marker has marginal significance. A SNP marker approximately 125 bp upstream of the transcriptional start site of PGRP-LC (PGRPLC_884) is associated with resistance against both E. faecalis (P = 0.0556) and S. marcescens (P = 0.038). A SNP marker in the third exon of splice variant PGRP-LC-RB (PGRPLC_5624; intronic in splice variants PGRP-LC-RA and PGRP-LC-RC) is associated with variation in bacterial load against L. lactis (P = 0.0481) and S. marcescens (P = 0.006), with the same allele associated with lower bacterial load against both bacteria. Another SNP marker in the fourth exon (in the PGRP domain) of PGRP-LC-RA (PGRPLC_6635; in the intron of PGRP-LC-RA and PGRP-LC-RC) is also associated with variation in bacterial load against L. lactis (P = 0.0075) and S. marcescens (P = 0.0095). These two SNP markers are in linkage disequilibrium (r2 = 0.193, P = 7.92×10⁻⁴), but neither is in significant linkage disequilibrium with the upstream marker.
Marker by sex interactions
Empirical and theoretical work [22]–[24] suggests that immune function may differ between the sexes, as males and females make different resource allocation decisions between immune defense and reproductive output. These observations lead to the hypothesis that the genetic basis of the immune response may depend on sex: indeed, these kinds of genotype by sex interactions have been observed for other quantitative traits in D. melanogaster [e.g., 25]. To test this hypothesis, we compared the likelihood of our observed bacterial load data under a model with a Sex by Marker interaction to the likelihood of the data under a model without such an effect (but retaining the main effects of Sex and Marker). To assess the significance of the resulting likelihood ratio test statistics, we used a null distribution of likelihood ratio test statistics calculated by permuting the data 1000 times.
We find little evidence for significant effects of marker by sex interactions on bacterial load. While 6.93% of tests are significant at a nominal α of 0.05, a weakly significant excess over the null expectation (χ2 = 4.32, d. f. = 1, P = 0.0377), only 0.91% of tests are significant at a nominal α of 0.01, which is not different from the null expectation (χ2 = 0.042, d. f. = 1, P = 0.8367). While it is possible that there are weak marker by sex interactions that we do not have the power to detect in this experiment, we believe that such effects are likely to be small compared to main effects of SNP across sexes. There is a clear main effect of sex: males have consistently lower bacterial loads irrespective of genotype, consistent with the hypothesis that the sex bias in immune function is phenotypically plastic in Drosophila, and depends on food and mate availability [22]. We have only examined variation on the third chromosome in this study; a similar studies of genes on the second chromosome also find little evidence for substantial sex by SNP interactions [2],[3]. However, a recent study of variation in X-linked immune genes suggests substantial sex by SNP interactions [26].
Measuring gene expression using BeadChips
In order to understand the mechanistic basis of differences in immune phenotypes linked to genetic variation on the third chromosome, we measured gene expression of approximately 700 transcripts in males from a subset of 30 of the 94 phenotyped chromosome 3 substitution lines. Using custom-designed Illumina BeadChip microarrays, we measured transcript abundance under three different conditions (uninfected, 8 hours post S. marcescens infection [Sm-infected], and 8 hours post E. faecalis infection [Ef-infected], where S. marcescens and E. faecalis were chosen arbitrarily to represent Gram-negative and Gram-positive bacteria respectively). We selected the subset of assayed lines to be biased toward the tails of the phenotypic distribution in order to enhance our power to detect correlations between transcript abundance and phenotype. We normalized and log-transformed expression values as described in the Methods. For most analyses, we focused on the Ef-induced (Ef-infected minus uninfected) and Sm-induced (Sm-infected minus uninfected) samples.
In addition to quantifying the 329 genes with a known or putative immune function (including 172 genes with some characterized function and 157 genes predicted to have a role in immunity based on transcriptional induction after infection), our BeadChip microarrays include genes involved in metabolism (139) and sex/reproduction (164), as well as 69 probesets consisting of housekeeping gene controls, and genes involved in insecticide resistance. Full details of the BeadChip design are described in the Methods; the full list of genes are presented as Table S3 (probe sequences are available upon request from T. B. S.). For most analyses, we focus on the 329 immune genes on the BeadChips, although in some cases we use the other genes as controls.
Genotype-expression associations
Although with only 30 lines applied to the BeadChip arrays we have limited power to detect associations between SNPs and gene expression variation, we tested for significant associations by comparing a mixed model with a fixed effect of SNP to one with just a fixed intercept. Because permutations are not computationally feasible for the large number of tests required for this analysis, we assessed significance by comparing the likelihood ratio test statistic to a standard χ2 distribution. Overall, 3.55% (9.09%) and 2.98% (10.33%) of genotype-expression association tests are significant at a nominal α of 0.01 (0.05) in the Sm-induced and Ef-induced samples, respectively. In all cases it is highly improbable to obtain this many significant tests purely by chance under the assumption that regulation of expression of all genes is independent (Sm-induced, α = 0.01: χ2 = 6351, P<2.2×10⁻¹⁶; Ef-induced, α = 0.01: χ2 = 3833, P<2.2×10⁻¹⁶; Sm-induced, α = 0.05: χ2 = 5791, P<2.2×10⁻¹⁶; Ef-induced, α = 0.05: χ2 = 3416, P<2.2×10⁻¹⁶). The same pattern holds if we consider the absolute expression level in the Ef-infected, Sm-infected, and uninfected samples individually (data not shown).
Because we assumed the null distribution of the test statistic follows an asymptotic chi-square distribution, it is possible that the excess of significant P-values we observe is primarily due to mis-specification of the null distribution. We expect that polymorphisms in genes known to have a role in the immune system will be more likely to affect expression of immune-related genes than expression of other genes on the BeadChip. Indeed, for the Ef-induced sample, we see significantly more tests with both P<0.01 and P<0.05 among immune-related genes than other genes (P<0.01 : 0.0325 vs. 0.0274; χ2 = 21.6874, d.f. = 1, P = 3.206×10⁻⁶; P<0.05 : 0.0933 vs. 0.0889; χ2 = 5.6409, d.f. = 1, P = 0.01755), although this is not the case for the Sm-induced sample (but note that “non-immune” genes may still be responding transcriptionally to infection). Thus, while it appears that some of the genotyped SNPs in this study have significant effects on gene expression, particularly for the Ef-induced sample, limiting our experiment to 30 lines reduces our power to detect significant associations. Nonetheless, there are 304 and 350 associations between genotypes and induction of immune genes after E. faecalis and S. marcescens infection respectively significant at a 10% false-discovery-rate, which are presented in Table S4. Of particular note is the marker PGRPSD_494, which is associated with expression of 73 of the 329 immune genes we assayed. However, given the uncertainty in the true estimates of significance, we focus on overall qualitative patterns of genotype-expression associations.
Significant associations tend to follow the predicted network structure
Because a considerable amount is known about the transcriptional feedback relationships in innate immune networks, we can make some predictions about the expected direction of associations between genotypes and variation in gene expression of specific genes. Most generally, we expect that markers in upstream genes in the immune pathway should predict expression of downstream genes much more often than vice versa. For example, we believe that genetic differences in signaling genes could lead to differential expression of effector genes, but that genetic differences in effector genes do not result in feedback that influences transcription of signaling genes. For both the Ef-induced and Sm-induced samples, we consistently see an excess of associations between markers in upstream loci and gene expression of downstream loci relative to associations between markers in downstream loci and expression of upstream loci (Table 4). This pattern is consistently more significant between “adjacent” functional classes in the immune network, although the recognition/effector pair is also the case with the smallest number of tests and thus the lowest power.

The network structure argument also has implications for the distribution of cis and trans associations across expression of effector, signaling and recognition genes. Specifically, while there is no reason to believe that cis associations should be related to network structure, we hypothesize that downstream categories (particularly effector genes) will have significantly more trans associations than upstream categories. For both Ef-induced and Sm-induced samples, we find support for this hypothesis. In the Sm-induced sample, 4.32% of tests between trans markers and expression of effector genes are significant, compared to 2.75% for expression of signaling genes and 2.37% for expression of recognition genes (χ2 = 47.6607, d.f. = 2, P-value = 4.473×10⁻¹¹). In the Ef-induced sample, 4.64% of tests between trans markers and expression of effector genes are significant, compared to 2.65% for signaling genes and 2.62% for recognition genes (χ2 = 64.5568, d.f. = 2, P-value = 9.587×10⁻¹⁵). These differences remain significant if trans tests are split into those that involve markers in the same functional class as the expression phenotype being measured and those that involve markers in different functional classes (data not shown). In neither case do we observe significant differences in the proportions of cis tests that are significantly associated with gene expression phenotypes (data not shown), although pooled across all markers we observe a higher proportion of significant cis tests that trans tests (Ef-induced: Fisher's Exact Test P = 0.02737, Odds Ratio = 1.99; Sm-induced: Fisher's Exact Test P = 0.08566, Odds Ratio = 1.69).
To dissect the role of crosstalk and cross-regulation between signaling pathways in the pattern of associations between gene expression and SNPs, we examined the number of significant associations between markers in signaling genes in either the Toll or Imd pathway and expression of signaling genes in other signaling pathways. On the BeadChips, we have representatives from the Toll, Imd, JAK/STAT, JNK, Ras, p38, and Notch signaling pathways. We compared the observed number of tests significant at α = 0.01 (excluding potential cis associations) to the expected number based on chance alone, using χ2 tests. For the Ef-induced sample, we observe a significant excess (over chance expectations) of associations between markers in signaling genes in the Toll pathway and induction of signaling genes in the Toll pathway (P = 1.32×10⁻¹³) and the JAK/STAT pathway (P = 3.05×10⁻¹⁴); we also observe an excess of significant associations between markers in signaling genes in the Imd pathway and induction of signaling genes in the Imd pathway (P = 0.00159) and the Toll pathway (P = 0.0292), although the latter is not significant after Bonferroni correction.
For the Sm-induced sample, we see a similar pattern. There is a significant excess of significant associations between markers in signaling genes in the Toll pathway and induction of signaling genes in the Toll pathway (P = 1.32×10⁻¹³), and to a lesser extent induction of signaling genes in the Imd pathway (P = 0.0341) and the JAK/STAT pathway (0.0496), although the latter two P-values do not survive a Bonferroni correction. Markers in signaling genes in the Imd pathway are significantly more likely than expected by chance to be associated with induction of signaling genes in the Imd pathway (P = 0.0219) and the JAK/STAT pathway (P = 0.00102) after infection with S. marcescens.
Because the numbers of markers in signaling genes represent a relatively limited sample, some caution should be used in interpreting these results. Nonetheless, these data suggest that, in addition to self-regulation of both the Toll and Imd signaling pathways by components of the pathway, there is some crosstalk between the Toll, Imd, and JAK/STAT pathways, although there seems to be relatively little crosstalk between either of the Toll or Imd pathways and the JNK pathway, at least at the time point we examined (8 hours after infection). Given genetic variation for flux through the pathway, these patterns of autoregulation and cross-regulation may have the effect of amplifying the phenotypic consequences of minor genetic variants.
Quantitative trait transcripts
Considerable recent interest has focused on identifying not just genetic markers that associate with quantitative variation in phenotypes, but also transcripts whose abundance correlates with phenotypes of interest [5],[10],[27]. These attempts have had mixed success, with some studies failing to find any significant correlations between transcript abundance and phenotype [e.g., 10] and others finding some evidence for significant associations [e.g., 5].
Here, we used a simple regression of the induction of immune-related transcripts against either E. faecalis bacterial load (for Ef-induced sample), S. marcescens bacterial load (for Sm-induced sample), or overall bacterial load (as measured by the first principal component from all four bacterial load measures) to attempt to detect expression-phenotype associations. In this analysis, induction correlates with bacterial load for very few transcripts. Only the induction of Attacin C and Drosocin after E. faecalis infection correlate with E. faecalis bacterial load at a false discovery rate of 10%. Induction levels after S. marcescens infection do not appear to correlate with S. marcescens load for any transcripts, although uninfected expression level of pole hole (D-Raf) associates with S. marcescens load at a FDR of 0.0035, the most significant transcriptional association in our dataset (Figure 4). Uninfected transcriptional levels of six genes (CG30088, phl, Thor, Keap1, Dif, IM1) significantly associate with a principal component measuring overall immune competence and/or general vigor, at an FDR of <10%. Interestingly, pole hole is necessary for the proliferation or survival of circulating hemocytes in D. melanogaster [28],[29] suggesting that flies with lower levels of phl transcription may have fewer hemocytes and will be less able to resist infection.

Our analysis suggests that naturally occurring variation in expression level of individual genes, measured as either induction after infection or as absolute expression in uninfected flies, is a weak predictor of bacterial load phenotypes. This result suggests that, unlike complete or nearly complete knockdowns of single genes, which can have dramatic effects on bacterial load, the differences in expression of immune genes among lines that is observed in natural populations has relatively subtle consequences. However, given the structure of the immune network, this observation may not be surprising. The immune system is a highly co-regulated system, in which small changes in expression of upstream components can be amplified among downstream genes, and multiple feedback loops provide for some measure of self-regulation of the system. Furthermore, correlated transcription of many effectors could indicate that the overall extent to which the immune system (in whole or in part) is transcriptionally activated after infection is more biologically relevant than variable levels of activation of any one gene. In order to test this hypothesis, we considered whether principal components obtained from the correlation matrix among transcriptional profiles of subsets of genes predict phenotype. As an added advantage, the method of principal components reduces the dimensionality of large datasets, improving power.
Principal component analysis
Our initial hypothesis is that the most important transcriptional determinant of phenotype is the extent to which effector proteins are induced after infection. To measure this, we initially constructed a set of principal components (PCs) from the 61 genes in our dataset with a known or putative “effector” function. These include antimicrobial peptides, components of the phenoloxidase cascade, lysozymes, putative iron-sequestration proteins, and some less-well-characterized genes such as the Turandots. For both the Sm-induced dataset and the Ef-induced dataset, the variance explained by the first principal component is substantially higher than the variance explained by any other, and so we have focused on the first PC when looking for correlations with phenotypes.
This first PC estimated from the effector genes in the Ef-induced sample is significantly positively correlated with E. faecalis bacterial load (Figure 5A; β = 74.8, F1,28 = 7.309, P = 0.01153), explaining just over 20% of the variance among lines in resistance to E. faecalis (r2 = 0. 207). This PC is dominated by negative loadings of several antimicrobial peptide genes (Mtk, DptB, AttC, Drs) and genes encoding several uncharacterized peptides known to be induced by infection (IM23, IM10, TotM, IM2, IM4, IM1). The full set of loadings is available as Table S5. Thus, this analysis suggests that genetic lines that induce antimicrobial peptides (and potentially related peptides) more strongly (i.e., have a lower PC1) sustain a lower bacterial load and thus are better able to resist infection.

We also examined the Sm-induced sample using a similar procedure. However, we do not see any correlation between the first PC from the effector genes in the Sm-induced sample and S. marcescens bacterial load (β = 7.819, F1,28 = 0.2491, P = 0.6216), despite the fact that the Sm-induced PC is quite similar to the Ef-induced PC in terms of loadings. Serratia marcescens is resistant to the antimicrobial effects of Cecropins [30], Drosocins, and Defensins [31] suggesting that this bacterium may be particularly resistant to Drosophila antimicrobial defenses and providing a plausible hypothesis for the lack of effect of variation in effector gene induction on variation in bacterial load. The resistance of S. marcescens to antimicrobial peptides may also explain the disproportionate effect of expression level of the hematopoetic gene pole hole on resistance to S. marcescens infections, as cellular immunity may be the main mechanism of D. melanogaster resistance to S. marcescens.
Genetic associations with PC1
A major challenge of quantitative genetics in Drosophila has been to link genetic polymorphisms to phenotypes via differences in expression. In this study, we have shown correlations between transcript abundance and phenotype, as well as correlations between genotype and phenotype. To look for genotype-expression-phenotype correlations, we focused on the E. faecalis bacterial load phenotype and the Ef-induced expression sample, and asked whether any of the SNPs that have nominally significant correlations with bacterial load are also correlated with the effector induction PC1. Of the eight SNPs with at least nominal associations between genotype and phenotype (P<0.05), we find that one of them, PGRPSD_494, is also statistically associated with effector induction PC1 (Figure 5B; β = 0.0235, F1,27 = 11.4, P = 0.002237), explaining nearly 30% of the variance in this principal component (r2 = 0.297).
The PGRPSD_494 marker is a C/T polymorphism located approximately 500 bp upstream of the transcriptional start site of PGRP-SD. The T allele is associated with both a higher bacterial load after infection (Ef loadT-C = 0.6741; P = 0.02) and with lower induction of antimicrobial peptides (higher PC1; Figure 5C). PGRP-SD has been shown to have a role in the recognition of some Gram-positive bacteria, including E. faecalis [32], and our data suggest that naturally occurring variation in PGRP-SD may in fact mediate the strength of the transcriptional response to infection, and thus the ability of the fly to resist infection. This site does not appear to be significantly associated with induction or naïve expression of PGRP-SD in our data, but as mentioned previously it is associated with induction levels of 73 of the 329 immune genes we assayed. No other SNP in our dataset is associated with induction levels of more than 14 genes, and most are associated with induction levels of fewer than 10 genes.
Functional differentiation of PGRP-SD alleles
In order to test whether there is differential activation of either the Toll or the imd signaling pathway in lines carrying alternate alleles of PGRP-SD, we selected 7 random lines carrying the T allele and 7 random lines carrying the C allele at the PGRPSD_494 marker for further study. We infected these 14 lines with E. faecalis (as described in the Methods) and then, at five time points post-infection, assayed expression of two antimicrobial peptides that are commonly used as read-outs for the two major immune signaling pathways in Drosophila: DptA for the Imd pathway, and Drs for the Toll pathway. We find that there is a significant time by allele interaction for Drs expression (Table 5), but not DptA expression (data not shown), suggesting that the dynamics of Toll pathway activation are significantly different depending on which PGRP-SD allele a given fly line carries. Specifically, we find that lines carrying the PGRPSD_494 ‘C’ allele sustain Toll pathway activation at higher levels that those carrying the PGRPSD_494 ‘T’ allele (Figure 6), consistent with the observation that fly lines carrying the ‘C’ allele both have higher expression of effectors (measured by the effector PC1 described above) and sustain lower bacterial loads. Taken together, these results suggest that allelic state at PGRP-SD has a significant impact on downstream transcript abundance via modulation of Toll pathway activation dynamics, which in turn leads to observable differences in immune phenotypes.


Discussion
The pursuit of an understanding of underlying determinants of phenotypic variation in Drosophila has a long history [33]. More recently, the availability of high-throughput gene expression microarrays has generated interest in correlating variation in transcript abundance across genetic lines with differences in phenotypes [5]–[7],[10],[11]. However, datasets that include both genotype information and transcriptional variation have been rare [but see 10],[34]. In this paper, we have focused on attempting to predict immunocompetence in D. melanogaster from SNPs in candidate genes and transcript abundance, guided by the known structure of the innate immune network [1].
The strong context dependence of association test results leads us to focus on trends across functional classes of genes instead of individual statistical associations between markers and bacterial load phenotypes. We take advantage of the replication of our experiment across four different bacterial strains, as well as patterns of nominally significant associations within genes, to increase confidence in our associations. We identify two loci, both encoding proteins involved in bacterial recognition, that appear to harbor genetic variation that is consistently associated with differences in bacterial load phenotypes.
One of the these loci contains the closely linked genes GNBP1 and GNBP2. Several SNPs representing a single major haplotype are associated with differences in bacterial load after infection with both S. marcescens and P. rettgeri. It is somewhat unexpected to suggest a role for variation at GNBP1 in resistance against Gram-negative bacteria, as GNBP1 has only been shown to be involved recognizing Gram-positive bacteria and activating the Toll signaling pathway [35],[36]. However, the major haplotype spans both genes, making it impossible to determine the causal variant, and no definitive role for GNBP2 is known. Notably, however, the statistical support for an association between variation at this locus and bacterial load after P. rettgeri infection is particularly strong, and is significant even after strictly controlling family-wise error rates. The second of these loci encodes PGRP-LC, the major receptor in the Imd pathway [12], [37]–[39]. Three SNPs at this locus are associated with differences in bacterial load after infection with S. marcescens, E. faecalis, and L. lactis. The observation that variation in the Imd pathway, canonically thought to be principally involved in resistance to Gram-negative bacteria, appears to associate with differences in bacterial load after infection with Gram-positive bacteria suggests that the innate immune network is dynamic with extensive feedback, co-activation and crosstalk, consistent with previous work demonstrating synergistic activation of the immune response by the Toll and Imd pathways in combination [40]. This pattern is further demonstrated by the pattern of associations between genotype and gene expression: there are significantly more associations than expected by chance between SNPs in both the Toll and Imd pathways and signaling genes outside those pathways (particularly in the JAK/STAT pathway).
This study, combined with previous candidate-gene-based association studies between immunocompetence and polymorphisms on the second chromosome [2],[3], allows us to infer general patterns about the genetic architecture of immunocompetence in Drosophila. Most of the significant associations between SNPs and phenotype that we observe in this study are in genes encoding recognition proteins, primarily PGRPs and GNBPs, suggesting that variation in upstream components of the signaling network has substantial phenotypic consequences. Strikingly, we find a near-complete lack of significant associations, even without correcting for multiple tests, in antimicrobial peptides. In this study and in the previous studies, we genotyped 204 markers covering every known antimicrobial peptide in D. melanogaster. Only a single marker (CecC_1660), a noncoding SNP downstream of CecC, has a nominal P-value less than 0.05, and even that marker is unlikely to be a true association, as the association neither survives multiple test correction nor is observed in multiple experiments. Taken together, these studies provide convincing evidence that any functional effect of genetic variation in D. melanogaster AMP genes is far too small to be observed in experiments such as these. This observation supports the previous inference from genetic evidence that Drosophila AMPs are at least partially functionally redundant [41].
A different picture is painted when considering the effect of variation across lines in overall transcript abundance. Here, the total induction of effector genes (primarily AMPs and other induced peptides such as the Turandots) appears to correlate with bacterial load, at least after E. faecalis infection. Together, these observations suggest that while cis-acting variation in individual AMPs may be of little consequence overall for resistance to bacterial infection in D. melanogaster, the combined output of AMPs after infection is a critical determinant of resistance. Thus, genetic polymorphisms that influence expression of many downstream components of the pathway can potentially have large effects on resistance phenotypes, as appears to be the case for the PGRPSD_494 marker. We additionally note that in both the present and in our previous studies, SNP associations in candidate genes have failed to explain the entirety of the observed genetic variance. This indicates genetic variation for immunocompetence that maps to genes outside our candidate list, or to more complex (epistatic) interactions among genes.
The combination of genetic polymorphism, bacterial load phenotypes, and transcript abundance thus allows us to propose a model of the genetic architecture of immunocompetence informed by the structure of the innate immune network. Genetic variation in genes encoding proteins at the top of the network (such as recognition proteins) can be amplified by the pathway (as demonstrated by the association between variation at PGRP-SD and the Ef-induced effector PC1), leading to more significant associations with phenotype. However, genetic variation in genes encoding proteins at the bottom of the network, such as AMPs, has relatively little effect, as changes in any single effector protein do not seem to cause large enough effects on phenotype to be detectable in experiments of the scale we have performed. Since there appears to be relatively little feedback between SNPs in effector proteins and transcription of upstream genes (as demonstrated by the dearth of associations between effector SNPs and signaling gene transcripts), these effector SNPs probably have relatively little impact in trans. Overall, then, it is polymorphisms in upstream genes, and especially recognition genes, that lead to variation in abundance of effectors, and ultimately to fitness differences among lines (to the extent that resistance to infection correlates with overall fitness), while single mutations in antimicrobial peptides are likely to be of relatively little consequence.
This view of the evolutionary and fitness consequences of mutations in different components of the immune response is consistent with what is known about the evolutionary history of immune system genes in Drosophila. Population genetic and molecular evolutionary studies have suggested little evidence for adaptive evolution in antimicrobial peptides [42]–[44], which might be expected given the lack of evidence for fitness consequences attributable to segregating variation in these genes reported in this study and others [2],[3]. In contrast, we see significant evidence for adaptive evolution in upstream components of the immune system [42],[43],[45]; it is these genes that appear to harbor the population variation with the largest consequences for individual fitness. By combining expression data, genetic data, and knowledge of network structure, we can gain a much better understanding of the phenotypic consequences of genetic variation than any one component could provide alone.
Methods
Drosophila lines and bacterial stocks
We evaluated ninety-four lines of D. melanogaster for resistance to infection against each of four different bacteria. These lines are originally derived from a natural collection of wild-caught D. melanogaster from State College, PA by Anthony Fiumera. Each line in the panel is homozygous for an individual third chromosome isolated from the natural population and substituted into a common genetic background. The construction of these lines is described in more detail in Fiumera et al. [46]. The third chromosome is the largest D. melanogaster chromosome, containing about 44% of the euchromatic genome, including genes encoding proteins from all major functional classes of the immune system, and thus represents the most natural chromosome on which to focus our study. The D. melanogaster lines in this study were challenged with each of four different bacteria, two Gram-positive and two Gram-negative. The Gram-positive bacteria used are the E. faecalis and L. lactis strains described in Lazzaro et al. [2]. The Gram-negative bacteria used are the S. marcescens strain described in Lazzaro et al. [2], and Providencia rettgeri [47].
Survey sequencing and genotyping
We ascertained markers to be genotyped by sequencing the complete coding region and 1–2 kb upstream of 25 candidate loci (listed in Table 3) from 8 lines. We selected loci to represent genes encoding relatively well-characterized proteins that encompass a range of immune functions. While using a candidate gene approach necessarily means that we will not sample every polymorphism that may be associated with phenotypic differences among lines, our primary goal of capturing sufficient polymorphism to test hypotheses about the role of network structure mediating genotype-phenotype associations is well served by such an approach. We assembled sequencing reads into contigs using Sequencher and manually identified SNPs and indels to assay in the full panel of 94 lines. We used three different methods for genotyping our panel of lines. Approximately half of the markers were genotyped using SNPlex (Applied Biosystems, Foster City, CA) and the remaining markers were genotyped using pyrosequencing assays, SNPstream (Beckman Coulter, Fullerton, CA), or fRLFP [48]. A small number of markers were genotyped with both SNPlex and pyrosequencing; for the rare cases where the genotype call disagreed, we used the SNPlex call. After genotyping, SNPs were filtered to produce a set of 137 usable markers (136 SNPs and 1 indel): markers with a minor allele frequency <0.05 were dropped, and only one marker (chosen at random) was kept from any pair with LD (measured by r2)>0.90. Annotation information for each SNP, including the genotyping method used to assay each SNP in the 94 lines, are presented as Table S6. Filtered genotype calls for each line are presented in Table S7. Linkage disequilibrium between each pair of genotypes is provided in Table S8.
Bacterial infections
We infected the 94 D. melanogaster lines in a complete-block design, with each line infected on each of three different days. On each day, each line was infected by one of 3 to 5 infectors at random, and a different infector infected each line on each day. Typically 2-3 replicates per line per sex were obtained on each day, for a total of 12–18 replicate data points for each D. melanogaster line. The entire experiment was repeated independently for each bacterial challenge. Flies were artificially infected by septic pinprick as described previously [2],[3]. Briefly, we pierced the thoraces of individual D. melanogaster aged 3–5 days post-eclosion with a 0.1-mm dissecting pin (Fine Science Tools, Foster City, CA) coated in liquid culture (OD600 = 1.0±0.2) of the bacterium of interest, delivering an average of 4×10³ bacteria to each fly. Drosophila were maintained at 22°–24°C on a rich dextrose medium for the duration of the experiment. To measure bacterial load, we homogenized same-sex trios of flies 28 hours post-infection in 500 µl of sterile LB and then quantitatively plated the homogenates on standard LB agar plays using robotic spiral platers manufactured by Spiral Biotech (Bethesda, MD) and Don Whitley Scientific (Fredrick, MD). We incubated the plates overnight at 37°C and then estimated the concentration of viable bacteria in each homogenate using the colony counting systems associated with each plater. Prior to plating, we diluted homogenates of L. lactis 1000-fold, homogenates of P. rettgeri 100-fold, and homogenates of E. faecalis 10-fold, all in sterile LB, in order to correct for anticipated high bacterial loads. Our estimates of bacterial load per fly were transformed to correct for these dilutions before analysis. Mean bacterial load sustained by each line against each of the four bacteria is presented in Figure 1 and Table S7.
For some analyses, we generated a principal component from bacteria load line means after infection by each of the four bacteria using the prcomp() function in R. This principal component is positively correlated with load after infection with all four bacteria, suggesting it represents a common measure of immunocompetence across bacteria. However, it is also likely that this principal component captures some aspects of general vigor.
A number of recent studies have suggested that bacterial load sustained after infection and survival to infections are not strongly correlated in Drosophila melanogaster, suggesting that survival may be mediated in part by tolerance to bacterial loads [49]–[51]. In this study, we focus on resistance, as defined by bacterial load sustained 28 hours after artificial infection. Although knowledge of the molecular mechanisms that determine tolerance is increasing [52], there is not yet sufficient understanding of the underlying mechanistic basis for tolerance phenotypes to allow fruitful candidate gene association studies or to develop models based on network structure and functional attributes of candidate genes.
BeadChip design
We selected 329 immune genes for inclusion on the custom Illumina BeadChips based on a number of criteria, including evidence for transcriptional regulation by infection in previous microarray experiments, genetic or molecular evidence for a role in immunity, and homology to known immune proteins in D. melanogaster or other organisms. The remaining 384 non-immune genes were selected either as controls or for other experimental reasons. Each gene is represented by two different probes, each of which is represented by an average of 30 beads on the array, giving an extremely high degree of technical replication. Given the number of samples assayed (as described below), we determined that genome-wide expression approaches were not practical; however, since numerous previous studies in D. melanogaster have identified a robust set of immune-regulated transcripts [15],[20],[53] we believe that a targeted expression approach represented by custom Illumina BeadChips captures the vast majority of genes whose expression is regulated by infection.
Expression infections
We selected a total of 30 lines for our expression analysis, biased towards the upper and lower tails of the phenotypic distribution. Males of each line were either infected with S. marcescens with E. faecalis, as described above, or left uninfected, and then frozen 8 hours after treatment. We chose to use an 8-hour post-infection timepoint as a compromise between earlier time points, where the transcriptional response to wounding could be confounding, and later time points that risked missing transcriptional events that would be relevant to bacterial load at 28 hours after infection. We extracted total RNA using Trizol (Invitrogen Corp., Carlsbad, CA) following standard protocols, then made cDNA and amplified RNA samples following the BeadChip protocol.
BeadChip hybridizations and data normalization
RNA samples were hybridized to BeadChips following standard protocols and scanned. After scanning, we normalized the data using the qspline method in the beadarray package for R. Mean probability of detection and signal intensity of control genes were used as hybridization quality control: for samples that failed to pass quality control checks, cDNA synthesis, RNA amplification, and hybridization were repeated from the original RNA extractions. Normalized induction after E. faecalis and S. marcescens infection (where induction is measured as log2 signal intensity for the infected sample minus log2 signal intensity for the uninfected sample), as well as unnormalized expression data from all treatments (Ef-infected, Sm-infected, Naïve) are presented as Dataset S1 and Dataset S2, respectively.
Quantitative PCR
For quantitative PCR experiments, we sampled three replicates of 5–7 flies from each of 14 lines (7 carrying the C allele at PGRP-SD_494, 7 carrying the T allele, randomly selected) at five time points: uninfected (0 hours), 3 hours post-infection (with E. faecalis), 6 hours post-infection, 12 hours post-infection, and 24 hours post-infection. Flies were frozen in liquid nitrogen, RNA was extracted with Trizol, first strand cDNA synthesis was carried out, and qPCR TaqMan assays were run using standard protocols. We measured expression of three different genes: Drs, DptA, and Rp49. TaqMan probe and primer sequences, and reaction conditions, are available upon request from T.B.S. Data points with raw Rp49 CT values more than 1.5 times the interquartile range from the median were removed to eliminate samples with very little RNA or poor reverse transcription efficiency. Raw 1/CT values were normalized by Rp49 expression and values for each plate were mean-centered. Normalized expression of either Drs (Toll pathway) or DptA (Imd pathway) was then used as the response variable in the following second-order linear model:(1)where Y is normalized expression, Time (i = 0,3,6,12,24) is time after infection measured in hours, and PGRPSD (j = C, T) is allele at the PGRPSD_494 marker, and Line (k = 3F, 3E, 8A, 12E, 9D, 7C, 4C, 11F, 6E, 1C, 9E, 1E, 7D, 6H) is the genetic line and is treated as a random effect nested within PGRPSD. Because the response to time is not linear, we fitted a second-order model with a linear and quadratic time term, using the poly() function in R to estimate orthogonal polynomial terms.
Statistical analysis
In order to test for associations between genotype and phenotype, we analyzed the following model using the package lme4 in R 2.6.0,(2)where Y is bacterial load, Sex (i = 1,2) and Allele (j = 1,2) are main effects, and Line (k = 1,94), Day (l = 1,3), Infector (m = 1,5), and Plater (n = 1,2) are random effects. To assess significance, we compared the model coefficient for the Allele term to the null distribution obtained by permuting the genotype vector assigned to each line 5070 times and reanalyzing the data with the same model. The permutation approach was carried out as follows: for each row of the dataset, we have columns representing the four bacterial load phenotypes and the 137 genetic markers. For each permutation iteration, we randomize the phenotype vector with respect to the genotype vector, but do not shuffle relationships between among load phenotypes or among genetic markers. In this way, the permutation procedure preserves the correlations among bacterial loads and among genetic markers, but randomizes the association between genotype and phenotype.
For each permutation, we retain the estimated model coefficient (effect size), and the χ2 statistic for the test of the alternate and null (without an Allele term) model. Because the permutations shuffle the full genotype vector assigned to each line, rather than individual allele states, linkage relationships among markers are preserved in the permuted data. We use this fact to correct for linkage relationships among markers for many tests. Using the χ2 statistics from the permutated data, we can generate null distributions of P-values under the appropriate linkage conditions but assuming no significant genotype-phenotype associations.
We also use the χ2 statistics to estimate a combined probability of an association between all markers in a loci and a bacterial load phenotype. In this case, we sum the χ2 statistics for each marker in a loci for the permuted dataset, and use that distribution as a null distribution to compare the observed sum of χ2 statistics within each gene.
For our simulations to estimate the power of our experiment, we collapsed Day, Infector, and Plater terms into a single Experimental Error term, and then simulated 10,000 replicate datasets for each combination of Gram type (positive or negative), minor allele frequency (0.25 or 0.5) and Allele coefficient (0 to 1 in 0.1 increments). Each simulation assumes 3 replicates per experimental treatment (n = 3), per sex (n = 2), per line (n = 94), for a total of 18 data points per line and 1692 per simulation. This approximates our experimental conditions, with the caveat that the simulations assume no missing data and so will be an upper bound on our true power. Error terms are assumed to be normally distributed with a mean of 0 and variance equal to our estimated variance terms from Table 1, averaged across either Gram-positive or Gram-negative bacteria. To calculate power, we counted the number of tests significant at a nominal α of 0.01; significance was estimated by comparing the fit of a mixed linear model that included Line and Experimental Error as random effects and Allele and Sex as fixed effects to the fit of a null model that does not include a fixed effect of Allele.
In order to test for sex*marker interactions, we used a similar approach. In this case, we compared the likelihood of the data under the null model specified by equation (2) to likelihood of the data under the following alternative model:(3)where all terms are as described above. To assess significance, we compared the likelihood ratio test statistic obtaining by comparing the null and alternative models to the empirical null distribution of likelihood ratio test statistics obtained by analyzing 1000 permuted datasets in which the genotype vector assigned to each line was shuffled.
To test for associations between genotype and expression, we compared the likelihood of the data under the following linear model:(4)where Y is the normalized induction of a given gene (where induction is measured as log2 normalized signal intensity for the infected sample minus log2 normalized signal intensity for the control sample), Probe (j = 1,2) is a random effect representing the two probes on the array for each gene, and Allele (i = 1,2) is the fixed main effect of interest, to the likelihood of the data under the null model that retains the random effect of Probe but includes only a fixed intercept. As the number of tests is far too large for permutations to be computationally feasible, we used the anova() function in lme4 to assess the significance of the alternative model using a likelihood ratio test.
In order to test for correlations between transcript abundance and phenotype, we used two approaches. In the first approach we tested each transcript against phenotype individually, using a simple linear regression (with the model Load = Expression) and assessing significance assuming the standard null distribution for the F statistic. In the second approach, we generated principal components from a priori subsets of transcripts, using the prcomp() function in R, and then assessed the correlation between the first principal component and bacterial load using a simple linear regression.
To correct for multiple testing, we used an false-discovery-rate (FDR) and/or Holm familywise error rate control approach, as described in the Results section, implemented using the p.adjust() function in R.
Supporting Information
Zdroje
1. LemaitreB
HoffmannJ
2007 The host defense of Drosophila melanogaster. Annual Review of Immunology 25 697 743
2. LazzaroBP
SacktonTB
ClarkAG
2006 Genetic variation in Drosophila melanogaster resistance to infection: a comparison across bacteria. Genetics 174 1539 1554
3. LazzaroBP
SceurmanBK
ClarkAG
2004 Genetic basis of natural variation in D. melanogaster antibacterial immunity. Science 303 1873 1876
4. TinsleyMC
BlanfordS
JigginsFM
2006 Genetic variation in Drosophila melanogaster pathogen susceptibility. Parasitology 132 767 773
5. Passador-GurgelG
HsiehW-P
HuntP
DeightonN
GibsonG
2007 Quantitative trait transcripts for nicotine resistance in Drosophila melanogaster. Nature genetics 39 264 268
6. DrnevichJM
ReedyMM
RuediEA
Rodriguez-ZasS
HughesKA
2004 Quantitative evolutionary genomics: differential gene expression and male reproductive success in Drosophila melanogaster. Proceedings Biological sciences 271 2267 2273
7. CoffmanCJ
WayneML
NuzhdinSV
HigginsLA
McIntyreLM
2005 Identification of co-regulated transcripts affecting male body size in Drosophila. Genome biology 6 R53 R53
8. EdwardsAC
RollmannSM
MorganTJ
MackayTFC
2006 Quantitative genomics of aggressive behavior in Drosophila melanogaster. PLoS Genet 2 e154 doi:10.1371/journal.pgen.0020154
9. JordanKW
CarboneMA
YamamotoA
MorganTJ
MackayTFC
2007 Quantitative genomics of locomotor behavior in Drosophila melanogaster. Genome biology 8 R172 R172
10. FiumeraAC
DumontBL
ClarkAG
2005 Sperm competitive ability in Drosophila melanogaster associated with variation in male reproductive proteins. Genetics 169 243 257
11. HarbisonST
ChangS
KamdarKP
MackayTFC
2005 Quantitative genomics of starvation stress resistance in Drosophila. Genome biology 6 R36 R36
12. ChoeK-M
WernerT
StövenS
HultmarkD
AndersonKV
2002 Requirement for a peptidoglycan recognition protein (PGRP) in Relish activation and antibacterial immune responses in Drosophila. Science 296 359 362
13. GobertV
GottarM
MatskevichAA
RutschmannS
RoyetJ
2003 Dual activation of the Drosophila toll pathway by two pattern recognition receptors. Science 302 2126 2130
14. WernerT
Borge-RenbergK
MellrothP
SteinerH
HultmarkD
2003 Functional diversity of the Drosophila PGRP-LC gene cluster in the response to lipopolysaccharide and peptidoglycan. The Journal of biological chemistry 278 26319 26322
15. De GregorioE
SpellmanPT
TzouP
RubinGM
LemaitreB
2002 The Toll and Imd pathways are the major regulators of the immune response in Drosophila. The EMBO journal 21 2568 2579
16. LemaitreB
ReichhartJM
HoffmannJA
1997 Drosophila host defense: differential induction of antimicrobial peptide genes after infection by various classes of microorganisms. Proceedings of the National Academy of Sciences of the United States of America 94 14614 14619
17. Hedengren-OlcottM
OlcottMC
MooneyDT
EkengrenS
GellerBL
2004 Differential activation of the NF-kappaB-like factors Relish and Dif in Drosophila melanogaster by fungi and Gram-positive bacteria. The Journal of biological chemistry 279 21121 21127
18. TanjiT
HuX
WeberANR
IpYT
2007 Toll and IMD pathways synergistically activate an innate immune response in Drosophila melanogaster. Molecular and cellular biology 27 4578 4588
19. AgaisseH
PerrimonN
2004 The roles of JAK/STAT signaling in Drosophila immune responses. Immunological reviews 198 72 82
20. BoutrosM
AgaisseH
PerrimonN
2002 Sequential activation of signaling pathways during innate immune responses in Drosophila. Developmental cell 3 711 722
21. ImlerJ-L
BuletP
2005 Antimicrobial peptides in Drosophila: structures, activities and gene regulation. Chemical immunology and allergy 86 1 21
22. McKeanKA
NunneyL
2005 Bateman's principle and immunity: phenotypically plastic reproductive strategies predict changes in immunological sex differences. Evolution; international journal of organic evolution 59 1510 1517
23. RolffJ
2002 Bateman's principle and immunity. Proceedings Biological sciences 269 867 872
24. ZukM
1990 Reproductive strategies and disease susceptibility: an evolutionary viewpoint. Parasitology today 6 231 233
25. MackayTFC
2004 The genetic architecture of quantitative traits: lessons from Drosophila. Current opinion in genetics & development 14 253 257
26. Hill-BurnsEM
ClarkAG
2009 X-linked Variation in Immune Response in Drosophila melanogaster. Genetics Oct 12 [Epub ahead of print]
27. EmilssonV
ThorleifssonG
ZhangB
LeonardsonAS
ZinkF
2008 Genetics of gene expression and its effect on disease. Nature 452 423 428
28. EvansCJ
HartensteinV
BanerjeeU
2003 Thicker than blood: conserved mechanisms in Drosophila and vertebrate hematopoiesis. Developmental cell 5 673 690
29. LuoH
RosePE
RobertsTM
DearolfCR
2002 The Hopscotch Jak kinase requires the Raf pathway to promote blood cell activation and differentiation in Drosophila. Molecular genetics and genomics: MGG 267 57 63
30. SamakovlisC
KimbrellDA
KylstenP
EngströmA
HultmarkD
1990 The immune response in Drosophila: pattern of cecropin expression and biological activity. The EMBO journal 9 2969 2976
31. NehmeNT
LiégeoisS
KeleB
GiammarinaroP
PradelE
2007 A model of bacterial intestinal infections in Drosophila melanogaster. PLoS Pathog 3 e173 doi:10.1371/journal.ppat.0030173
32. BischoffV
VignalCc
BonecaIG
MichelT
HoffmannJA
2004 Function of the Drosophila pattern-recognition receptor PGRP-SD in the detection of Gram-positive bacteria. Nature immunology 5 1175 1180
33. LynchM
WalshB
1998 Genetics and Analysis of Quantitative Traits: Sinauer Associates. 980
34. WentzellAM
RoweHC
HansenBG
TicconiC
HalkierBA
2007 Linking metabolic QTLs with network and cis-eQTLs controlling biosynthetic pathways. PLoS Genet 3 e162 doi:10.1371/journal.pgen.0030162
35. Pili-FlouryS
LeulierFo
TakahashiK
SaigoK
SamainE
2004 In vivo RNA interference analysis reveals an unexpected role for GNBP1 in the defense against Gram-positive bacterial infection in Drosophila adults. The Journal of biological chemistry 279 12848 12853
36. WangL
WeberANR
AtilanoML
FilipeSR
GayNJ
2006 Sensing of Gram-positive bacteria in Drosophila: GNBP1 is needed to process and present peptidoglycan to PGRP-SA. The EMBO journal 25 5005 5014
37. ChoeK-M
LeeH
AndersonKV
2005 Drosophila peptidoglycan recognition protein LC (PGRP-LC) acts as a signal-transducing innate immune receptor. Proceedings of the National Academy of Sciences of the United States of America 102 1122 1126
38. GottarM
GobertV
MichelT
BelvinM
DuykG
2002 The Drosophila immune response against Gram-negative bacteria is mediated by a peptidoglycan recognition protein. Nature 416 640 644
39. RämetM
ManfruelliP
PearsonA
Mathey-PrevotB
EzekowitzRAB
2002 Functional genomic analysis of phagocytosis and identification of a Drosophila receptor for E. coli. Nature 416 644 648
40. TanjiT
HuX
WeberAN
IpYT
2007 Toll and IMD pathways synergistically activate an innate immune response in Drosophila melanogaster. Mol Cell Biol 27 4578 4588
41. TzouP
ReichhartJ-M
LemaitreB
2002 Constitutive expression of a single antimicrobial peptide can restore wild-type resistance to infection in immunodeficient Drosophila mutants. Proceedings of the National Academy of Sciences of the United States of America 99 2152 2157
42. SacktonTB
LazzaroBP
SchlenkeTA
EvansJD
HultmarkD
2007 Dynamic evolution of the innate immune system in Drosophila. Nature genetics 39 1461 1468
43. LazzaroBP
2008 Natural selection on the Drosophila antimicrobial immune system. Curr Opin Microbiol 11 284 289
44. JigginsFM
KimKW
2005 The evolution of antifungal peptides in Drosophila. Genetics 171 1847 1859
45. SchlenkeTA
BegunDJ
2003 Natural selection drives Drosophila immune system evolution. Genetics 164 1471 1480
46. FiumeraAC
DumontBL
ClarkAG
2007 Associations between sperm competition and natural variation in male reproductive genes on the third chromosome of Drosophila melanogaster. Genetics 176 1245 1260
47. JunejaP
LazzaroBP
2009 Providencia sneebia sp. nov. and Providencia burhodogranariea sp. nov., isolated from wild Drosophila melanogaster. Int J Syst Evol Microbiol 59 1108 1111
48. LazzaroBP
SceurmanBK
CarneySL
ClarkAG
2002 fRFLP and fAFLP: medium-throughput genotyping by fluorescently post-labeling restriction digestion. BioTechniques 33 539 540, 542, 545–536
49. AyresJS
FreitagN
SchneiderDS
2008 Identification of Drosophila mutants altering defense of and endurance to Listeria monocytogenes infection. Genetics 178 1807 1815
50. Corby-HarrisV
HabelKE
AliFG
PromislowDE
2007 Alternative measures of response to Pseudomonas aeruginosa infection in Drosophila melanogaster. J Evol Biol 20 526 533
51. ReadAF
GrahamAL
RabergL
2008 Animal defenses against infectious agents: is damage control more important than pathogen control. PLoS Biol 6 e1000004 doi:10.1371/journal.pbio.1000004
52. AyresJS
SchneiderDS
2008 A signaling protease required for melanization in Drosophila affects resistance and tolerance of infections. PLoS Biol 6 e305 doi:10.1371/journal.pbio.0060305
53. De GregorioE
SpellmanPT
RubinGM
LemaitreB
2001 Genome-wide analysis of the Drosophila immune response by using oligonucleotide microarrays. Proceedings of the National Academy of Sciences of the United States of America 98 12590 12595
Štítky
Genetika Reprodukční medicínaČlánek vyšel v časopise
PLOS Genetics
2010 Číslo 1
Nejčtenější v tomto čísle
- A Major Role of the RecFOR Pathway in DNA Double-Strand-Break Repair through ESDSA in
- Kidney Development in the Absence of and Requires
- The Werner Syndrome Protein Functions Upstream of ATR and ATM in Response to DNA Replication Inhibition and Double-Strand DNA Breaks
- Alternative Epigenetic Chromatin States of Polycomb Target Genes