
Gene–Environment Interactions at Nucleotide Resolution
Interactions among genes and the environment are a common source of phenotypic variation. To characterize the interplay between genetics and the environment at single nucleotide resolution, we quantified the genetic and environmental interactions of four quantitative trait nucleotides (QTN) that govern yeast sporulation efficiency. We first constructed a panel of strains that together carry all 32 possible combinations of the 4 QTN genotypes in 2 distinct genetic backgrounds. We then measured the sporulation efficiencies of these 32 strains across 8 controlled environments. This dataset shows that variation in sporulation efficiency is shaped largely by genetic and environmental interactions. We find clear examples of QTN:environment, QTN: background, and environment:background interactions. However, we find no QTN:QTN interactions that occur consistently across the entire dataset. Instead, interactions between QTN only occur under specific combinations of environment and genetic background. Thus, what might appear to be a QTN:QTN interaction in one background and environment becomes a more complex QTN:QTN:environment:background interaction when we consider the entire dataset as a whole. As a result, the phenotypic impact of a set of QTN alleles cannot be predicted from genotype alone. Our results instead demonstrate that the effects of QTN and their interactions are inextricably linked both to genetic background and to environmental variation.
Published in the journal:
. PLoS Genet 6(9): e32767. doi:10.1371/journal.pgen.1001144
Category:
Research Article
doi:
https://doi.org/10.1371/journal.pgen.1001144
Summary
Interactions among genes and the environment are a common source of phenotypic variation. To characterize the interplay between genetics and the environment at single nucleotide resolution, we quantified the genetic and environmental interactions of four quantitative trait nucleotides (QTN) that govern yeast sporulation efficiency. We first constructed a panel of strains that together carry all 32 possible combinations of the 4 QTN genotypes in 2 distinct genetic backgrounds. We then measured the sporulation efficiencies of these 32 strains across 8 controlled environments. This dataset shows that variation in sporulation efficiency is shaped largely by genetic and environmental interactions. We find clear examples of QTN:environment, QTN: background, and environment:background interactions. However, we find no QTN:QTN interactions that occur consistently across the entire dataset. Instead, interactions between QTN only occur under specific combinations of environment and genetic background. Thus, what might appear to be a QTN:QTN interaction in one background and environment becomes a more complex QTN:QTN:environment:background interaction when we consider the entire dataset as a whole. As a result, the phenotypic impact of a set of QTN alleles cannot be predicted from genotype alone. Our results instead demonstrate that the effects of QTN and their interactions are inextricably linked both to genetic background and to environmental variation.
Introduction
As we identify more genetic loci that underlie complex traits, the challenge remains to understand and predict the effects of the causal genetic variants upon individuals' phenotypes. The relationship between genotype and phenotype is rarely simple. The effect of an allele often depends upon the environment, resulting in gene-environment interactions (GxE). GxE is a well-documented occurrence in many species, including humans [1]–[5]. Gene-gene interactions also take place that render the effect of one locus dependent upon the genotype at another locus. Genetic interactions can occur between characterized loci (epistasis) [6], [7], or between one known locus and other unknown loci (genetic background effects) [8]. If individuals vary in their environmental exposure and genetic makeup, as they almost always do in nature, then GxE and genetic interactions will create differences in the effects of alleles among individuals.
Therefore, to understand allelic effects, we must also understand the scope and prevalence of genetic and environmental interactions. However, standard approaches for the identification of causative loci, such as association analysis and linkage mapping [9], measure the average effects of alleles in populations. Without very large sample sizes, population averages cannot account for potential individual-to-individual variation created by complex interactions [10]. Some study of interactions on an individual-to-individual basis has occurred through the use of near isogenic lines [11], but there are still few examples that illustrate the impact of interactions from one individual to the next at the resolution of single-nucleotides [7], [12].
To better understand the effects of GxE and genetic interactions at the resolution of single nucleotides, we took advantage of four naturally occurring quantitative trait nucleotides (QTN) known to cause variation in yeast sporulation efficiency [13], [14]. We engineered allele replacement strains that carry all possible combinations of these QTN in two genetic backgrounds, and we then systematically measured the phenotypes of these strains in eight environments. Our results provide a detailed picture of how segregating QTN, environmental variation, and genetic background all combine to shape variation in a quantitative trait through complex relationships.
Results
Our phenotype of interest, yeast sporulation, is a cell fate decision executed by diploid yeast cells in response to a shift from fermentative to respiratory conditions [15]. Yeast cells switch to primarily aerobic respiration when faced with only a non-fermentable carbon source. When this environmental change is accompanied by a reduction in a critical nutrient such as nitrogen, a fraction of yeast cells in a culture will initiate meiosis and enclose the meiotic products in a protective spore wall.
Our QTN all affect the proportion of cells in a culture that initiate meiosis (the sporulation efficiency) after a shift from glucose (fermentable) to acetate (non-fermentable) media. The QTN include a coding polymorphism in RSF1 (a positive regulator of respiration) [16], both coding and non-coding polymorphisms in IME1 (the master regulator of sporulation) [17], and a non-coding polymorphism in RME1 (a direct repressor of IME1) [18], [19]. Each of these genes encodes a transcription factor.
Each QTN has two alleles: a reference allele found in the wild oak tree isolate YPS606, and an allele that reduces sporulation efficiency from the vineyard isolate UCD2120 [14]. (In the rest of this article, we denote the QTN with the labels: rsf1, rme1, ime_coding, and ime_nc.) Both the patterns of phenotypic variation in sporulation efficiency and the sequence variation of the causal genes indicate that sporulation efficiency is subject to purifying selection in oak strains and disruptive selection in vineyard strains [14], [20]. The change in phenotype caused by the QTN therefore represents genotype-phenotype variation that has occurred due to a shift in selective pressures between two habitats.
To broadly test for GxE effects, we first measured the sporulation efficiency of each parent strain genetic background (designated oak and vineyard) carrying two QTN genotype combinations: either all the QTN alleles of the oak parent, or all the QTN alleles of the vineyard parent. We generated environmental variation by growing the strains in eight different fermentative media conditions (Table 1) prior to the induction of sporulation in acetate (see Methods). In all eight environments and across both genetic backgrounds, the oak QTN alleles collectively increase sporulation efficiency, and the vineyard QTN alleles collectively decrease sporulation efficiency (Table 2). However, the environments vary with respect to the proportion of the phenotype that the QTN explain (Table 3). For example, in grape juice, we can explain 99% of the phenotypic difference between the parents by placing the vineyard QTN alleles into the oak background. However, in raffinose, the same allele replacement explains only 55% of the parental difference. The phenotypic difference explained by the QTN also depends on the genetic background. For example, placing the oak QTN alleles into the vineyard background explains 90% of the difference between the parent strains in raffinose, but we explain only 55% of the difference between the parents if we conduct the reciprocal experiment that places the vineyard QTN alleles into the oak background. Because the phenotypic difference created by the QTN varies across both the environments and genetic backgrounds, our results imply genetic interactions among the QTN, the environmental treatments, and uncharacterized loci in the two parent genetic backgrounds.


To further investigate the extent of these interactions, we measured the phenotypes of strains with all 16 possible QTN genotype combinations in both genetic backgrounds (32 total strains). We calculated a correlation matrix of the eight environments from their effects on the phenotype rank-order of the 32 strains so that we can broadly compare the QTN effects across environmental treatments and genetic backgrounds (Table 4). Because the QTN alleles always act in the same direction regardless of condition, all the environments were positively correlated (Spearman's ρ = 0.69 to 0.99). The differences in correlations therefore reflect changes in the rank order (and therefore relative magnitude) of QTN effects.

We used hierarchical clustering to construct a dendrogram that reflects the correlations between environments (Figure 1). Sucrose, fructose, and glucose are the most highly correlated environments (Spearman's ρ>0.99 for all pair wise comparisons) and cluster closely. We did not detect significant differences between these three environments in either genetic background. Their values were therefore pooled and averaged as “glucose-like” (YGlu) for all subsequent analyses.

Maltose and raffinose cluster separately from YGlu and are slightly less correlated with glucose (ρ = 0.93, 0.96, respectively). Both the oak and vineyard genetic backgrounds sporulate more efficiently in raffinose than in YGlu. (Figure 2A) The effect of maltose, however, depends upon the genetic background (Figure 2B). Sporulation efficiency of the vineyard background is similar in maltose and YGlu, but the oak background sporulates more efficiently in maltose. Therefore, there is an interaction between the genetic background and maltose.

Galactose also shows a background:environment interaction. The oak background sporulates similarly in galactose and YGlu, but the vineyard background sporulates more efficiently in galactose (Figure 2C). In Figure 1, galactose clusters distinctly from all other environments. When we run the clustering algorithm separately for each genetic background, this separation disappears (Figures S1, S2). Therefore, the disparity of galactose relative to the other environments appears to result from the background:environment interaction.
Synthetic oak exudate and grape juice also cluster distinctly from the other environments, but these two conditions are highly correlated with each other (ρ = 0.97). The sporulation efficiency of both genetic backgrounds tends to be lower in exudate and grape juice than in the other environments (Figure 1, Tables S1, S2). There are also QTN:environment interactions that occur in both exudate and grape juice relative to YGlu. For example, in the oak background, the rsf1 vineyard allele has a much larger effect in exudate and grape juice than it does in YGlu (Figure 3). To quantify this difference in QTN effect, we constructed a linear model of sporulation efficiency in the oak background that incorporates the main effects of single QTN, the effects of the environments, and the QTN:environment interactions (see Methods). In this model, the differential effect of rsf1 is manifested as a QTN:environment interaction in exudate and grape juice relative to YGlu (exudate: effect = −34±2%, t-test, P<2e-16; grape juice: effect = −25±2%, t-test P<2e-16; all errors reported in the text are the standard errors of coefficient estimates). The effect of rsf1 is the largest of any single QTN in both grape juice and exudate (Tukey's HSD, maximum adjusted P = 0.002). However, in YGlu the rsf1 QTN does not even have a significant main effect in the oak background (effect = −1.8±1%, t-test P = 0.08).
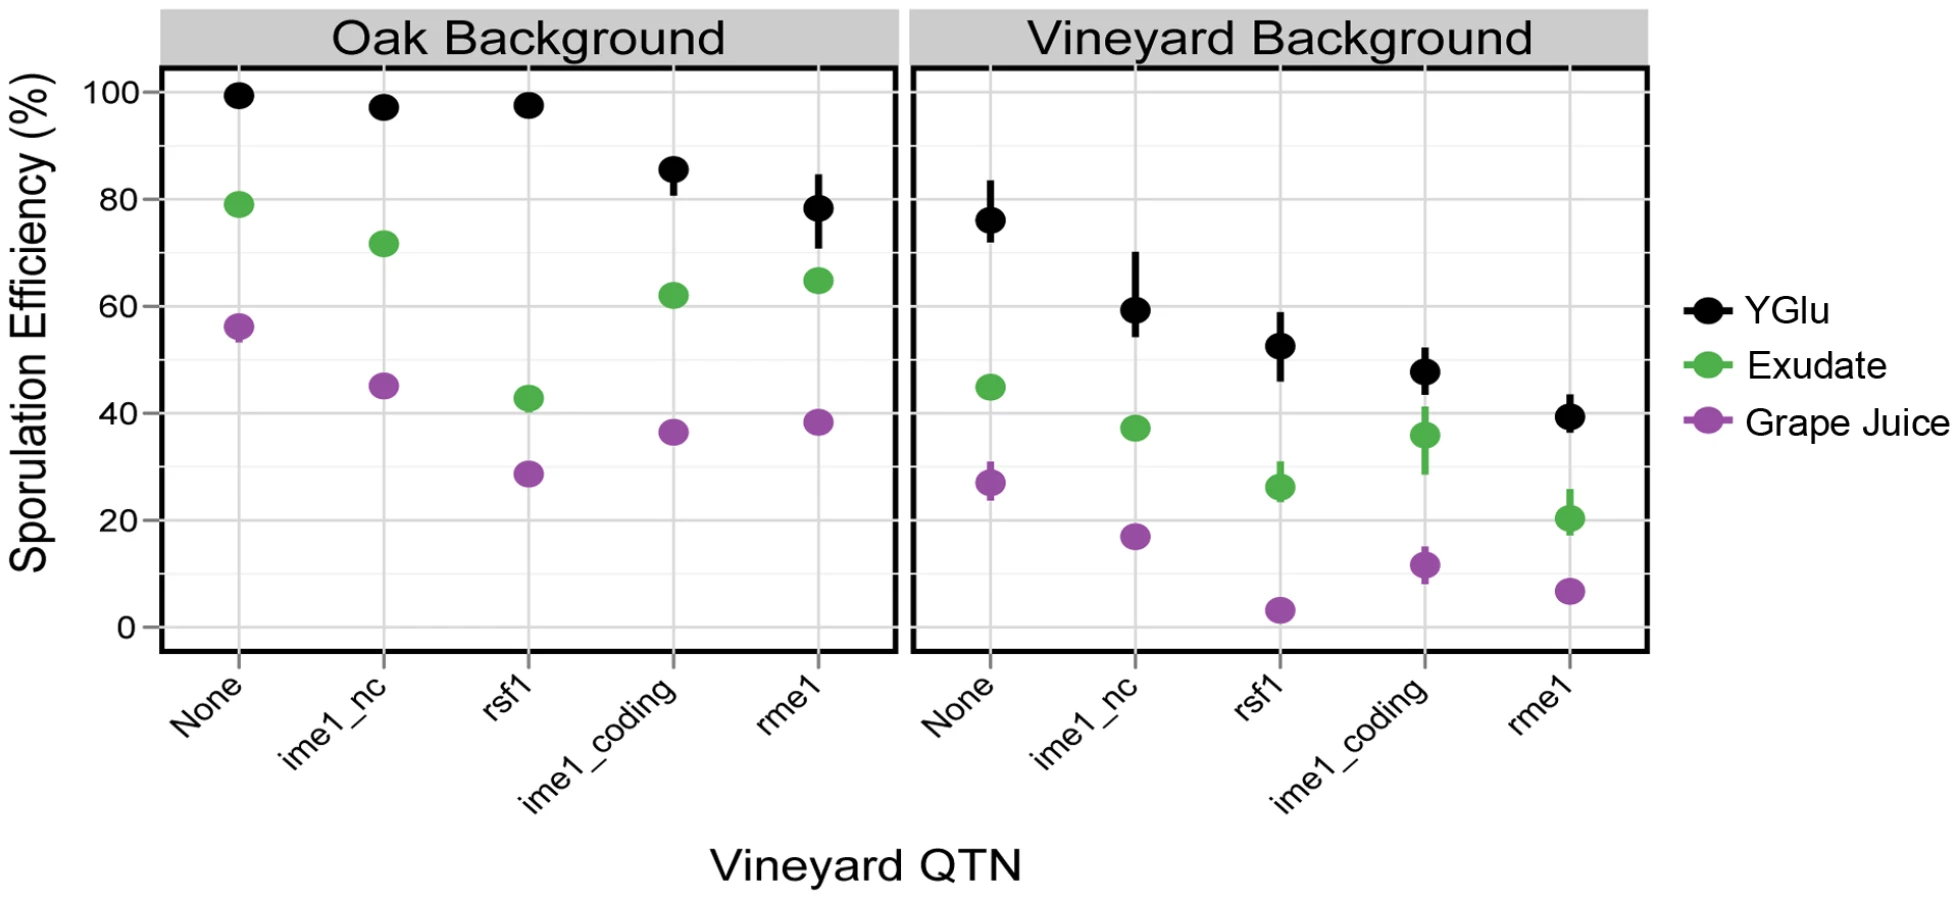
The effect of rsf1 in the vineyard background reveals a different story. In the vineyard background, the rsf1:environment interaction is not significant in exudate or grape juice (exudate: effect = 4.8±2.8%, t-test P = 0.1; grape juice: effect = −0.3±0.03%, t-test, P = 0.92). Instead, rsf1 has a large main effect in YGlu as well as exudate and grape juice (Figure 3). Therefore, the effect of rsf1 can be best explained as an environment:rsf1:background interaction that reduces the effect of rsf1 in YGlu relative to exudate and grape juice, but only in the oak strain background.
How do the effects of these environment and background interactions compare with the role played by QTN:QTN interactions? We previously demonstrated significant QTN:QTN epistasis in the oak background and the glucose environment [14]. In that context, epistasis appears to play a large role in shaping phenotypic variation. However, the differences in rsf1's effect across backgrounds and environments imply that the QTN:QTN interactions might occur only in certain environments or backgrounds. We therefore tested for all possible QTN:QTN interactions across all eight environments and both genetic backgrounds.
To do so, we modeled variation in sporulation efficiency in a standard linear framework using all phenotypic measurements across QTN genotypes, genetic backgrounds, and environments (see Methods). A completely saturated model that incorporates all possible effects and interactions between environment, background, and QTN has an adjusted R2 of 0.99. All of the parameters in the model are controlled variables, so this R2 indicates that 1% of the variation in our experiment is due to experimental error. We then constructed a reduced model that explains most of the variation, but with fewer parameters and only two and three-way interactions (Figure 4, adjusted R2 = 0.963, see Methods). This model (the global model) captures the predominant interactions in the data (Table S3). For example, it contains a significant positive interaction term between galactose and the vineyard background (effect = 25.6±2.4%, t-test P<2e-16). This term is expected given the higher sporulation efficiencies we observe in the vineyard background in galactose (Figure 2C). There are also significant interactions between rsf1 and both exudate (effect = −28±2.8%, t-test P<2e-16) and grape juice (effect = −13.8±2.8%, t-test P = 9e-7), which are expected due to the larger effect of rsf1 in these two conditions (Figure 3).

The most striking result from the global model is the lack of two-way QTN:QTN interactions. Three QTN:QTN interaction terms were left in the model after stepwise regression (Table S3). Only one of these, a negative interaction between rsf1 and ime1_coding (effect = −7.6±1.8%, P = 3.9e-5), passed either Bonferonni correction or permutation testing. This result stands in contrast to what we observe within a single condition. In line with our previous data in glucose [14], we find abundant QTN:QTN interactions when YGlu is modeled alone (Table S4). For example, the rme1:ime1_coding interaction is large (effect = −29.4±2.3%, t-test P<2e-16). However, when all the environments and both backgrounds are analyzed together in the global model, the same rme1:ime1_coding interaction is small and only marginally significant (effect = −3.9±1.6%, t-test P = 0.02).
In the place of QTN:QTN interactions, the global model contains several significant three-way QTN:QTN:environment and QTN:QTN:background interactions. This suggests that significant QTN:QTN interactions cause variation in sporulation efficiency, but the interactions only occur in particular environments and genetic backgrounds. To examine this possibility further, we modeled each environment-background combination separately and observed that QTN:QTN interactions varied widely. For example, the rme1:ime1_coding interaction that is strong in YGlu in the oak strain is marginal in exudate (Figure 5, YGlu effect = −29.4±2.3%, t-test P<2e-16 ; exudate effect = −4.2±2.1% , t-test P = 0.052). This interaction is present in maltose (effect = −29±3.9%, t-test P = 1.6e-8), but not in the vineyard background (Figure 6, effect = 0.00±2.1%, t-test P = 0.23). Taken together, these results show that the vineyard alleles of rme1 and ime1_coding act synergistically in the oak strain and specifically in YGlu and maltose, as the combination of two vineyard QTN produces a larger change in phenotype than could be expected from their individual effects. However, in exudate, or in the vineyard background, the effects of these same QTN alleles remain independent. Therefore, the synergistic interaction between the vineyard alleles is not intrinsic to the alleles themselves, but instead depends upon the specific context of the environment and genetic background.


Our measurements of sporulation efficiency therefore indicate that QTN:QTN interactions are not widespread, but QTN:QTN:environment and QTN:QTN:background interactions are common. In a linear model that ignores genetic background and environment, no interactions between the QTN are significant (adjusted R2 = 0.4). This QTN-only model correctly identifies that individuals with all vineyard alleles tend to sporulate poorly, but it does not provide the ability to accurately predict the phenotypes of individuals with intermediate genotypes (Figure 7). Ultimately, the effects of the QTN and their interactions are shaped by the environmental and genomic context in which they occur. Knowledge of the environment and genetic background is therefore crucial to accurately predict the effects of QTN across individuals (compare Figure 4 to Figure 7).

Discussion
In this set of experiments, we measured sporulation efficiency in a variety of isogenic strains that differed with respect to QTN genotypes, genetic background, and growth environment. Overall, our results show that a complex set of genotype:environment:background interactions shape variation in sporulation efficiency. Our results also shed light on the general effects of environment on sporulation efficiency in the context of natural variation. We found that carbon sources with similar effects on yeast catabolite repression tended to have similar effects on sporulation efficiency. For example, glucose and fructose both cause strong catabolite repression in yeast [21], and their effects on sporulation efficiency are highly correlated (Table 4). Sucrose, a disaccharide composed of glucose and fructose, is likewise highly correlated with glucose. Raffinose and galactose, which cause weaker catabolite repression [22], cluster less closely with glucose. One surprising result is the GxE we observed in maltose relative to glucose (Figure 2B). Since maltose is composed of two glucose molecules, one might expect the effect of maltose to be as similar to glucose as that of sucrose or fructose. One possible explanation for the GxE in maltose arises from the fact that maltose catabolism genes commonly display copy number variation among yeast isolates [23]–[25]. We observed a slow growth phenotype of the oak strain in maltose and mapped this phenotype to the MAL1 multigene locus (K. Lorenz and B. Cohen, unpublished results). We suspect that this locus is responsible for the maltose:background interaction we observe for sporulation efficiency, and it may also modulate the QTN effects and QTN:QTN interactions in maltose, but confirmation of this hypothesis awaits the cloning of the causative polymorphism.
Exudate and grape juice produce lower sporulation efficiencies than the other environments. This result occurs in spite of the fact that exudate is composed of exactly the same ingredients as YGlu, but with reduced concentrations of peptone and yeast extract. This reduction of nutrient concentrations not only reduces sporulation efficiency in both genetic backgrounds, but it also alters the effect of rsf1 in the oak background relative to the other QTN (Figure 3). The fact that exudate consists of the same ingredients as YGlu but produces different effects on sporulation efficiency suggests that QTN effects are shaped not only by nutrient type, but also by nutrient concentrations. Drops in nitrogen concentration are well-known to strengthen the signal to sporulate, so the difference in peptone concentration between exudate and rich media may explain some the differences in sporulation efficiency through nitrogen sensing.
Across multiple environments, the unknown polymorphisms in the genetic background not only interact with the environment but also alter the effects of the known QTN. The known QTN used in this study were mapped in glucose and explain ∼90% of the segregating variation in that condition [14]. The interactions we observe here suggest that the remaining unmapped loci may have stronger effects (and be easier to map) in non-YGlu environments. For example, the known QTN only explain half of the phenotypic difference in the vineyard background in grape juice (Table 3). Presumably, the remaining unknown polymorphisms that regulate sporulation efficiency have larger effects in this environment-background combination than they do in YGlu. An attractive experiment to identify new QTN governing sporulation efficiency would therefore be to map the phenotype in grape juice using a cross of the original oak parent with a new version of the vineyard parent strain that is fixed for all four known oak QTN. It is possible, however, that the new polymorphisms uncovered by this experiment would not reside in the sporulation pathway per se, but would instead be metabolic factors specific to grape juice catabolism.
Despite the fluctuations in QTN effects across environments and backgrounds, the direction of QTN effects remain consistent. Vineyard alleles always decrease sporulation efficiency relative to oak alleles. Without accounting for changes in the environment or differences in genetic background, we can therefore safely predict that a strain with all four vineyard alleles will sporulate poorly relative to a strain carrying all oak alleles. However, because the effect magnitudes of the QTN change across environments and backgrounds, we cannot predict the sporulation efficiency of intermediate allelic combinations (Figure 7). This case reminds us of the situation unfolding in human association studies, where it appears that high-risk individuals can be identified as carriers of collections of disease associated polymorphisms, even though it is more difficult to predict the actual phenotypic outcome of a particular individual with intermediate sets of alleles [26]. In this case of yeast sporulation efficiency, complexity occurs because the relative importance of particular alleles and their interactions are not constant across individuals, but instead vary with the individuals' genetic background and environment.
If context dependencies on allelic effects are common, how can we achieve better predictive power when environment and background are unknown? Environment and genetic background presumably influence the phenotype just as all genetic changes must: through effects on cell physiology. It might be possible to account for the physiological effects of environment and background using a biomarker or physiological indicator that is correlated with, but upstream of, the phenotype of interest. Biochemical markers are used in medicine to inform calculations of disease risk and diagnosis [27]. Inclusion of a physiological marker into the genetic model may condition the model to unknown parameters and therefore increase the accuracy of genotype-phenotype predictions.
Although such a model could improve predictive power, it still does not increase our understanding of how various physiological forces in the cell combine to quantitatively alter phenotype. Perhaps improved understanding could arise from interpreting QTN effects through a framework rooted in cell biology and biochemistry, rather than through an abstract linear model. Biochemical and gene regulatory pathways have long been theorized to naturally generate non-linear effects through the basic thermodynamic properties of proteins and DNA [28], [29]. We have modeled sporulation efficiency in glucose through a thermodynamic framework, and this method shows promise in revealing the molecular basis of genetic interactions [30]. However, thermodynamic modeling requires detailed knowledge of molecular mechanism of the proteins involved, and this information is not available for most traits. Also, the challenge of applying this approach to multiple environments is nontrivial [31].
A more traditional method to deal with statistical interactions is to eliminate them through data transformations. We experimented with a number of scale transformations for our dataset, but found that the best transformation for reducing the complexity of the interaction terms varied from one environment:background combination to the next. Furthermore, data transformations that reduced the number of interaction terms sometimes had undesirable effects, such as increasing the dependence of the variance upon the mean. More importantly, scale transformations that worked well on some subsets of the data still required numerous interaction terms to provide a global model. None of the data transformations we tried improved the three-way interaction fit obtained on the natural scale (Figure S3). Although data transformations may be appropriate to obtain simpler predictive models in single background:environment combinations, they do not account for the non-linear dynamics that create complexity across conditions and backgrounds.
Regardless of the approach taken in the future, our results clearly show that the genetic architecture of sporulation efficiency is environment-dependent. QTN effects cannot be understood without taking into account contextual factors such as the environment's influence on cell physiology. We expect that quantitative biochemical measurements will be required to illuminate what is happening inside the cell and bridge the missing link between genotype and phenotype.
Methods
Experimental Design
Each of the 32 strains were grown for 15 hours in growth media (except for grape juice, in which we instead grew the yeast for 54 hours). After the growth period, we diluted each culture 1∶50 into 1% potassium acetate to induce sporulation. We tested three replicates of each QTN genotype - environment - genetic background combination. One exception is the strain carrying only the ime_nc vineyard QTN allele in the vineyard background grown in sucrose, for which there were only two measurements due to a sample failure. The experimental design is balanced such that the genotype frequencies of the four QTN do not vary across environments or backgrounds, so any significant interactions between QTN reflect physiological effects rather than differences in allele frequency [32]. Sporulation efficiency was calculated by flow cytometry on samples of 15,000 cells per replicate using methods we have described elsewhere [20]. The raw data of sporulation efficiencies for each replicate is available as a supplementary data file (Dataset S1).
Each of the eight environmental treatments was composed of a different growth medium prior to the induction of sporulation in acetate (Table 1). Six of the environments consisted of rich yeast media (1% yeast extract, 2% peptone) supplemented with 2% of a sugar or polysaccharide: glucose, fructose, sucrose, maltose, galactose, or raffinose. The other two environments were synthetic oak exudate and chardonnay grape juice. Synthetic oak exudate is composed of the same nutrients as rich media, but contains yeast extract and peptone at ten-fold reduced concentrations (Table 1). Exudate also contains a mixture of fructose, sucrose, and glucose at a total concentration of 2% [33]. After each environmental treatment, sporulation was induced for 30 hours in 1% potassium acetate, which provides a non-fermentable carbon source but no source of nitrogen.
Strain Construction
First, we created allele replacement strains in each parental background that carry single QTN alleles from the opposite parent [34]. These strains were created by backcrosses of initial haploid ura3− allele replacement transformants with their prototrophic diploid parents. Ura3+ progeny from the backcross of each allele replacement were then intercrossed to generate strains carrying multiple QTN alleles from the opposite parent. Each cross was performed in triplicate. We confirmed after each cross that the QTN co-segregated with variation in sporulation efficiency in glucose, and we also ensured that the phenotypes resulting from replicate crosses were identical. This assured us that no new mutations governing sporulation efficiency had arisen elsewhere in the genome during the crossing scheme. Once a strain with the desired QTN alleles from the opposite parent was created, this strain was backcrossed once more to its original wild type parent strain. Individual homothallic diploid progeny from this final cross were isolated and genotyped until we obtained three replicates of every possible QTN allele combination. Genotyping was based on the restriction digest of PCR amplicons [14]. The selected strains were arrayed in a 96-well plate such that all the strains from both genetic backgrounds can be assayed in a single block.
Non-Parametric Cluster Analysis
We generated a matrix of the Spearman rank correlations of the means of each of the 32 strains across each environment. A distance matrix was then defined as 1−ρ, where ρ is the matrix of pair wise Spearman rank correlations. We carried out hierarchal cluster analysis with the complete linkage clustering method as implemented in the hclust function in the statistical package R. We also split the data by genetic background, then calculated rank correlations and clustered separately for the oak and vineyard genetic backgrounds.
Linear Models
All statistical analyses were performed in R. In all linear models, the strain with all oak QTN alleles was treated as the intercept, so the additive effects represent the effect of a single vineyard QTN placed into a strain with oak QTN alleles at all other loci. We chose this reference point because the oak strain probably best resembles the genotype of the common ancestor of the two parent strains [14], [35]. To compare the effects of QTN:QTN interactions in single environment-background combinations, we created linear models of QTN effects including all possible interaction terms within each condition, and significant coefficients were calculated by t-tests of the coefficient's estimated effect versus its standard error. All interaction terms reported in the text are significant by Bonferonni correction (P = 0.05/N, where N is the number of coefficients in the model).
To analyze QTN effects across all environments and both backgrounds, we constructed a linear model in which the oak genetic background, oak QTN alleles, and the glucose environment are treated as intercepts. Therefore, coefficients in the model represent the effects of the vineyard genetic background, vineyard QTN alleles, and non-glucose environments. The simplest additive model therefore takes the following form:Where EFF is sporulation efficiency, Oak is the oak strain phenotype in glucose (the y-intercept), BG is the effect of genetic background, RME, RSF, IMEC, and IMENC are the effects of the vineyard QTN alleles, ENV is the effect of non-glucose environments, and e represents the error across the multiple replicates of each combination of strain and environmental treatment. Sucrose and fructose were not significantly different from glucose, so these three conditions were pooled into a single treatment. We found that models with increasing levels of interaction terms were often significant, but very little improvement to the fit or explanatory power of the model was gained by adding four-way interactions (Table S5). We therefore limited our analysis to models with three-way interaction terms to reduce saturation without much sacrifice of explanatory power. To select a specific model with a subset of the three-way terms, we used stepwise regression as implemented in the stepAIC function in R. We then took the output from stepwise regression and manually removed terms from the model if their treatment contrast P-values did not pass a model-wide Bonferonni correction. Table S3 displays the coefficients in our final model and the P-values of each coefficient. The significance of the QTN:QTN interactions in this model were also tested by creating 10,000 null linear models from random permutations of the entire dataset. The critical P-value from these permutations was P = 0.016.
Probit and Logit transformations, which are common used for frequency data, provide good fits with fewer interaction terms in some individual conditions. However, we chose to model the data on the raw scale. The Probit and Logit transformations obtain a fit by weighting the explanatory power at extremely high and low values of sporulation efficiency at the expense of intermediate values (Figure S3). For example, under the Probit transformation, a difference in sporulation efficiency from 1% to 2% is as great in magnitude as a raw difference of 40% to 50%. No transformation eliminated interactions altogether, and transformations did not improve the overall fit of the model across multiple environments. The raw scale allows more intuitive interpretation of the model coefficients, and our reduced model performs well on values of sporulation efficiency between ∼5 and 95%. Some extreme values are fit below zero or above 100%. However, with one exception (a data point at 92%), all data points fitted to higher than 100% have actual values greater than 96%. All data points predicted to be below zero have actual values less than 5%. We therefore simply bounded all predicted values between 0% and 100%.
To model the specific QTN:environment interactions in exudate and grape juice, we conducted an analysis of variance on only the additive effects (no QTN:QTN interactions) of the four vineyard QTN separately in each genetic background. This model focused on the additive effects because the phenotypes of vineyard background strains carrying multiple vineyard QTL approach zero in a non-linear fashion (Tables S1, S2). The model took the form:Where EFF is sporulation efficiency, GEN is the genotype across the four QTN alleles, ENV is the environment, and e is the error. To confirm significant differences in the rank order of QTN effects in different environments, we took the estimated QTN effects from an analysis of variance in each environment separately and computed Tukey's Honest Significant Difference to determine the rank-order of the QTN within each environment. The reported P value is the largest adjusted P value among all the possible comparisons between the effect of rsf1 and the effects of other QTN.
Supporting Information
Zdroje
1. UngererMC
HalldorsdottirSS
PuruggananMD
MackayTFC
2003 Genotype-environment interactions at quantitative trait loci affecting inflorescence development in Arabidopsis thaliana. Genetics 165 353 365
2. SmithEN
KruglyakL
2008 Gene-environment interaction in yeast gene expression. PLoS Biol 6 e83 doi:10.1371/journal.pbio.0060083
3. GurganusMC
FryJD
NuzhdinSV
PasyukovaEG
LymanRF
1998 Genotype-environment interaction at quantitative trait loci affecting sensory bristle number in Drosophila melanogaster. Genetics 149 1883 1898
4. LillehammerM
GoddardM
NilsenH
2008 Quantitative Trait Locus-by-Environment Interaction for Milk Yield Traits on Bos taurus Autosome 6. Genetics 179 1539 1546
5. YaffeK
HaanM
ByersA
TangenC
KullerL
2000 Estrogen use, APOE, and cognitive decline: evidence of gene-environment interaction. Neurology 54 1949 1954
6. SteinerCC
WeberJN
HoekstraHE
2007 Adaptive variation in beach mice produced by two interacting pigmentation genes. PLoS Biol 5 e219 doi:10.1371/journal.pbio.0050219
7. BridghamJT
OrtlundEA
ThorntonJW
2009 An epistatic ratchet constrains the direction of glucocorticoid receptor evolution. Nature 461 515 519
8. ThreadgillDW
DlugoszAA
HansenLA
TennenbaumT
LichtiU
1995 Targeted disruption of mouse EGF receptor: effect of genetic background on mutant phenotype. Science 269 230 234
9. FlintJ
MackayTFC
2009 Genetic architecture of quantitative traits in mice, flies, and humans. Genome research 19 723 733
10. CarlborgO
HaleyCS
2004 Epistasis: too often neglected in complex trait studies? Nat Rev Genet 5 618 625
11. EshedY
ZamirD
1996 Less-than-additive epistatic interactions of quantitative trait loci in tomato. Genetics 143 1807 1817
12. CaicedoAL
StinchcombeJR
OlsenKM
SchmittJ
PuruggananMD
2004 Epistatic interaction between Arabidopsis FRI and FLC flowering time genes generates a latitudinal cline in a life history trait. Proc Natl Acad Sci U S A 101 15670 15675
13. DeutschbauerAM
DavisRW
2005 Quantitative trait loci mapped to single-nucleotide resolution in yeast. Nat Genet 37 1333 1340
14. GerkeJ
LorenzK
CohenB
2009 Genetic interactions between transcription factors cause natural variation in yeast. Science 323 498 501
15. HonigbergSM
PurnapatreK
2003 Signal pathway integration in the switch from the mitotic cell cycle to meiosis in yeast. J Cell Sci 116 2137 2147
16. LuL
RobertsG
SimonK
YuJ
HudsonAP
2003 Rsf1p, a protein required for respiratory growth of Saccharomyces cerevisiae. Curr Genet 43 263 272
17. KassirY
GranotD
SimchenG
1988 IME1, a positive regulator gene of meiosis in S. cerevisiae. Cell 52 853 862
18. MitchellAP
HerskowitzI
1986 Activation of meiosis and sporulation by repression of the RME1 product in yeast. Nature 319 738 742
19. CovitzPA
MitchellAP
1993 Repression by the yeast meiotic inhibitor RME1. Genes Dev 7 1598 1608
20. GerkeJP
ChenCTL
CohenBA
2006 Natural isolates of Saccharomyces cerevisiae display complex genetic variation in sporulation efficiency. Genetics 174 985 997
21. JohnstonM
1999 Feasting, fasting and fermenting. Glucose sensing in yeast and other cells. Trends Genet 15 29 33
22. JohnstonM
FlickJS
PextonT
1994 Multiple mechanisms provide rapid and stringent glucose repression of GAL gene expression in Saccharomyces cerevisiae. Mol Cell Biol 14 3834 3841
23. DunnB
LevineRP
SherlockG
2005 Microarray karyotyping of commercial wine yeast strains reveals shared, as well as unique, genomic signatures. BMC Genomics 6 53
24. CarretoL
EirizMF
GomesAC
PereiraPM
SchullerD
2008 Comparative genomics of wild type yeast strains unveils important genome diversity. BMC Genomics 9 524
25. CharronMJ
DubinRA
MichelsCA
1986 Structural and functional analysis of the MAL1 locus of Saccharomyces cerevisiae. Mol Cell Biol 6 3891 3899
26. ManolioTA
CollinsFS
CoxNJ
GoldsteinDB
HindorffLA
2009 Finding the missing heritability of complex diseases. Nature 461 747 753
27. WilsonPW
D'AgostinoRB
LevyD
BelangerAM
SilbershatzH
1998 Prediction of coronary heart disease using risk factor categories. Circulation 97 1837 1847
28. KacserH
BurnsJA
1981 The molecular basis of dominance. Genetics 97 639 666
29. GibsonG
1996 Epistasis and pleiotropy as natural properties of transcriptional regulation. Theoretical population biology 49 58 89
30. GertzJ
GerkeJP
CohenBA
2010 Epistasis in a quantitative trait captured by a molecular model of transcription factor interactions. Theoretical population biology 77 1 5
31. GertzJ
CohenBA
2009 Environment-specific combinatorial cis-regulation in synthetic promoters. Mol Syst Biol 5 244
32. CheverudJM
RoutmanEJ
1995 Epistasis and its contribution to genetic variance components. Genetics 139 1455 1461
33. MurphyHA
KuehneHA
FrancisCA
SniegowskiPD
2006 Mate choice assays and mating propensity differences in natural yeast populations. Biol Lett 2 553 556
34. StoriciF
LewisLK
ResnickMA
2001 In vivo site-directed mutagenesis using oligonucleotides. Nat Biotechnol 19 773 776
35. WillJL
KimHS
ClarkeJ
PainterJC
FayJC
2010 Incipient balancing selection through adaptive loss of aquaporins in natural Saccharomyces cerevisiae populations. PLoS Genet 6 e1000893 doi:10.1371/journal.pgen.1000893
Štítky
Genetika Reprodukční medicínaČlánek vyšel v časopise
PLOS Genetics
2010 Číslo 9
Nejčtenější v tomto čísle
- Synthesizing and Salvaging NAD: Lessons Learned from
- Optimal Strategy for Competence Differentiation in Bacteria
- Long- and Short-Term Selective Forces on Malaria Parasite Genomes
- Identifying Signatures of Natural Selection in Tibetan and Andean Populations Using Dense Genome Scan Data