
Long- and Short-Term Selective Forces on Malaria Parasite Genomes
Plasmodium parasites, the causal agents of malaria, result in more than 1 million deaths annually. Plasmodium are unicellular eukaryotes with small ∼23 Mb genomes encoding ∼5200 protein-coding genes. The protein-coding genes comprise about half of these genomes. Although evolutionary processes have a significant impact on malaria control, the selective pressures within Plasmodium genomes are poorly understood, particularly in the non-protein-coding portion of the genome. We use evolutionary methods to describe selective processes in both the coding and non-coding regions of these genomes. Based on genome alignments of seven Plasmodium species, we show that protein-coding, intergenic and intronic regions are all subject to purifying selection and we identify 670 conserved non-genic elements. We then use genome-wide polymorphism data from P. falciparum to describe short-term selective processes in this species and identify some candidate genes for balancing (diversifying) selection. Our analyses suggest that there are many functional elements in the non-genic regions of these genomes and that adaptive evolution has occurred more frequently in the protein-coding regions of the genome.
Published in the journal:
. PLoS Genet 6(9): e32767. doi:10.1371/journal.pgen.1001099
Category:
Research Article
doi:
https://doi.org/10.1371/journal.pgen.1001099
Summary
Plasmodium parasites, the causal agents of malaria, result in more than 1 million deaths annually. Plasmodium are unicellular eukaryotes with small ∼23 Mb genomes encoding ∼5200 protein-coding genes. The protein-coding genes comprise about half of these genomes. Although evolutionary processes have a significant impact on malaria control, the selective pressures within Plasmodium genomes are poorly understood, particularly in the non-protein-coding portion of the genome. We use evolutionary methods to describe selective processes in both the coding and non-coding regions of these genomes. Based on genome alignments of seven Plasmodium species, we show that protein-coding, intergenic and intronic regions are all subject to purifying selection and we identify 670 conserved non-genic elements. We then use genome-wide polymorphism data from P. falciparum to describe short-term selective processes in this species and identify some candidate genes for balancing (diversifying) selection. Our analyses suggest that there are many functional elements in the non-genic regions of these genomes and that adaptive evolution has occurred more frequently in the protein-coding regions of the genome.
Introduction
Half of the world's population is at risk of contracting malaria from Plasmodium species [1], so an understanding of their biology has considerable potential to influence human health. An understanding of evolution and natural selection are particularly important, because malaria control is limited by the evolution of resistance to anti-malarial drugs [2]–[5] and high levels of genetic variation in parasite surface proteins, which hinder natural and vaccine-induced immunity [6], [7]. An understanding of selection in these genomes can also contribute to our understanding of their function. For example, intronic and intergenic regions have been shown to be more conserved than neutrally evolving sites [8], [9], suggesting that purifying selection has been acting to conserve functional elements in non-genic regions of the genomes.
In this study we describe selection in Plasmodium genomes over the long term using alignments of the genomes of seven Plasmodium species, showing that there is considerable constraint outside protein-coding regions and identifying 670 non-genic conserved elements. We describe selection in the short term using genome-wide polymorphism data from 13 strains of P. falciparum. This analysis suggested that protein-coding exons were more likely to be subject to non-neutral (adaptive) than non-genic regions.
Results
Long-term selective forces in seven Plasmodium species
Global levels of selective constraints in Plasmodium genomes
We first sought to gain an overview of purifying selection in Plasmodium genomes, because regions of the genome that are subject to purifying selection are likely to contain functional elements. The action of purifying selection can be detected and quantified by estimating the ‘selective constraint’, the proportion of nucleotide substitutions that have been removed by purifying selection [10]. In practice, selective constraint is estimated as the rate of divergence of a region relative to a set of selectively unconstrained sites [11], [12].
We used exon-anchored genome alignments of the six available assembled genomes, adding a predicted P. reichenowi genome by assuming synteny with P. falciparum (data used are summarised in Figure 1A) to estimate divergence in the alignable portions of Plasmodium genomes. To ensure robust results despite differences in GC content (Figure 1), we used both a simple model (HKY85 [13]) and a more parameter-rich non-time reversible model. Each model was optimised on three different selections of the alignment (see Materials and Methods), resulting in a total of six optimised substitution models. We then estimated the divergence in the entire alignment, protein-coding exons, introns, intergenic regions, and four-fold degenerate (FFD) codon positions. FFD sites were the most divergent (Table S1), consistent with the expectation that these sites are relatively free to vary without affecting the protein coding sequence. Accordingly, we use FFD sites as proxy for sites that are selectively unconstrained.

We then estimated constraint within each region as
Where Cx is constraint within a region x, Dx is divergence within this region and DFFD is divergence within four-fold degenerate coding sites. We found that overall constraint of the alignments is 0.59–0.60, and that constraint estimates were consistent across all substitution models (Figure 2A, Table S1). As expected, the most constrained regions were exons (0.70–0.72 constraint), but intergenic regions and introns also showed high levels of constraint, 0.50–0.51 and 0.40–0.41 respectively, indicating that a large fraction of the non-protein coding genome contains functional elements. A similar pattern of constraint was observed with independent constraint estimates within each of the three mains clades (Figure S1). These estimates only apply to the alignable parts of the genomes, so will exclude genes and gene families that are restricted to one species (such as the variant surface antigens Var, Kir etc.) [14]–[16], and any other highly divergent regions that are not aligned. Differences in alignment between intergenic and exonic regions complicate the interpretation of relative levels of constraint in exons vs. other genomic regions. However, by examining how many intergenic, exonic and intronic sites were well aligned (aligned in at least four species) and multiplying this number by the constraint, we estimate that there are approximately ∼4,700 kb constrained exonic sites in the P. falciparum genome compared to ∼1,300 kb of constrained intergenic sites (Text S1, Table S2).

Finally, position-by-position analysis of constraint near exon starts and ends showed that intron constraint was strongest within 10 nt of exon boundaries, presumably corresponding to splice motifs, but otherwise intronic and intergenic constraint showed only modest variation with increasing distance from gene boundaries (Figure 2B). This suggests that functional elements are distributed throughout these regions.
Conserved Elements in Plasmodium genomes
To assess the functional implications of the constrained sites that reside outside known protein-coding regions, we identified clusters of constrained sites using the genomic evolutionary rate profiling method (GERP) [17]. This algorithm identifies windows of an alignment where the evolutionary rate is significantly slower than the neutral rate. GERP identified 27,575 such conserved elements (CEs), with 10% false discovery rate (FDR). Single nucleotide polymorphism (SNP) data generated from P. falciparum (see below) confirmed that these conserved elements were subject to purifying selection within this species, showing that they were not artifacts of ‘mutational cold-spots’ (Text S1). Estimated selective constraints in CE regions were high; 0.78 in exonic CEs, 0.73 intergenic CEs and 0.70 in intronic CEs (Table S3), confirming that some intergenic elements are as conserved as exons.
Since false discovery rates were higher for elements <25 nt long (Figure S2), and short elements proved to contain too little information to characterise in silico, all further analysis and discussion was restricted to the 17,949 CEs ≥25 nt long. The majority of these longer CEs (96%) were at least partially exonic (overlapped annotated protein-coding exons in at least one of P. falciparum, P. knowlesi or P. yoelii), 70% overlap exon annotations in all three species (Table 1).

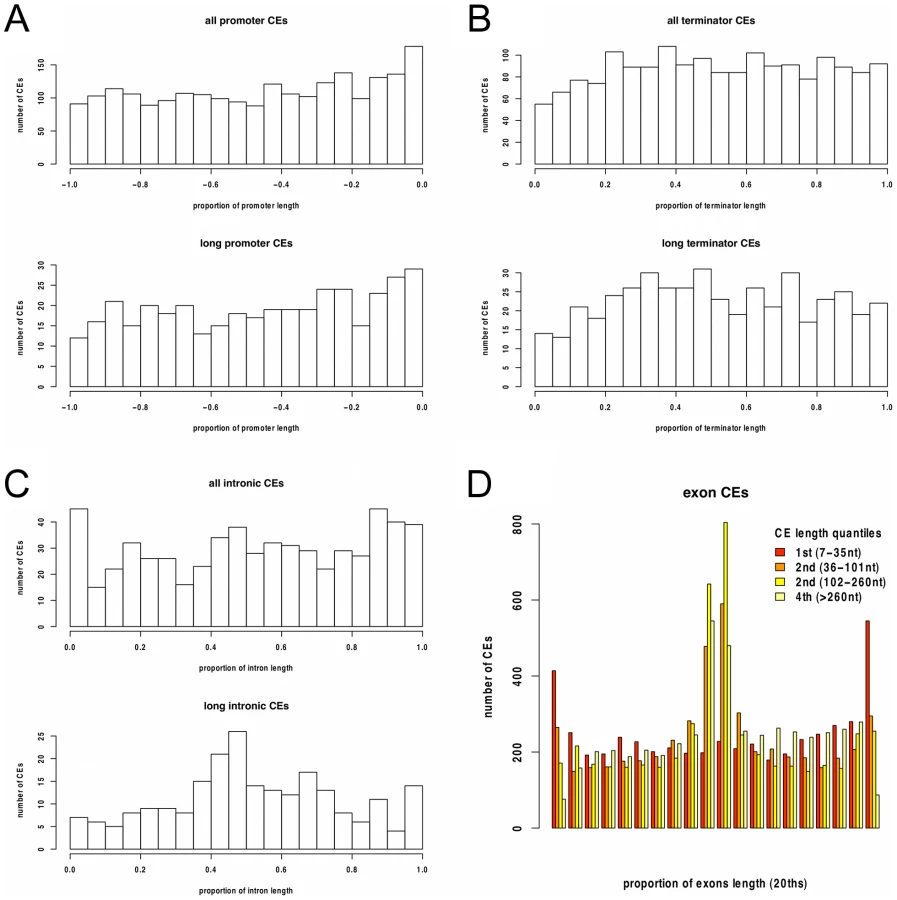
While the majority of the CEs were protein-coding exons, 670 of these longer non-exonic conserved elements did not overlap exon annotations in either P. falciparum, P. knowlesi or P. yoelli. These CEs were relatively evenly distributed throughout intergenic and intronic regions (Figure 3), consistent with the analysis of selective constraint. This shows that functional elements are equally likely to be located close to, or distant from protein-coding genes.
Function of Conserved Elements
To assess the possibility that some of the 670 non-exonic CEs are un-annotated protein-coding exons, we first examined substitution patterns within CE alignments. Exons are expected to have an excess of substitutions in synonymous sites. Because synonymous sites are usually at third codon positions, this excess can be observed as a bias in substitutions separated by multiples of three nucleotides compared to shuffled alignments (Figure 4A, top). For the non-exonic CEs this bias is very slight (Figure 4A, bottom), consistent with their being largely non-protein-coding. This was confirmed by comparing the proportion of multiple-of-three-spaced substitutions between non-exonic CEs, length-matched exonic controls, and shuffled alignments (Figure 4B).

Further analysis of the 670 non-exonic conserved elements was consistent with only a minority being un-annotated exons. First, analysis of the similarity of CEs to the genomes of related Alveolates using translated blast searches (tblastx) showed that non-exonic CEs had significantly lower blast bit scores than exonic CEs (Text S1, Table S4). Secondly, analysis of expression levels using RNA-Seq data from a recent study of P. falciparum [18], suggested that these elements were not more highly expressed than expected of intronic or intergenic regions of the genome. Finally, manual scrutiny of 20 non-exonic elements in the context of the P. falciparum DNA sequence, gene annotation and RNA-Seq data suggested that only 25% were possible protein-coding exons (see Text S1 for details of both analyses).
Since only a few of the non-exonic CEs appear to encode proteins, another possibility is that they encode structured, non-protein-coding RNAs (ncRNAs). Only 239 of the 16,649 CEs in P. falciparum (1.4%) overlap previously discovered ncRNAs [19], [20], including exonic antisense ncRNAs. However it is possible that there are many more, as yet undiscovered ncRNAs in these genomes. To investigate this we scored each CE with the structural RNA predictor RNAz [21], controlling for false positives by comparing to scores for simulated alignments, generated using SISSIz [22]. The RNAz algorithm predicted significantly higher support vector probabilities (the probability that an element is a ncRNA) for both exonic CEs and non-exonic CEs than for the simulated alignments (Mann-Whitney tests, P<2.2×10⁻¹⁶ and P = 1.70×10⁻⁷), indicating that some encode genuine structural RNAs. Using the conservative threshold of RNAz support vector probability >0.95, and taking the false discovery rate into account, we estimate that 644 of the exonic and 22 non-exonic CEs encode a structured ncRNA (more detail is provided in Text S1). Since only 239 of our CEs overlap known ncRNAs, this suggests that there are many more structured RNAs that remain to be discovered, particularly within protein-coding exons.
Short-term selective forces in P. falciparum
The analysis of the divergence between distantly related species facilitates analysis of purifying selection (constraint). However, there are several types of selection acting simultaneously on genomes that are less well described from this data, particularly in non-genic regions that are difficult to align between highly divergent species. Firstly, adaptive (or directional) evolution, which acts to change the nucleotide sequence from its ancestral state [23]. There is also evidence that a few genes are subject to balancing selection, which acts to maintain multiple alleles (different versions of a gene) in a population [24]. Frequency-dependent balancing selection, where rare alleles have a selective advantage, is thought to be particularly important in Plasmodium genes encoding surface-exposed proteins that are targets of acquired immunity [25]–[29].
To examine these types of selection, we generated genome-wide genetic diversity (polymorphism) data from thirteen P. falciparum isolates (strains) and the divergence between P. falciparum and the chimpanzee parasite P. reichenowi, using publicly available ABI capillary reads (Table S5, NCBI dbSNP accessions: ss# 159747249–159815961). We called 69,805 SNPs within P. falciparum and 190,631 fixed differences between P. falciparum and P. reichenowi. We were able to obtain a coarse minor allele frequency (MAF) estimate for 54,641 SNPs and a derived allele frequency estimate for 24,573 SNPs (see Materials and Methods). See Table S6 for further summary statistics.
Purifying selection is consistent in the medium and short term
We expect the degree of purifying selection acting on most genes to be relatively consistent over evolutionary time. The synonymous/non-synonymous rate ratio (dN/dS) provides an estimate of purifying selection between two species [23], and has been calculated for P. reichenowi - P. falciparum [9], which are thought have diverged approximately 6 million years ago [30]. Since these two species diverged relatively recently, this measure gives an indication of constraint over the medium term. As an estimate of the constraint over the short term within P. falciparum, we calculated the median derived allele frequency (DAF) for each gene with at least fifteen DAF calls, and compared these to the corresponding dN/dS values. Genes that are subject to strong purifying selection will be expected to have lower median DAF and lower dN/dS. As expected, the median DAF and dN/dS showed a weak but significant correlation (Spearman rank P = 2.03×10⁻⁴, r = 0.16), confirming that constraint is generally consistent. We also found that the extent of purifying selection within P. falciparum (using DAF) was weakly correlated with long term constraint (from the seven-species alignment) in exonic and intergenic regions (Text S1).
Recent selection within the P. falciparum genome
Our analysis of divergence between species showed that exons are subject to more extensive purifying selection than introns or intergenic regions. Given this, we expect to observe the same selection within species. Purifying selection within species can be detected by an excess of rare alleles, relative to some control [23]. Consistent with this expectation, we observed a significant shift to low minor allele frequencies (MAF) in P. falciparum exons relative to intergenic regions (one-sided Mann-Whitney test P = 1.4×10⁻⁴). No other comparisons of allele frequencies between exons, introns or intergenic regions were significant (Table S7).
We would also expect greater purifying selection acting on non-synonymous sites, relative to four-fold degenerate (FFD) sites, because the latter do not alter the protein sequence and will therefore contribute less to the phenotypes that are subject to purifying selection. However, this is not what we observe. Non-synonymous SNPs show an excess of higher derived allele frequencies (non-synonymous vs. FFD, DAF P = 7.7×10⁻³, MAF P = 0.065 (ns)). The fact that this pattern is significant in the genome-wide test suggests that many non-synonymous sites have been subject to adaptive or balancing selection.
Such non-neutral (adaptive or balancing) selection may be due to selection to evade the human immune response. Three gene families, Var, Rifin and Stevor, encode parasite proteins that are believed to dominate the human immune response to P. falciparum [14]–[16]. Consistent with this expectation, we find that exonic sites in Var, Rifin and Stevor genes have a significant excess of high frequency alleles compared to intergenic sites (Var gene exon MAF vs. Var gene intergenic MAF, P = 7.38×10⁻¹⁰, see Table S7). This is in contrast to the genome as a whole; genome-wide, exon MAF is significantly less than intergenic MAF. As a result, it is possible that these genes are responsible for the unexpected excess of non-synonymous SNPs. However, the excess of high frequency derived alleles (DAF) in non-synonymous sites compared to four-fold degenerate sites remains significant after removing these genes from our analysis (P = 3.1×10⁻³), suggesting that many other genes in the genome are subject to adaptive or balancing selection.
To analyse this further we examined allele frequencies using a GO-Slim gene ontology categorization of genes consisting of 23 broad biological categories [9]. We compared allele frequency estimates (MAF and DAF) for all SNPs within each GO-Slim category to all other SNPs. Categories that showed an excess of rare alleles (indicating strong purifying selection) were nucleic acid metabolism, regulation of cellular physiological process, amino acid and derivative metabolism, cell organization and biogenesis and protein metabolism. In contrast, SNPs in cell communication, adhesion to host, and avoidance of host defenses (which all contain overlapping sets of genes) showed an excess of high minor allele frequencies consistent with less constraint and/or adaptive or balancing selection (see Table S8). This GO analysis is consistent with a previous analysis using dN/dS [9].
Signals of adaptive or balancing selection
To investigate adaptive (directional) selection further, we examined whether adaptive evolution between P. falciparum and the chimpanzee parasite P. reichenowi had occurred predominantly in exons. We used the McDonald-Kreitman test [31] which can quantify the proportion of substitutions (α) that have been fixed due to adaptive evolution in coding sites and non-coding sites [32], [33]. We estimate that α = 0.41 in non-synonymous sites (95% confidence interval 0.39–0.45), 0.10 in intergenic regions (0.04–0.15), and 0.11 in introns (−0.07–0.28). Results were the same when we excluded Var, Rifin and Stevor genes. To obtain an estimate of the number of adaptive changes, we multiply McDonald-Kreitman test α estimates by the total number of fixed differences between P. falciparum and P. reichenowi. We observe 77,275 fixed non-synonymous differences in exons, hence our estimate is that 30,910 adaptive chances have occurred (77,275×0.4). Similarly, we estimate that 3,517 adaptive changes have occurred in intergenic regions and 1,102 in introns (35173×0.1 and 11025×0.1 respectively). Hence, we estimate that the majority of the adaptive substitution events have occurred in the protein-coding exons of P. falciparum.
Candidate genes subject to balancing selection
There is considerable interest in identifying Plasmodium genes that show signs of balancing selection, because such genes may be the targets of the human acquired immune response and therefore be vaccine candidates [34]. To investigate which genes are the most likely to be subject to balancing selection, we used two independent tests of the data, Tajima's D and the neutrality index (NI) from the McDonald-Kreitman test, both of which are thought to be suitable tests for balancing selection [35], [36]. Since these are orthogonal tests for balancing selection (they use independent properties of the data), genes that have high ranks in both these statistics are good candidates for balancing selection. There were 591 genes for which we can calculate NI and D. Importantly, because of the stringency of the read alignment method that we used to identify SNPs, the variant surface antigen (Var) genes are generally not well covered by this analysis.
To establish a list of suitable candidates, we selected those genes that have both NI values greater the 80th percentile of NI and D greater the 80th percentile of D values (19 genes, Table 2, Figure 5). The fact that there are less genes above both 80th percentiles than we expect by chance (expect 0.2×0.2×591 = 24), suggests that diversifying selection is not common in P. falciparum. This candidate list includes AMA1 which is highly polymorphic in many populations due to diversifying selection and currently a leading vaccine candidate [25], [37], [38]. Rhoph3, a rhoptry protein triggering immune responses in patients from endemic regions is also in our candidate list [39], as are several candidates with functions suggestive of host-parasite interactions. This suggests that this set of genes is enriched for genes that are subject to diversifying selection. Mu et al. [29] also defined a candidate list of highly polymorphic genes that they suggest will be potential immune or drug targets, two genes are present in both lists (AMA1, and MAL7P1.66, a mitochondrial ribosomal protein S5 precursor).


Discussion
While molecular assays identify considerable activity (transcription, methylation, transcription-factor binding) in the non-genic regions of eukaryote genomes, it is not always clear to which extent these are functional. For example, a principle finding of the ENCODE project was that many ‘active’ genome regions (transcribed, or bound by proteins) were not conserved between species [40]. Studies of selective constraint in eukaryote genomes without reference to the ‘activity’ of the genomic region, though not without their caveats, provide an alternative view of which genomic regions are most important for the function of the genome. Intergenic constraints of 0.05–0.15 have been estimated in the human genome [41], [42], between 0.03 and 0.49 in Drosophila (depending on the method) [10], [33], and 0.18 in Caenorhabditis nematodes [43]. From a recent study of divergence between Saccharomyces yeasts [44], we can obtain an estimate of 0.53 for constraint in budding yeast (Constraint = 1−(intergenic divergence/synonymous divergence)). Our estimate of constraint in intergenic regions (0.5) is similar to yeast. This conclusion is consistent with the variety of putative non-genic functional elements have been predicted in Plasmodium genomes [45]–[51]. All these analyses illustrate that there is much to be discovered about the function of even small eukaryote genomes.
We suspect that the current analysis has detected only a minority of the non-genic conserved elements in these genomes. While 2,611 kb of the P. falciparum genome is aligned to at least three other species, the total length of all the intergenic conserved elements we identified was only 25 kb. This is probably due to methodological limitations as well as to biological factors. Since our alignment was exon-anchored, it is possible that conserved elements that are distant from exons will not be well aligned. While 42% of exon-annotated columns are well aligned (aligned with 4 species), this only holds for 24% of intergenic-annotated columns (Figure S3). Some functional intergenic elements, such as transcription factor binding sites, will be inherently difficult to discover with GERP, or any alignment-based method [17], because they are short and may not be positionally conserved [52].
Both divergence data from Plasmodium species and the excess of rare minor alleles (MAF) in exons indicated that exons are subject to more constraint than introns or intergenic regions. However, consistent with a previous study [53], our data shows an excess of high frequency derived alleles in non-synonymous sites compared to four-fold degenerate sites. Since our allele frequency estimates are derived from a sample of parasites collected from several populations (Table S5), this could be due either to balancing, or else to differential directional selection between populations. Since there is no significant correlation between the by-gene estimates of the McDonald Kreitman test neutrality index and D (Spearman rank P = 0.31, r = 0.04), the high D values do not appear to be generally caused by balancing selection. The more likely explanation is that there are differential selective pressures between the populations. This is analogous to differences in non-synonymous allele frequencies in African and European human populations, where the explanation is that populations that have smaller ancestral population sizes have reduced efficacy of purifying selection [54]. Consistent with this, Neafsey et al. [53] found that non-synonymous sites are more differentiated (have higher FST) between continents than synonymous sites.
Our estimates of the proportion of substitutions fixed by adaptive evolution (a, exons 0.4, introns 0.1, intergenic 0.09) is consistent with exons being the most frequent genomic location of positive selection. These estimates are broadly similar to the estimates for Drosophila in which exon, intron, intergenic estimates were 0.45, 0.19, 0.15 respectively [33], though estimates vary depending on the method [55]. However, it has been shown that artifactual estimates of α can be generated when there has been an increase in population size and weakly deleterious synonymous mutations have been fixed [56]. Both the existence of weakly deleterious synonymous codons [57] and an increase in population size [58], [59] are likely for P. falciparum, so we should regard the absolute value of our estimates with caution.
Conclusion
In summary, we show that there is considerable constraint in intergenic regions and introns. We identify 670 conserved non-genic elements and our analysis suggest that only a minority of these are un-annotated protein-coding exons, or structured ncRNAs. We suspect that many more functional non-genic elements remain undiscovered. Our analysis is consistent with the majority of non-neutral (directional or balancing) selection events having occurred in P. falciparum exons. Genetic diversity data collected from within populations and divergence data from more closely related Plasmodium species, both of which will soon be available, will be required to confirm this prediction.
Materials and Methods
Genome data
The following genome versions were used for the alignment:
P. falciparum version 2.1.4, July 2007, from ftp://ftp.sanger.ac.uk/pub/pathogens/Plasmodium/falciparum/3D7/3D7.version2.1.4
Plasmodium knowlesi version PK4, October 2007, from ftp://ftp.sanger.ac.uk/pub/pathogens/P_knowlesi/Archive/PK4.annotation/
Plasmodium vivax is as published in Carlton et al. [60], with ordered and orientated contigs in pseudo-chromosomes. Because many of the subtelomeric contigs could not be assigned to the pseudo-chromosomes, they are not present. However, these contigs are extremely AT-rich and contain mainly Vir genes, and so they do not align with chromosome regions of other Plasmodium species. Pseudo-chromosomes and annotation are available upon request.
Plasmodium berghei, obtained April 2007, from ftp://ftp.sanger.ac.uk/pub/pathogens/Plasmodium/berghei/
Plasmodium chabaudi, obtained April 2007, from
ftp://ftp.sanger.ac.uk/pub/pathogens/Plasmodium/chabaudi/
Plasmodium yoelii, PlasmoDB version 5.4, from
http://www.plasmodb.org/common/downloads/release-5.4/Pyoelii/
Plasmodium reichenowi
A predicted Plasmodium reichenowi genome was created by aligning 78,442 P. reichenowi ABI capillary reads to the P. falciparum genome with SSAHA2, as described previously [9]. Fixed differences were discovered with a minimum phred score of 25. Deletions in the P. reichenowi sequence were identified, requiring at least two read alignments identifying an identical deletion before we accepted it. Insertions in P. reichenowi could not be included without manipulating the overall alignment. We then assumed that P. reichenowi was identical to P. falciparum except in locations of fixed differences or deletions in the P. reichenowi sequence. We excluded regions of the genome that were non-unique (as described below for SNPs) or lacked read coverage.
Alignments
The six assembled genomes were repeat masked using Repeat Masker Open-3.0, from http://www.repeatmasker.org, then aligned in two phases. The first phase was synteny mapping. Sub-sequences of the genomes were grouped into syntenic blocks. Each of the six genomes contributed at most one subsequence to a given block, and each block contained sequence from at least two species. Then, in the second phase, a nucleotide-level multiple alignment was constructed within each block.
The synteny map was generated using Mercator [61]. Mercator requires anchor sequences along each genome. In addition, for each anchor, one must specify which anchors on other genomes are strongly similar. We chose as anchors the known and predicted exons in each genome, with the annotations obtained as described. Two anchors, each from a different genome, were deemed similar if the BLAT [62] score of the pair was below 1×10−50. The BLAT scores were computed in protein space. Mercator used the anchors and BLAT-similar pairs in a modified k-way reciprocal best hit algorithm [63]. The non-draft genome sequences (P. falciparum, P. knowlesi, and P. vivax) served as scaffolds for the draft species. The result was 170 syntenic blocks. The largest blocks covered parts of all six species and contained entire chromosomes from some of them, while the smallest contained small fragments of just two species. Mercator also produced alignment constraints for each block.
A nucleotide-level multiple alignment within each block was generated with MAVID [64], using the alignment constraints as well as a phylogenetic tree relating the six species. Branch lengths for the tree were estimated with PAML [65], fixing the known topology for these Plasmodium species. Working upwards from the leaves, MAVID associates to each branch node a maximum-likelihood alignment of the sequences in the subtree rooted at that node. The alignment at the root of the full tree is a multiple alignment of all the input sequences. The accuracy and coverage of both the syntenic map and the block alignments were validated manually according to various descriptive statistics.
The predicted P. reichenowi genome was then added to the alignment assuming complete synteny with P. falciparum.
Divergence and selective constraint
Alignment sites corresponding to exon, intron, and intergenic categories were extracted based on the annotation for P. falciparum, P. knowlesi and P. yoelii (one species from each of the three main clades), requiring identical annotation in all three species. For calculations of constraint we used two different models: The HKY85 model [13], with transition and transversion rates estimated globally for the whole tree, and a non-time reversible 12 parameter model (Nonrev), with all substitution parameters estimated individually for each of the three main branches in the tree (for a total of 36 substitution rates). To further ensure robustness we estimated the model parameters from three different data sets: A) The full alignment (representing overall selective pressures), B) introns, intergenic, and FFD sites (high divergence and AT content), and C) exons (lower divergence and AT content). Model parameters and branch lengths for the topology shown in Figure 1A were estimated with the maximum likelihood based package Hyphy [66].
The resulting six parameterized models were then used to estimate branch lengths based on the full alignment. Branch lengths for the different genomic regions (exon, intergenic, intron, FFD) were then estimated with each model as scalings of the full alignment tree (the relative divergence over all branches of the tree), by keeping the relative branch lengths within the tree fixed. Relative constraint for each region was calculated as , as described in the text.
Variance of the constraint estimates was evaluated by 200 bootstrap replicates of alignment columns, with replacement. This variance is shown as error bars in Figure 2A, for each of the six models, and for each of the four categories (full alignment, exon, intergenic, intron). This measures the statistical variation of the constraint estimates, but does not address the biological variation. The latter is difficult to assess in a meaningful way, due to variation in neutral rate across the genome (Figure S4). The precision of estimates of neutral rate in specific regions of the alignment is limited by the relative scarcity of FFD sites, meaning that for smaller, biologically relevant window sizes, e.g. 20 kb, the neutral rate estimates will be highly variant (or non-existent) due to small FFD sample size, leading to uninformative constraint estimates.
To estimate the constraint near gene and exon boundaries, we extracted alignment columns upstream of start codons (termed promoters), downstream of stop codons (terminators) and between exons (introns). In each case, we extracted a region corresponding to one third of the observed median length of the given feature. Introns were then further divided into donors (5′) and acceptors (3′).
To reduce the effect of mis-annotations, we required all species to be present in the alignment, and identical, overlapping annotation features in all the six species for which annotation exists. When the exact boundaries for a feature on the alignment varied in different species' annotation, we chose the maximum start and minimum stop positions (shortest consensus). Results were very similar when we used the longest consensus (minimum start, maximum stop), a comparison can be seen in Figure S5.
To examine whether divergence estimates from Plasmodium species alignments was negatively correlated with DAF, we located each SNP position in the alignment of Plasmodium species. We then calculated the median number of rejected substitutions estimated by GERP in both the 5nt and 11nt window around the SNP.
Estimates of constraint within each main clade were calculated in three ways: First by the same procedure as described above for the full tree, but with each of the three main clades (Rodent, Primate, Ape) scaling independently. Second by estimating the models independently for each of these clades, excluding the long branches to the root. These clade-specific models were then used to estimate the sum of branch lengths (again excluding the long branches) for each of the categories (exon, intron, intergenic, FFD). Both these measures were calculated using regions that were consistently annotated (as exon, intron etc.) in P. falciparum, P. yoelii and P. knowlesi. Constraint was then calculated as described above. Third, we calculated constraint within clades as above using regions of the genome that were consistently annotated in all species within the clade (P. knowlesi and P. vivax for the primate clade, P. yoelii, P. berghei and P. chabaudi for the rodent clade, and only P. falciparum for the ape clade).
Identifying Conserved Elements (CEs)
CEs were identified with gerpcol and gerpelem programs of GERP [17], version 2.1b (from http://mendel.stanford.edu/sidowlab/downloads/GERP/index.html). Parameters for running gerpcol were estimated using Hyphy using a HKY85 model, fitted to the full alignment from FFD sites. These parameters were; a neutral rate of 3.067, and transition/transversion rate of 2.63, and the following phylogenetic tree (((PlaBer:0.0839783,PlaYoe:0.127063):0.126016,PlaCha:0.147872):0.59425, (PlaViv:0.295231,PlaKno:0.213155):0.74449,(PlaFal:0.0141867,PlaRei:0.0420219):0.678922);. The gerpelem program of GERP was run using 10% false discovery rate and default parameters.
Characterising CEs
The average proportion of substitutions that were separated by a multiple of 3 bases (PMOT) was calculated by comparing each sequence in the CE alignment slice to each other sequence. In each pairwise comparison we record the distance between each substitution, and then the proportion of these distances that were multiples of 3. The PMOT score for a CE is the average of these proportions from all pairwise comparisons.
We determined the average tBLASTx bit score for each CE as follows. These BLAST searches are designed to detect protein-coding exons, and the median exon length for P. falciparum is 192 nt. So for each Plasmodium species represent in the CE alignment slice, we extract 192 nt of sequence extending out from the midpoint of the CE. We then used this 192 nt sequence to search the Alveolate genomes (Table S4) with NCBI tBLASTx (searched translated nucleotide databases using a translated nucleotide query), accepting only the best hit (irrespective of E-value). For each CE, we record the average bit score for each Plasmodium species represented in the alignment slice. Because all query sequences are the same length bit scores should be comparable between CEs.
CEs were scored for RNA structure using RNAz version 1.0 (http://www.tbi.univie.ac.at/~wash/RNAz) [21]. Since some CEs were longer than the maximum length that RNAz can process, alignments were pre-processed with rnazWindow.pl, (default parameters except no reference sequence), before running RNAz. RNAz was run with default parameters, except predictions were done for both strands). Since rnazWindow.pl has a minimum length cut-off of 50 nt, predictions were not produced for the smaller elements. To give an estimate of the false discovery rate in our data, one simulated alignment was produced for each long CE with SISSIz (Version 0.1) [22]. There were 8726 long exonic CEs where we could produce an RNAz prediction from both the native and the simulated alignment. From these, 98 of the SISSIz alignments had a support vector probability from RNAz >0.95, and 527 of the native alignments had a SV probability >0.95. So false discovery rate (FDR) is 98/527 = 0.19. Similarly non-exonic FDR is 13/33 = 0.4.
Control elements for RNASeq expression analysis were chosen to match the length and GC content of each intergenic CE, but otherwise at random. This produced a set of 406 intergenic ‘non-conserved’ element controls whose length and GC content distributions did not differ significantly from a set of 489 P. falciparum intergenic CE elements (Mann-Whitney tests P>0.1). We located a set of 120 intronic ‘non-conserved’ element controls in the same way to compare to the 80 intronic CEs in P. falciparum. There was no significant difference between the RNAseq expression levels of intergenic controls and intergenic CE elements, or between intronic controls and intronic CE elements (Mann-Whitney tests, both P>0.05).
Read alignment and SNP calling
Reads from 13 P. falciparum isolates and P. reichenowi were used to identify single nucleotide polymorphisms (SNPs) and fixed differences, as follows. See Table S5 for detailed information on SNP calls.
All non-WTSI derived reads were downloaded from the NCBI Trace Archive ftp server (ftp.ncbi.nih.gov/pub/TraceDB/plasmodium_falciparum). Fastq files were mapped to the 3D7 version 2.1.4 reference sequence (ftp://ftp.sanger.ac.uk/pub/pathogens/Plasmodium/falciparum/3D7/3D7.version2.1.4/) using SSAHA2, with the parameters (-seeds 15, -score 250, -tags 1, -diff 15, -output cigar, -memory 300, -cut 5000) and ssaha_pileup code. Ssaha2, ssaha_pileup and associated documentation are available from http://www.sanger.ac.uk/Software/analysis/SSAHA2/.
We excluded non-unique and tandem repeat regions of the genome. Non-unique regions were identified using the SSAHA2 read mapping score (mapping scores range from 0–50). We calculated the mean mapping score for each 2kb window of the genome (with a 100 nt step), using all reads aligned from all isolates (Smean). The 10th percentile of all Smean values was 49.5 (Smean values were frequently 50). We excluded any region within 2kb of a window with Smean <49.5. We identified tandem repeats using the Emboss application etandem (flags -minrepeat 2 -maxrepeat 10), and excluded all tandem repeats with ≥70% identity (to the other repeat). Excluding non-unique regions and tandem repeats left a remainder of 19,664,344 nt of unique non-repeat sequence, 84% of the genome.
As an aid to determining suitable thresholds at which to accept SNP calls, we identified a set of 788 ‘reliable SNPs’ that were called in ≥6 isolates (of the 13 that we examined). Since it is unlikely that we call a false positive 6 times in an identical position, with an identical base, this set of SNPs is enriched for true calls.
We then examined these reliable SNPs in each isolate (i) in turn. Each isolate will call a subset of these SNPs. Each SNP call may be from one or more reads, we determine the average phred score (for the SNP base) from all reads, PSNP ( = total phred score/number of reads calling this base) for each reliable SNP in isolate i. We then examine the distribution of reliable SNP PSNP scores for isolate i, comparing it to the distribution of PSNP scores from all other SNPs called in isolate i. The distribution of PSNP scores from reliable SNPs were always significantly higher than the distribution of PSNP scores from all non-reliable SNPs (all other SNPs) due to more true calls in the reliable SNP set. Assuming that 95% of reliable calls are correct, we set the minimum phred scores required to call a SNP in isolate i as the 5th percentile of the distribution of reliable SNP PSNP scores. We refer to this value as min(PSNP, i).
At each site in the genome where ssaha_pileup calls a SNP (in any isolate) we accept all SNP or reference base calls from each isolates that is supported by ≥2 reads with a PSNP ≥min(PSNP, i). When two alleles satisfied these criteria in an isolate, we accept both alleles, since some samples may contain >1 clone. In practice all min(PSNP, i) scores were ∼25, so SNPs are supported by at least 2 reads with cumulative phred ≥∼50. This method identifies reliable SNPs without a bias towards common SNPs. Fixed differences in P. reichenowi were accepted if supported by ≥2 reads with an average phred score for an allele ≥25.
Derived allele frequencies were calculated from polymorphic sites with a P. reichenowi base call and ≥three isolate base calls, minor allele frequencies from polymorphic sites with ≥four isolate base calls (24,573 DAF calls, 54,641 MAF calls). For gene-specific analysis SNPs were assigned to a gene if they lay within the exons, introns or the half of adjacent intergenic region closer to the gene.
We estimate that the false discovery rate for SNP calling is 1–2%, as follows. We aligned 30,840 reference 3D7 isolate reads from chromosome 12 onto the assembled 3D7 genome and called SNPs as above. Using the thresholds and filters we described above (including only unique regions and excluding tandem repeats), we accept 47 SNPs from 3D7 in chromosome 12 (Table S5). With a similar number of aligned reads, we accept 2,160 SNPs from the PFCLIN isolate and 2,583 SNPs from the IT isolate. If we assume that 47 of the 2160 SNPs from the PFCLIN isolate are false discoveries, then the false discovery rate (FDR) is 47/2160 = 2.1%. With the same reasoning the IT isolate has 1.8% FDR (Table S5). This is probably an overestimate of the FDR because a) some of the 3D7 calls may be correct (i.e.: errors in the reference sequence), and b) 3D7 reads are calling SNPs from a larger proportion of chromosome 12 (95% coverage at ≥2 read depth vs. ∼75% for IT and PFCLIN isolates, see Table S5).
We also estimated the error rate of SNP allele calling using some Illumina data that was available for the IT and PFCLIN isolates (D. Jeffares, unpublished data). Briefly, 90 genes were chosen from primarily polymorphic but unique regions of the genome, and PCR-amplified from various isolates including PFCLIN and IT. Amplicons were sequenced to high depth with Illumina technology, and mapped to the same reference genome with MAQ. We examined how many of the PFCLIN and IT calls from the SSAHA2-mapped ABI capillary reads matched the alleles called (this study) matched those from the MAQ-mapped Illumina reads, using only sites covered by either 10 or 20 Illumina reads. Differences, which may be false SNP calls in either data set, were of the order of 1–2%, as predicted above. In general, error rates in different regions of the genome (exon, intron, intergenic, FFD, non-synonymous sites) were not significantly different. The exception was that for both isolates intergenic sites had significantly higher error rates than exonic regions (see Table S5). We expect this to result in an artifactual shift of intergenic sites to a lower allele frequencies, because artifactual alleles will be rare. We take this into account by comparing only intergenic vs. other intergenic sites. For the comparison of DAF/MAF this would be expected to diminish any affect of lower MAF distribution in exons vs. intergenic sites. Intronic, exonic, FFD and non-synonymous sites did not differ in error rates.
Genetic diversity and selection in the P. falciparum genome
For each isolate (i), a predicted genome was created, for each site in the genome we accept all SNP or reference base calls that were supported by ≥2 reads with a PSNP ≥min(PSNP, i). Sites without sufficient quantity coverage were denoted ‘N’ and not used in the analysis.
Tajima's D was calculated using Variscan (Version 2.0, [67]), using a fixed number of alleles (4) for each SNP (Variscan chooses a random selection if >4 are available at a site), using only polymorphic sites (Variscan parameters FixNum = 1, NumNuc = 4, UseMuts = 0).
The McDonald-Kreitman test neutrality index was calculated as NI = (Pn/Ps)/(Dn/Ds), where Pn and Ps are non-synonymous and synonymous SNPs and Dn and Ds are non-synonymous and synonymous fixed differences (between P. reichenowi and P. falciparum).
Proportion of substitutions fixed by adaptive evolution
It has been shown that the McDonald-Kreitman test can be used to estimate the average proportion of non-synonymous substitutions (α) that have been fixed by adaptive evolution [32], according to the formula , where Ds and Dn are the average number of synonymous and non-synonymous substitutions per gene and Pns is the average of per gene where Pn and Ps are the numbers of synonymous and non-synonymous polymorphisms respectively. This test can be generalised to use other classes of sites as the selected test, in place of non-synonymous sites in the original MK test [33]. We calculated a using four-fold degenerate sites as the neutral control and either non-synonymous sites (for exons), intronic sites, or intergenic sites, bootstrapping (by gene) 1000 times to determine the 5th and 95th percentiles. Intergenic SNPs and fixed differences were assigned to a gene if they fell in the half of the intergenic region closest to the gene.
Statistics
All statistics were performed in R (Version 2.6.0) (Ref. [68]). Tests for differences in DAF or MAF used Mann-Whitney U tests. Tests for differences in selective constraint between exon, intron, and intergenic sites within a gene used paired Mann-Whitney U tests.
Supporting Information
Zdroje
1. AregawiM
CibulskisR
OttenM
WilliamsR
DyeC
2008 World malaria report 2008 World Health Organization
2. WoottonJC
FengX
FerdigMT
CooperRA
MuJ
2002 Genetic diversity and chloroquine selective sweeps in Plasmodium falciparum. Nature 418 320 323
3. NairS
WilliamsJT
BrockmanA
PaiphunL
MayxayM
2003 A selective sweep driven by pyrimethamine treatment in southeast asian malaria parasites. Mol Biol Evol 20 1526 1536
4. RoperC
PearceR
NairS
SharpB
NostenF
2004 Intercontinental spread of pyrimethamine-resistant malaria. Science 305 1124
5. AndersonTJ
RoperC
2005 The origins and spread of antimalarial drug resistance: lessons for policy makers. Acta Trop 94 269 280
6. DzikowskiR
TempletonTJ
DeitschK
2006 Variant antigen gene expression in malaria. Cell Microbiol 8 1371 1381
7. PierceSK
MillerLH
2009 World Malaria Day 2009: what malaria knows about the immune system that immunologists still do not. J Immunol 182 5171 5177
8. NeafseyDE
HartlDL
BerrimanM
2005 Evolution of noncoding and silent coding sites in the Plasmodium falciparum and Plasmodium reichenowi genomes. Mol Biol Evol 22 1621 1626
9. JeffaresDC
PainA
BerryA
CoxAV
StalkerJ
2007 Genome variation and evolution of the malaria parasite Plasmodium falciparum. Nat Genet 39 120 125
10. HalliganDL
Eyre-WalkerA
AndolfattoP
2004 Patterns of evolutionary constraints in intronic and intergenic DNA of Drosophila. Genome Research
11. HalliganDL
KeightleyPD
2006 Ubiquitous selective constraints in the Drosophila genome revealed by a genome-wide interspecies comparison. Genome Res 16 875 884
12. GaffneyDJ
KeightleyPD
2006 Genomic selective constraints in murid noncoding DNA. PLoS Genet 2 e204
13. HasegawaM
KishinoH
YanoT
1985 Dating of the human-ape splitting by a molecular clock of mitochondrial DNA. J Mol Evol 22 160 174
14. ScherfA
Lopez-RubioJJ
RiviereL
2008 Antigenic variation in Plasmodium falciparum. Annu Rev Microbiol 62 445 470
15. PetterM
BonowI
KlinkertMQ
2008 Diverse expression patterns of subgroups of the rif multigene family during Plasmodium falciparum gametocytogenesis. PLoS ONE 3 e3779
16. BlytheJE
YamXY
KussC
BozdechZ
HolderAA
2008 Plasmodium falciparum STEVOR proteins are highly expressed in patient isolates and located in the surface membranes of infected red blood cells and the apical tips of merozoites. Infect Immun 76 3329 3336
17. CooperGM
StoneEA
AsimenosG
GreenED
BatzoglouS
2005 Distribution and intensity of constraint in mammalian genomic sequence. Genome Res 15 901 913
18. OttoTD
WilinskiD
AssefaS
KeaneTM
SarryLR
2010 New insights into the blood-stage transcriptome of Plasmodium falciparum using RNA-Seq. Mol Microbiol 76 12 24
19. MourierT
CarretC
KyesS
ChristodoulouZ
GardnerPP
2008 Genome-wide discovery and verification of novel structured RNAs in Plasmodium falciparum. Genome Res 18 281 292
20. RaabeCA
SanchezCP
RandauG
RobeckT
SkryabinBV
2009 A global view of the nonprotein-coding transcriptome in Plasmodium falciparum. Nucleic Acids Res
21. WashietlS
HofackerIL
StadlerPF
2005 Fast and reliable prediction of noncoding RNAs. Proc Natl Acad Sci U S A 102 2454 2459
22. GesellT
WashietlS
2008 Dinucleotide controlled null models for comparative RNA gene prediction. BMC Bioinformatics 9 248
23. NielsenR
2005 Molecular signatures of natural selection. Annual Review of Genetics 39 197 218
24. CharlesworthD
2006 Balancing selection and its effects on sequences in nearby genome regions. PLoS Genet 2 e64
25. VerraF
HughesAL
1999 Natural selection on apical membrane antigen-1 of Plasmodium falciparum. Parassitologia 41 93 95
26. VolkmanSK
HartlDL
WirthDF
NielsenKM
ChoiM
2002 Excess polymorphisms in genes for membrane proteins in Plasmodium falciparum. Science 298 216 218
27. KarP
DashAP
SupakarPC
2007 Polymorphism study of rhoptry associated membrane antigen (RAMA) gene of Plasmodium falciparum–a putative vaccine candidate. Mol Biochem Parasitol 155 156 160
28. PolleySD
TettehKK
LloydJM
AkpoghenetaOJ
GreenwoodBM
2007 Plasmodium falciparum merozoite surface protein 3 is a target of allele-specific immunity and alleles are maintained by natural selection. J Infect Dis 195 279 287
29. MuJ
AwadallaP
DuanJ
McGeeKM
KeeblerJ
2007 Genome-wide variation and identification of vaccine targets in the Plasmodium falciparum genome. Nat Genet 39 126 130
30. AyalaFJ
AnaniasA
L.AA
RichSM
1998 Evolutionary relationships of human malaria parasites.
ShermanIW
Malaria: Biology, pathogenesis and protection Washington (D.C.) ASM Press
31. McDonaldJH
KreitmanM
1991 Adaptive protein evolution at the Adh locus in Drosophila. Nature 351 652 654
32. SmithNG
Eyre-WalkerA
2002 Adaptive protein evolution in Drosophila. Nature 415 1022 1024
33. AndolfattoP
2005 Adaptive evolution of non-coding DNA in Drosophila. Nature 437 1149 1152
34. ConwayDJ
1997 Natural selection on polymorphic malaria antigens and the search for a vaccine. Parasitol Today 13 26 29
35. TajimaF
1989 Statistical method for testing the neutral mutation hypothesis by DNA polymorphism. Genetics 123 585 595
36. PolleySD
ConwayDJ
2001 Strong diversifying selection on domains of the Plasmodium falciparum apical membrane antigen 1 gene. Genetics 158 1505 1512
37. TheraMA
DoumboOK
CoulibalyD
DialloDA
KoneAK
2008 Safety and immunogenicity of an AMA-1 malaria vaccine in Malian adults: results of a phase 1 randomized controlled trial. PLoS ONE 3 e1465
38. KennedyMC
WangJ
ZhangY
MilesAP
ChitsazF
2002 In vitro studies with recombinant Plasmodium falciparum apical membrane antigen 1 (AMA1): production and activity of an AMA1 vaccine and generation of a multiallelic response. Infect Immun 70 6948 6960
39. PinzonCG
CurtidorH
ReyesC
MendezD
PatarroyoME
2008 Identification of Plasmodium falciparum RhopH3 protein peptides that specifically bind to erythrocytes and inhibit merozoite invasion. Protein Sci 17 1719 1730
40. BirneyE
StamatoyannopoulosJA
DuttaA
GuigoR
GingerasTR
2007 Identification and analysis of functional elements in 1% of the human genome by the ENCODE pilot project. Nature 447 799 816
41. WaterstonRH
Lindblad-TohK
BirneyE
RogersJ
AbrilJF
2002 Initial sequencing and comparative analysis of the mouse genome. Nature 420 520 562
42. ShabalinaSA
OgurtsovAY
KondrashovVA
2001 Selective constraint in intergenic regions of human and mouse genomes. Trends in Genetics
43. ShabalinaSA
KondrashovAS
1999 Pattern of selective constraint in C. elegans and C. briggsae genomes. Genet Res 74 23 30
44. BensassonD
ZarowieckiM
BurtA
KoufopanouV
2008 Rapid evolution of yeast centromeres in the absence of drive. Genetics 178 2161 2167
45. GunasekeraAM
MyrickA
MilitelloKT
SimsJS
DongCK
2007 Regulatory motifs uncovered among gene expression clusters in Plasmodium falciparum. Mol Biochem Parasitol 153 19 30
46. JurgelenaiteR
DijkstraTM
KockenCH
HeskesT
2009 Gene regulation in the intraerythrocytic cycle of Plasmodium falciparum. Bioinformatics 25 1484 1491
47. ImamuraH
PersampieriJH
ChuangJH
2007 Sequences conserved by selection across mouse and human malaria species. BMC Genomics 8 372
48. WuJ
SieglaffDH
GervinJ
XieXS
2008 Discovering regulatory motifs in the Plasmodium genome using comparative genomics. Bioinformatics 24 1843 1849
49. YoungJA
JohnsonJR
BennerC
YanSF
ChenK
2008 In silico discovery of transcription regulatory elements in Plasmodium falciparum. BMC Genomics 9 70
50. ElementoO
SlonimN
TavazoieS
2007 A universal framework for regulatory element discovery across all genomes and data types. Mol Cell 28 337 350
51. IengarP
JoshiNV
2009 Identification of putative regulatory motifs in the upstream regions of co-expressed functional groups of genes in Plasmodium falciparum. BMC Genomics 10 18
52. De SilvaEK
GehrkeAR
OlszewskiK
LeonI
ChahalJS
2008 Specific DNA-binding by apicomplexan AP2 transcription factors. Proc Natl Acad Sci U S A 105 8393 8398
53. NeafseyDE
SchaffnerSF
VolkmanSK
ParkD
MontgomeryP
2008 Genome-wide SNP genotyping highlights the role of natural selection in Plasmodium falciparum population divergence. Genome Biol 9 R171
54. International Hapmap Consortium 2007 A second generation human haplotype map of over 3.1 million SNPs. Nature 449 851 861
55. BierneN
Eyre-WalkerA
2006 Variation in synonymous codon use and DNA polymorphism within the Drosophila genome. J Evol Biol 19 1 11
56. Eyre-WalkerA
2002 Changing effective population size and the McDonald-Kreitman test. Genetics 162 2017 2024
57. MustoH
RomeroH
ZavalaA
JabbariK
BernardiG
1999 Synonymous codon choices in the extremely GC-poor genome of Plasmodium falciparum: compositional constraints and translational selection. Journal of molecular evolution 49 27 35
58. ConwayDJ
FanelloC
LloydJM
Al-JouboriBM
BalochAH
2000 Origin of Plasmodium falciparum malaria is traced by mitochondrial DNA. Mol Biochem Parasitol 111 163 171
59. JoyDA
FengX
MuJ
FuruyaT
ChotivanichK
2003 Early origin and recent expansion of Plasmodium falciparum. Science 300 318 321
60. CarltonJM
AdamsJH
SilvaJC
BidwellSL
LorenziH
2008 Comparative genomics of the neglected human malaria parasite Plasmodium vivax. Nature 455 757 763
61. DeweyCN
2007 Aligning multiple whole genomes with Mercator and MAVID. Methods Mol Biol 395 221 236
62. KentWJ
2002 BLAT–the BLAST-like alignment tool. Genome Res 12 656 664
63. HirshAE
FraserHB
2001 Protein dispensability and rate of evolution. Nature 411 1046 1049
64. BrayN
PachterL
2004 MAVID: constrained ancestral alignment of multiple sequences. Genome Res 14 693 699
65. YangZ
2007 PAML 4: phylogenetic analysis by maximum likelihood. Mol Biol Evol 24 1586 1591
66. PondSL
FrostSD
MuseSV
2005 HyPhy: hypothesis testing using phylogenies. Bioinformatics 21 676 679
67. VilellaAJ
Blanco-GarciaA
HutterS
RozasJ
2005 VariScan: Analysis of evolutionary patterns from large-scale DNA sequence polymorphism data. Bioinformatics 21 2791 2793
68. R Development Core Team 2007 R: A Language and Environment for Statistical Computing Vienna, Austria
Štítky
Genetika Reprodukční medicínaČlánek vyšel v časopise
PLOS Genetics
2010 Číslo 9
Nejčtenější v tomto čísle
- Synthesizing and Salvaging NAD: Lessons Learned from
- Optimal Strategy for Competence Differentiation in Bacteria
- Long- and Short-Term Selective Forces on Malaria Parasite Genomes
- Identifying Signatures of Natural Selection in Tibetan and Andean Populations Using Dense Genome Scan Data