
Differential Genetic Associations for Systemic Lupus Erythematosus Based on Anti–dsDNA Autoantibody Production
Systemic lupus erythematosus (SLE) is a clinically heterogeneous, systemic autoimmune disease characterized by autoantibody formation. Previously published genome-wide association studies (GWAS) have investigated SLE as a single phenotype. Therefore, we conducted a GWAS to identify genetic factors associated with anti–dsDNA autoantibody production, a SLE–related autoantibody with diagnostic and clinical importance. Using two independent datasets, over 400,000 single nucleotide polymorphisms (SNPs) were studied in a total of 1,717 SLE cases and 4,813 healthy controls. Anti–dsDNA autoantibody positive (anti–dsDNA +, n = 811) and anti–dsDNA autoantibody negative (anti–dsDNA –, n = 906) SLE cases were compared to healthy controls and to each other to identify SNPs associated specifically with these SLE subtypes. SNPs in the previously identified SLE susceptibility loci STAT4, IRF5, ITGAM, and the major histocompatibility complex were strongly associated with anti–dsDNA + SLE. Far fewer and weaker associations were observed for anti–dsDNA – SLE. For example, rs7574865 in STAT4 had an OR for anti–dsDNA + SLE of 1.77 (95% CI 1.57–1.99, p = 2.0E-20) compared to an OR for anti–dsDNA – SLE of 1.26 (95% CI 1.12–1.41, p = 2.4E-04), with pheterogeneity<0.0005. SNPs in the SLE susceptibility loci BANK1, KIAA1542, and UBE2L3 showed evidence of association with anti–dsDNA + SLE and were not associated with anti–dsDNA – SLE. In conclusion, we identified differential genetic associations with SLE based on anti–dsDNA autoantibody production. Many previously identified SLE susceptibility loci may confer disease risk through their role in autoantibody production and be more accurately described as autoantibody propensity loci. Lack of strong SNP associations may suggest that other types of genetic variation or non-genetic factors such as environmental exposures have a greater impact on susceptibility to anti–dsDNA – SLE.
Published in the journal:
. PLoS Genet 7(3): e32767. doi:10.1371/journal.pgen.1001323
Category:
Research Article
doi:
https://doi.org/10.1371/journal.pgen.1001323
Summary
Systemic lupus erythematosus (SLE) is a clinically heterogeneous, systemic autoimmune disease characterized by autoantibody formation. Previously published genome-wide association studies (GWAS) have investigated SLE as a single phenotype. Therefore, we conducted a GWAS to identify genetic factors associated with anti–dsDNA autoantibody production, a SLE–related autoantibody with diagnostic and clinical importance. Using two independent datasets, over 400,000 single nucleotide polymorphisms (SNPs) were studied in a total of 1,717 SLE cases and 4,813 healthy controls. Anti–dsDNA autoantibody positive (anti–dsDNA +, n = 811) and anti–dsDNA autoantibody negative (anti–dsDNA –, n = 906) SLE cases were compared to healthy controls and to each other to identify SNPs associated specifically with these SLE subtypes. SNPs in the previously identified SLE susceptibility loci STAT4, IRF5, ITGAM, and the major histocompatibility complex were strongly associated with anti–dsDNA + SLE. Far fewer and weaker associations were observed for anti–dsDNA – SLE. For example, rs7574865 in STAT4 had an OR for anti–dsDNA + SLE of 1.77 (95% CI 1.57–1.99, p = 2.0E-20) compared to an OR for anti–dsDNA – SLE of 1.26 (95% CI 1.12–1.41, p = 2.4E-04), with pheterogeneity<0.0005. SNPs in the SLE susceptibility loci BANK1, KIAA1542, and UBE2L3 showed evidence of association with anti–dsDNA + SLE and were not associated with anti–dsDNA – SLE. In conclusion, we identified differential genetic associations with SLE based on anti–dsDNA autoantibody production. Many previously identified SLE susceptibility loci may confer disease risk through their role in autoantibody production and be more accurately described as autoantibody propensity loci. Lack of strong SNP associations may suggest that other types of genetic variation or non-genetic factors such as environmental exposures have a greater impact on susceptibility to anti–dsDNA – SLE.
Introduction
Systemic lupus erythematosus (SLE) is the prototypic systemic autoimmune disease and can affect virtually any organ system. Manifestations of SLE are quite varied and include renal failure, hemolytic anemia, arterial and venous clots, and disfiguring skin rashes. Overall prevalence of SLE in the general population is 1 in 2000 individuals with a predilection for women (female to male ratio of 6-10∶1) [1]. Although the prevalence is relatively low, SLE creates tremendous health care and societal costs since affected individuals are typically young and can suffer significant morbidity and early mortality.
The pivotal immunologic disturbance in SLE is the formation of autoantibodies directed at cell membrane and nuclear components. Deposition of immune complexes containing these autoantibodies leads to inflammatory responses and end-organ damage. Autoantibodies directed against native double-stranded DNA (dsDNA) are observed in 40–60% of SLE patients. Anti–dsDNA autoantibodies can be present prior to clinical symptoms of SLE [2], and are implicated in the pathogenesis of lupus nephritis, a major cause of morbidity and mortality in SLE [3], [4]. Anti–dsDNA autoantibodies have also been associated with decreased survival [4]. Given its high specificity for SLE, anti–dsDNA autoantibody production is one of the 11 classification criteria for SLE developed by the American College of Rheumatology (ACR) [5], [6].
SLE susceptibility is strongly influenced by both genetic and environmental factors. Recent genetic association studies have successfully identified over 20 SLE susceptibility loci [7]. Odds ratios (OR) for these associations have been modest, with most OR <1.3. One potential factor influencing the magnitude of these associations may be the extensive clinical heterogeneity of SLE. Studying more specifically defined SLE manifestations may reveal stronger and novel genetic associations. Therefore, we conducted a genome-wide association study of anti–dsDNA autoantibody production in SLE to identify genetic associations with this clinically relevant autoantibody, and to determine if the genetic associations were different between those SLE subjects that do and do not produce this autoantibody.
Results
For this genome-wide association study (GWAS), we utilized genotyping data from the GWAS of SLE published by Hom et al. [8] as the discovery dataset, and genotyping data from the GWAS of SLE published by The International Consortium on the Genetics of Systemic Lupus Erythematosus (SLEGEN) [9] as the replication dataset. Since both datasets utilized publicly available healthy controls from the same sources, we supplemented the controls in the replication dataset with 1142 healthy controls from the Cancer Genetic Markers of Susceptibility (CGEMS) study (http://cgems.cancer.gov/data/) [10]. After employing data quality measures, including removal of duplicate and related subjects (see Methods and Figure 1), a total of 1717 SLE cases and 4813 healthy controls of European descent were studied. The discovery dataset was comprised of 1278 SLE cases and 3334 healthy controls, while the replication dataset was comprised of 439 SLE cases and 1479 healthy controls. For both datasets, 47% of the SLE cases were anti–dsDNA +. In the joint dataset, 296,509 SNPs were typed in common between the discovery and replication datasets and passed data quality measures (see Methods). An additional 124,809 imputed SNPs (see Methods) passed data quality filters and were included for analysis in the replication and joint datasets. Figure 1 summarizes the autoantibody status and sample sizes of the datasets used in this study, as well as the number of individuals removed for each data quality measure. The clinical characteristics of the subjects in this study, provided in Table 1, are comparable to those in previously reported studies [1], [11].


Anti–dsDNA + SLE versus healthy controls
We first compared anti–dsDNA + SLE cases to healthy controls using additive logistic regression models implemented in PLINK [12] (http://pngu.mgh.harvard.edu/purcell/plink/). The discovery and replication datasets were analyzed separately, and then combined into a “joint analysis” for maximal statistical power. All logistic regression models were adjusted for population stratification using principal components analysis. Table S1 presents the genomic control inflation factor (λGC) for each analysis prior to and after adjustment for population stratification. P-values for association were adjusted for the λGC observed after accounting for population stratification (see Methods for additional details). The quantile-quantile and Manhattan plots for the joint analysis are displayed in Figure S1.
Table 2 (and Table S2) displays each locus with significant (p<5E-07) or suggestive (p<1E-05) evidence of association in the joint analysis. Excluding the associations seen with the major histocompatilibity complex (MHC) on chromosome 6p21, 14 statistically significant associations were observed in the joint analysis of genotyped SNPs when none would have been expected under the null hypothesis. The most significant associations were observed in the MHC, with rs1150754 near TNXB (ORjoint 2.21, 95% CI 1.92–2.53, p = 6.4E-29) as the most significantly associated SNP. Outside of the MHC, the most significantly associated SNP was rs7574865 (ORjoint 1.77, 95% CI 1.57–1.99, p = 2.0E-20) located in STAT4. Strong evidence of association was observed with SNPs in/near IRF5 and ITGAM. Association results for these loci met the genome-wide significance threshold in both datasets, and thus are considered replicated findings. These 3 loci were previously shown to be associated with SLE [8], [13], [14], but only STAT4 has been previously associated with anti–dsDNA autoantibody production [15], [16]. Strong evidence of association was also observed for BLK in the joint analysis, but this association did not meet the threshold for genome-wide significance in both datasets. While SNPs in/near LAMC2 and COL25A1 met the genome-wide significance threshold in the discovery dataset, these associations were not observed in the replication dataset, possibly due to the limited statistical power of the second dataset.

Suggestive findings of association in the joint dataset (p<1E-05) were seen with SNPs near or in the PTTG1, UBE2L3, SLC1A7, and KIAA1542 loci, and with rs10737562 (no known gene within 100 kb). PTTG1, KIAA1542, and UBE2L3 have been shown to be associated with SLE [7], [9], and thus, are likely true associations that are specific for anti–dsDNA + SLE. The associations with SLC1A7 and rs10737562 have not been previously reported with SLE or anti–dsDNA autoantibody production, and should be replicated in another collection of anti–dsDNA + SLE cases.
Anti–dsDNA + SLE cases (n = 811) were also compared to the combined group of anti–dsDNA – SLE cases and healthy controls (n = 5719) to conduct an analysis maximally powered to identify SNPs only associated with anti–dsDNA + SLE. No new loci (i.e., loci not presented in Table 2) displayed significant or suggestive evidence of association. Also, analyses comparing anti–dsDNA + SLE cases to healthy controls excluding ANA negative subjects showed results similar to Table 2 (data not shown).
Anti–dsDNA negative SLE versus healthy controls
Next, we compared anti–dsDNA – SLE cases to healthy controls in the discovery, replication, and combined “joint analysis” datasets using additive logistic regression models adjusted for population stratification as described previously. Table S1 presents the genomic control inflation factor (λGC) for each analysis prior to and after adjustment for population stratification. The quantile-quantile and Manhattan plots for the joint analysis are displayed in Figure S2.
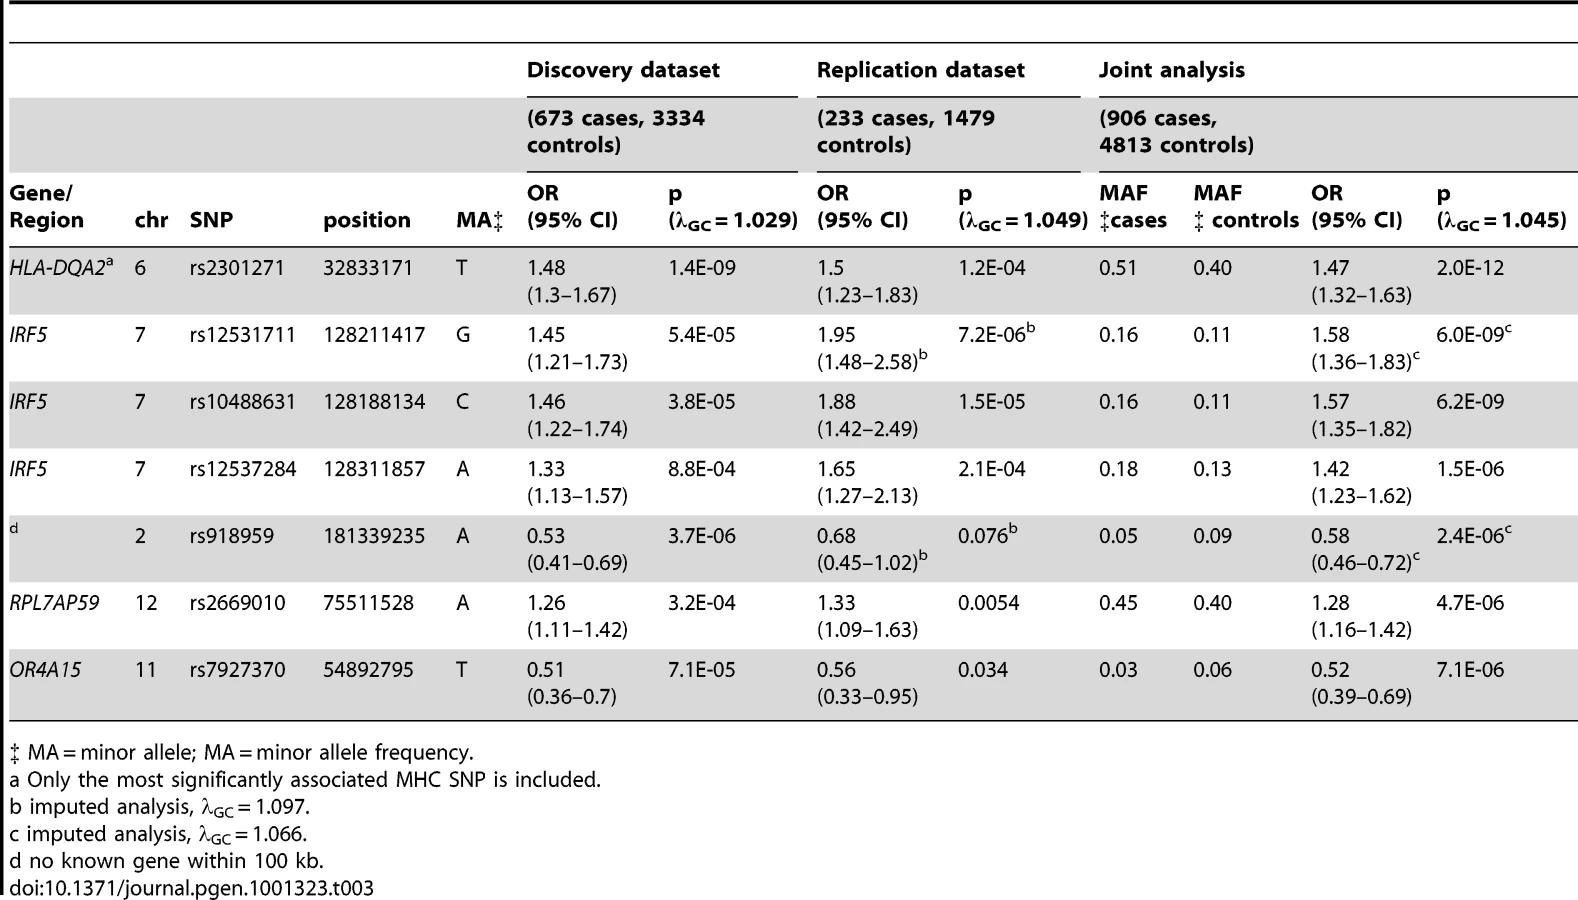
Far fewer statistically significant genetic associations were observed. Excluding the MHC, one statistically significant association was observed in the joint analysis of genotyped SNPs when none would have been expected under the null hypothesis (p<5E-07). The most significant associations were again seen in the MHC, with rs2301271 (∼9 kb downstream from HLA-DQA2) as the most significantly associated MHC SNP (ORjoint 1.47, 95% CI 1.32–1.63, p = 2.0E-12). In the discovery dataset, no SNPs outside of the MHC met our genome-wide significance threshold. In the joint analysis (Table 3), an additional association with rs10488631 near IRF5 met genome-wide significance (ORjoint 1.57, 95% CI 1.35–1.82, p = 6.2E-09). Three SNPs had suggestive evidence of association in the joint analysis: rs2669010 in RPL7AP50, rs918959 (no known gene within 100 KB), and the missense SNP rs7927370 in OR4A15. These novel findings need to be replicated in another collection of anti–dsDNA – SLE cases. Analyses excluding ANA negative subjects showed similar results (data not shown).
Case-only analysis
Using the combined dataset, we compared the anti–dsDNA + SLE cases (n = 811) to the anti–dsDNA – SLE cases (n = 906) using additive logistic regression models. Minimal population stratification was observed between these two groups (λGC = 1.01) without adjustment using principal components. However, we included the principal components in these models to decrease the possible influence of subtle stratification on our findings (λGC = 1.00 after adjustment for population stratification).
No SNP met our genome-wide significance threshold (p<5E-07) for anti–dsDNA autoantibody production in this analysis. Six SNPs showed suggestive evidence of association (p<1E-05), as shown in Table 4. Only three SNPs would be expected to have a p<1E-05 under the null hypothesis. Similar to the anti–dsDNA + analysis described above, rs7574865 in STAT4 was once again found to be associated with anti–dsDNA + SLE. rs1463525 in NAALADL2 is of interest, since this gene was recently identified as a susceptibility locus for Kawasaki disease [17], another autoimmune disease. However, the most significantly associated SNP for Kawasaki disease (rs17531088) is not in linkage disequilibrium with the SNP identified in our analysis (r2 = 0.002 in the CEU HapMap population). The statistical power for this analysis was limited by our relatively smaller sample size. Thus, additional studies are needed to fully explore this area and to replicate our findings.

Since two of the suggested SNPs are located within the MHC, our findings indicate that MHC associations may be heterogeneous between these two subgroups of SLE. This finding is further supported by a plot of the p-values for association among the MHC SNPs, as shown in Figure 2. The strongest MHC associations with anti–dsDNA autoantibody production among these SLE patients were within the class II region. Given the extensive linkage disequilibrium of the MHC, many of these associations may be driven by the MHC class II locus HLA-DRB1, a well established SLE susceptibility gene [18], [19].

Comparison of SLE–associated SNPs
Next, we examined the magnitude of association between 22 polymorphisms previously associated with SLE in Gateva et al. [7], stratified by anti–dsDNA autoantibody status using tests of heterogeneity. For each SNP, the association result in the anti–dsDNA + versus healthy control analysis was compared to the association result for the anti–dsDNA – versus healthy control analysis. A p-value of less than 0.05 was considered significant evidence of heterogeneity.
Table 5 presents the results of the tests of heterogeneity, along with the association results from the case-only analysis, for these 22 SLE susceptibility loci. Associations for HLA-DR3 (indicated by its tagSNP rs2187668) and SNPs in STAT4 and ITGAM differed substantially between the two anti–dsDNA subgroups (pheterogeneity<0.005). In addition, SNPs in the BANK1, KIAA1542, ITGAM, and UBE2L3 regions also showed differential associations in the two anti–dsDNA subgroups (p<0.05). For all of these SNPs, the associations with anti–dsDNA + SLE had stronger OR and smaller p-values when compared to anti–dsDNA – SLE or SLE itself. The differences are best demonstrated by rs7574865 in STAT4: OR for anti–dsDNA + SLE 1.77 (95% CI 1.57–1.99, p = 2.0E-20) compared to OR for anti–dsDNA – SLE 1.26 (95% 1.12–1.41, p = 2.4E-4), with p-value for the test of heterogeneity <0.0005. In contrast, ORs of association were quite similar between the 2 SLE subgroups for SNPs in/near the FCGR2A, OX40L, IL10, PXK, UHRF1BP1, PRDM1, BLK, and IRAK1 regions.
![Comparison of association results for loci associated with systemic lupus erythematosus described in Gateva et. al <em class="ref">[7]</em>, stratified by anti–dsDNA autoantibody production.](https://pl-master.mdcdn.cz/media/cache/media_object_image_large/media/image/537bad736ef6affb2fcf3f6ed3e0d8ae.png)
When examining these SNPs in the case-only analysis, rs2476601 (PTPN22), rs10488631 (IRF5), and rs2431099 (PTTG1) were more strongly associated with anti–dsDNA + SLE than anti–dsDNA – SLE (p<0.05). Sensitivity analysis of the 722 SLE cases with longitudinal anti–dsDNA autoantibody data (of which 46% were anti–dsDNA +, see Methods) showed good consistency in OR with the analyses performed using the full dataset (data not shown).
Among the SNPs studied in this comparison, we did not identify a single SNP that was more strongly associated with anti–dsDNA – SLE disease than anti–dsDNA + SLE or SLE itself, based on OR or p-values.
Genetic Risk Score analysis
To study the relationship between cumulative genetic risk and anti–dsDNA autoantibody production, we calculated an SLE genetic risk score (GRS) by counting the total number of risk alleles an individual had for the 22 SLE-associated SNPs listed in Table 5. The mean SLE GRS was higher in anti–dsDNA + SLE cases (15.5, SD 3.1) compared to anti–dsDNA – SLE cases (14.5, SD 3.0) and healthy controls (13.1, SD 2.8), and the trend was highly statistically significant (ptrend = 1.0E-102). In logistic regression analyses adjusting for study source and population stratification, the odds of producing anti–dsDNA among SLE cases increased by 12% (OR 1.12, 95% CI 1.09–1.16) for each 1 unit increase in the SLE GRS. When comparing to healthy controls, the odds of having anti–dsDNA + SLE increased by 32% (OR 1.32, 95% CI 1.28–1.35) for each 1 unit increase in the SLE GRS versus 18% (OR 1.18, 95% CI 1.15–1.21) for anti–dsDNA – SLE. These findings indicate that SLE cases with higher genetic risk are more likely to be anti–dsDNA positive. A more thorough investigation of the association between SLE GRS and SLE manifestations is presented in Taylor et al. [20].
Discussion
In this paper, we present the first GWAS of anti–dsDNA autoantibody production in SLE. We have shown that SNPs in the MHC, STAT4, IRF5, and ITGAM regions are associated with anti–dsDNA + SLE. Only SNPs in the MHC and IRF5 met genome-wide significance threshold levels in the analysis of anti–dsDNA – SLE, with lower OR and larger p-values compared to their associations with anti–dsDNA + SLE. Furthermore, many of the previously identified SLE susceptibility loci showed differential associations between the 2 anti–dsDNA subgroups. Using a genetic risk score analysis, we found that SLE cases with a greater number of risk alleles were more likely to be anti–dsDNA +. These results suggest that genetic factors may have a greater influence in the development of anti–dsDNA + SLE as compared to anti–dsDNA – SLE.
The strongest association signals for both the anti–dsDNA + and anti–dsDNA – analyses were observed with MHC SNPs. Previous studies have shown that the strongest, most consistent genetic signals with SLE have been with the HLA-DR2 and HLA-DR3 MHC serotypes [18], [19]. While we confirm these findings, we also show that the HLA-DR3 association with SLE (as suggested by its tagSNP, rs2187668) is far stronger in anti–dsDNA + SLE as compared to anti–dsDNA – SLE or SLE itself. Thus, the HLA-DR3 allele may have a greater impact on the propensity to produce autoantibodies compared to SLE susceptibility generally. Although a similar finding was observed with HLA-DR2 (tagSNP rs9271366), the test of heterogeneity was not statistically significant, possibly due in part to decreased statistical power since the DR2 tagSNP is less common than the DR3 tagSNP (DR2 tagSNP minor allele frequency 0.182 in anti–dsDNA + SLE, 0.167 in anti–dsDNA – SLE, and 0.143 in healthy controls). Examination of other MHC SNPs in the case-only analysis indicates that other (non-HLA-DRB1) loci may have associations with anti–dsDNA autoantibody production beyond the associations observed with SLE.
In addition to the HLA-DR3 tagSNP discussed above, the associations between the STAT4 and ITGAM SNPs and anti–dsDNA + SLE were stronger in magnitude than the associations with SLE per se in our datasets (Table 5). The smaller p-values seen in the associations for these loci with anti–dsDNA + SLE are especially striking given the substantially smaller sample size of this subgroup. Our results imply that STAT4, ITGAM, and HLA-DR3 may be more accurately considered “autoantibody propensity loci” rather than simply “SLE susceptibility loci” given their significant tests of heterogeneity (p<0.05). Using this criterion, three other previously identified SLE susceptibility loci may also be considered autoantibody propensity loci: KIAA1542, BANK1, and UBE2L3. In fact, these SNPs had no evidence of association with anti–dsDNA – SLE in this study (p>0.05). By characterizing these SNPs as autoantibody propensity loci, we identify a potential mechanistic role for these disease associations.
Are these autoantibody propensity loci associated with other autoantibodies? In rheumatoid arthritis (RA), other alleles of the HLA-DRB1 locus (collectively referred to as the “shared epitope”) are associated with anti-CCP autoantibody positivity [21]. While a study of STAT4 (rs7574865) in an early RA inception cohort suggested an association with the anti-CCP autoantibody [22], others have not a shown strong association between this SNP and seropositivity in RA [23]. PTPN22 (rs2476601) has been shown to be more strongly associated with autoantibody positive RA [22]. In our study, other SLE-related autoantibodies (anti-SSA, anti-SSB, anti-Sm, and anti-RNP) are more frequent in the anti–dsDNA + subgroup (Table 1), but correlations between anti–dsDNA and these other autoantibodies antibodies are modest, with Pearson correlation coefficients <0.2 (data not shown). Thus, additional studies are needed to further investigate whether these or other loci are associated with other autoantibodies.
Of note, not all of the previously identified SLE susceptibility SNPs showed differential associations between the anti–dsDNA subgroups. In fact, the OR for the SNPs in or near FCGR2A, OX40L, PXK, and UHRF1BP1 were strikingly similar between the anti–dsDNA + and anti–dsDNA – subgroups. These loci may represent more generalized SLE susceptibility loci, and their mode of conferring SLE disease risk is likely independent of anti–dsDNA autoantibody production. While PTPN22 (rs2476601), IRF5 (rs10488631), and PTTG1 (rs2431099) do not fulfill our criterion as autoantibody susceptibility loci, the results of the case-only analysis suggest that these loci may have a stronger effect in anti–dsDNA + SLE.
Interestingly, far fewer associations were seen in the anti–dsDNA – SLE analysis. Even in the joint analysis, which had the most statistical power, only 1 SNP outside of the MHC met our genome-wide significance threshold—rs10488631 in IRF5. This finding may be explained by a number of different reasons. SNP associations for anti–dsDNA – subgroup may be weaker, and thus would require a larger sample of anti–dsDNA – SLE cases in order to be identified. Other types of genetic variation or non-genetic factors, such as environmental exposures [24], [25], may have a stronger influence on susceptibility to anti–dsDNA – SLE. Lastly, the anti–dsDNA – subgroup may be more clinically heterogeneous or be comprised of individuals who develop SLE through different pathogenic (and genetic) mechanisms, thus decreasing our statistical power to identify genetic associations with this subgroup.
One limitation of this study is the potential misclassification of anti–dsDNA autoantibody status. This misclassification may have occurred because the anti–dsDNA autoantibody was assessed by different assays between the participating case collections, and a patient's anti–dsDNA status can vary over the disease course. However, this misclassification would bias our findings of differences between anti–dsDNA + and anti–dsDNA – SLE towards the null. Moreover, sensitivity analyses performed using the available longitudinal data showed consistent ORs, suggesting that the potential misclassification did not greatly influence our results. A second limitation is that all participants were of European descent. Limiting this study to those of European descent minimizes confounding due to genetic differences arising from differences in ethnicity. Future efforts should study non-European populations given their increased incidence of SLE [26], [27].
In summary, this GWAS of anti–dsDNA autoantibody production in SLE shows that there are more, and stronger, genetic associations in anti–dsDNA + SLE compared to anti–dsDNA – SLE. Previously identified SLE susceptibility loci such as STAT4, ITGAM, KIAA1542, BANK1, and UBE2L3 are more strongly associated with anti–dsDNA + SLE and may confer disease risk through their role in autoantibody production. Weaker associations in anti–dsDNA – SLE may suggest that other types of genetic variation or non-genetic factors have a greater impact on disease risk. Lastly, focusing genetic studies on clinical disease characteristics decreases the heterogeneity that could cloud association results and may provide greater insight into pathogenic disease mechanisms.
Methods
Ethics statement
Written informed consent was obtained from all study participants and the institutional review board at each collaborating center approved the study.
Subjects and genotyping
For this study, all SLE cases and healthy controls were of European descent. All SLE cases fulfilled at least 4 ACR classification criteria for SLE [5], [6]. Figure 1 presents the final sample sizes in the discovery and replication datasets, and the final number of SNPs advanced to analysis.
Discovery dataset
The discovery dataset utilized genotyping data from the GWAS of SLE published by Hom et al. [8]. All SLE cases (n = 1311) and healthy controls (n = 3340) were genotyped for over 500,000 single nucleotide polymorphisms (SNPs) using the Illumina HumanHap550 BeadChip at the Feinstein Institute of Medical Research (Manhasset, NY). SLE subjects were participants from case collections at the following institutions/consortia: University of California, San Francisco (UCSF, n = 595), Autoimmune Biomarkers Collaborative Network (n = 301), University of Pittsburgh (n = 305), and the Multiple Autoimmune Disease Genetics Consortium (n = 110). Control subjects were obtained from the New York Health Project (NYHP, n = 294), and from iControlDB (n = 3046, http://www.illumina.com/science/icontroldb.ilmn).
Replication dataset
The replication dataset utilized genotyping data from GWAS of SLE published by The International Consortium on the Genetics of Systemic Lupus Erythematosus (SLEGEN) [9]. SLE subjects (n = 769) were obtained from case collections based at the following institutions: University of Minnesota (n = 255), Oklahoma Medical Research Foundation (OMRF, n = 239), UCSF (n = 93), University of California, Los Angeles (n = 85), Uppsala University (n = 62), and the University of Southern California (USC, n = 37). Controls (n = 3620) were provided by the following groups/institutions: iControlDB (n = 3032), NYHP (n = 490), OMRF (n = 90), and USC (n = 8). All SLE cases and 588 healthy controls in this dataset were genotyped for 317,501 SNPs on the Illumina Infinium HumanHap300 BeadChip at the Broad Institute Center for Genotyping and Analysis (Cambridge, MA). Genotypes for the remaining 3032 controls were obtained from iControlDB. Since both datasets utilized controls from the same publicly available databases, substantial overlap in controls was suspected. Therefore, we utilized 1142 healthy controls from the breast cancer study sponsored by the Cancer Genetic Markers of Susceptibility (CGEMS) project (http://cgems.cancer.gov/data/) [10] typed on the Illumina HumanHap500 BeadChip as additional controls for the replication dataset.
Data quality filters
The following data quality filters were applied separately to the discovery, replication, and CGEMS datasets: SNPs were removed from analysis if they had greater than 10% missing genotypes, a minor allele frequency less than 1%, or evidence of deviation from Hardy Weinberg equilibrium in the controls (p<1×10⁻⁴). Subjects were removed from analysis if their overall genotyping rate was <90%, were population outliers (more than 6 standard deviations from the mean along any of the first 10 principal components described below) or lacked information regarding anti–dsDNA autoantibody status. Duplicates and first degree relatives were identified using identity-by-state measures calculated in PLINK [12] (http://pngu.mgh.harvard.edu/purcell/plink/), and subjects typed in the discovery dataset were preferentially retained.
Imputation
We imputed the SNPs present on the Illumina HumanHap550 BeadChip (used for the discovery dataset) but absent on the Illumina HumanHap300 BeadChip for the SLEGEN cases and controls. Imputation was performed using IMPUTE version 1 [28] (http://www.stats.ox.ac.uk/~marchini/software/gwas/impute.html) and used CEPH subjects from the International HapMap Project release 21 (www.hapmap.org) as the reference. These SNPs were also imputed in 500 cases and 500 controls randomly selected from the discovery dataset. SNPs were removed from analysis if the imputation confidence score or the concordance between the imputed genotype and the actual genotype in the randomly selected subgroup was less than 90%. The data quality filters described above were also applied to the replication dataset after merging the imputed and assayed genotypes.
Genetic Risk Score
We calculated a SLE genetic risk score (GRS) based on 22 SNPs (or their proxy, if the listed SNP was not genotyped) with previously established evidence of association described in Gateva et al. [7]. The genetic risk score (GRS) was defined as the sum of the number of risk alleles for these SNPs. If a SNP was protective for SLE (OR <1.0), the major allele was considered the risk allele. Since omitting sporadic missing data would underestimate the number of risk alleles, we utilized the most likely genotype from SNP imputation (using the IMPUTE version 2 –pgs_miss option) for these calculations.
Anti–dsDNA autoantibody status
Anti–dsDNA autoantibody status for all SLE cases was determined by medical record review and/or serologic testing of banked serum. Since anti–dsDNA autoantibody status can fluctuate with disease activity, a SLE case had to have at least one definitively positive laboratory result to be considered anti–dsDNA +. A SLE subject was considered anti–dsDNA – if all laboratory results in the medical record and serologic testing for this autoantibody were negative.
Longitudinal anti–dsDNA autoantibody status (i.e., at least 2 individually documented measurements) was available for a subgroup of SLE cases (n = 722). These data were used for a sensitivity analysis, where anti–dsDNA + was defined as having at least 2 positive anti–dsDNA laboratory results in the longitudinal data, and anti–dsDNA – was defined as having all negative laboratory results for this autoantibody in the longitudinal data.
Statistical analysis
Three GWAS were performed: anti–dsDNA + SLE subjects versus healthy controls, anti–dsDNA – SLE subjects versus healthy controls, and anti–dsDNA + SLE subjects versus anti–dsDNA – SLE subjects (referred to as the case-only analysis). To determine if genetic associations were significantly different between the 2 anti–dsDNA subgroups, tests of heterogeneity were performed for previously identified SLE susceptibility loci. For these loci, the case-only analysis was also repeated using only the longitudinal dataset as a sensitivity analysis. Lastly, a genetic risk score analysis was conducted using logistic regression.
For each GWAS, associations with anti–dsDNA autoantibody status were assessed using additive logistic regression models implemented in PLINK and included the first 5 principal components as co-variates to adjust for population stratification. Principal components were calculated using EIGENSTRAT [29] (http://genepath.med.harvard.edu/~reich/Software.htm). After removal of SNPs in regions with extensive linkage disequilibrium on chromosomes 5 (44–51.5 Mb), 6 (25–33.5 Mb), 8 (8–12 Mb), 11 (45–57 Mb), and 17 (40–43 Mb), the remaining SNPs common to all of the genotyping platforms were used to calculate the principal components. The first 5 principal components were selected based on review of the eigenvalues for the first 10 principal components. A plot of the first two principal components for each individual in the study is shown in Figure S3. P-values for association were adjusted for the genomic control inflation factor (λGC) observed for each analysis after accounting for population stratification (Table S1). Each GWAS also included calculation of the expected p-value distribution using PLINK to determine the expected number of statistically significant SNPs.
Analyses were conducted separately for the discovery and replication datasets. These datasets were then combined into a “joint dataset” for maximal statistical power. The study source (discovery versus replication dataset) was included as a co-variate in analyses of the joint dataset. For the discovery and joint datasets, a p-value of less than 5E-07 was considered statistically significant, and p-values between 5E-07 and 1E-05 were considered suggestive of association. Statistically significant SNPs in the discovery dataset were examined in the replication dataset, where a p-value of less than 0.005 was considered statistically significant. Analyses of the discovery, replication, and joint datasets first used only the assayed SNPs. These analyses were repeated for the replication and joint datasets to include the imputed SNPs that passed the data quality filters, since the λGC was expected to differ in analyses using imputed SNPs.
Based on the publication by Gateva et al. [7], 22 SNPs with previously established evidence of association with SLE were analyzed further. For these SNPs (or their proxy, if the listed SNP was not genotyped), the association results for the SNP in two of the GWAS conducted above (anti–dsDNA + or - versus healthy controls) were compared using tests of heterogeneity (STATA 9.0/SE, College Station, TX). A p-value of less than 0.05 was considered significant evidence of heterogeneity. The results for these SNPs were also examined for the case-only analysis (including the sensitivity analysis with longitudinal data), where anti–dsDNA + SLE cases were compared to anti–dsDNA – SLE cases. A p-value of less than 0.05 was considered significant evidence of a differential association between the 2 subgroups. For comparison, the association with SLE was assessed using the logistic regression methods described above.
Associations between the SLE GRS and anti–dsDNA status were calculated using logistic regression models (STATA 9.0/SE, College Station, TX). These models utilized the SLE GRS as a continuous predictor, and adjusted for population stratification (using the first 5 principal components) and study source.
Supporting Information
Zdroje
1. PisetskyD
2001 Systemic Lupus Erythematosus: Epidemiology, Pathology, and Pathogenesis.
KlippelJ
Primer of the Rheumatic Diseases. 12 ed Atlanta Arthritis Foundation
2. ArbuckleMR
McClainMT
RubertoneMV
ScofieldRH
DennisGJ
2003 Development of autoantibodies before the clinical onset of systemic lupus erythematosus. N Engl J Med 349 1526 1533
3. BuyonJ
2008 Systemic Lupus Erythematosus: A. Clinical and Laboratory Features.
KlippelJ
Primer on the Rheumatic Diseases. 13 ed New York, NY Springer 303 318
4. IsenbergDA
MansonJJ
EhrensteinMR
RahmanA
2007 Fifty years of anti-ds DNA antibodies: are we approaching journey's end? Rheumatology (Oxford) 46 1052 1056
5. TanEM
CohenAS
FriesJF
MasiAT
McShaneDJ
1982 The 1982 revised criteria for the classification of systemic lupus erythematosus. Arthritis Rheum 25 1271 1277
6. HochbergMC
1997 Updating the American College of Rheumatology revised criteria for the classification of systemic lupus erythematosus. Arthritis Rheum 40 1725
7. GatevaV
SandlingJK
HomG
TaylorKE
ChungSA
2009 A large-scale replication study identifies TNIP1, PRDM1, JAZF1, UHRF1BP1 and IL10 as risk loci for systemic lupus erythematosus. Nat Genet 41 1228 1233
8. HomG
GrahamRR
ModrekB
TaylorKE
OrtmannW
2008 Association of systemic lupus erythematosus with C8orf13-BLK and ITGAM-ITGAX. N Engl J Med 358 900 909
9. HarleyJB
Alarcon-RiquelmeME
CriswellLA
JacobCO
KimberlyRP
2008 Genome-wide association scan in women with systemic lupus erythematosus identifies susceptibility variants in ITGAM, PXK, KIAA1542 and other loci. Nat Genet 40 204 210
10. HunterDJ
KraftP
JacobsKB
CoxDG
YeagerM
2007 A genome-wide association study identifies alleles in FGFR2 associated with risk of sporadic postmenopausal breast cancer. Nat Genet 39 870 874
11. AlarconGS
McGwinGJr
PetriM
ReveilleJD
Ramsey-GoldmanR
2002 Baseline characteristics of a multiethnic lupus cohort: PROFILE. Lupus 11 95 101
12. PurcellS
NealeB
Todd-BrownK
ThomasL
FerreiraMA
2007 PLINK: a tool set for whole-genome association and population-based linkage analyses. Am J Hum Genet 81 559 575
13. RemmersEF
PlengeRM
LeeAT
GrahamRR
HomG
2007 STAT4 and the risk of rheumatoid arthritis and systemic lupus erythematosus. N Engl J Med 357 977 986
14. GrahamRR
KozyrevSV
BaechlerEC
ReddyMV
PlengeRM
2006 A common haplotype of interferon regulatory factor 5 (IRF5) regulates splicing and expression and is associated with increased risk of systemic lupus erythematosus. Nat Genet 38 550 555
15. SigurdssonS
NordmarkG
GarnierS
GrundbergE
KwanT
2008 A risk haplotype of STAT4 for systemic lupus erythematosus is over-expressed, correlates with anti–dsDNA and shows additive effects with two risk alleles of IRF5. Hum Mol Genet 17 2868 2876
16. TaylorKE
RemmersEF
LeeAT
OrtmannWA
PlengeRM
2008 Specificity of the STAT4 genetic association for severe disease manifestations of systemic lupus erythematosus. PLoS Genet 4 e1000084 doi:10.1371/journal.pgen.1000084
17. BurgnerD
DavilaS
BreunisWB
NgSB
LiY
2009 A genome-wide association study identifies novel and functionally related susceptibility Loci for Kawasaki disease. PLoS Genet 5 e1000319 doi:10.1371/journal.pgen.1000319
18. FernandoMM
StevensCR
WalshEC
De JagerPL
GoyetteP
2008 Defining the role of the MHC in autoimmunity: a review and pooled analysis. PLoS Genet 4 e1000024 doi:10.1371/journal.pgen.1000024
19. BarcellosLF
MaySL
RamsayPP
QuachHL
LaneJA
2009 High-density SNP screening of the major histocompatibility complex in systemic lupus erythematosus demonstrates strong evidence for independent susceptibility regions. PLoS Genet 5 e1000696 doi:10.1371/journal.pgen.1000696
20. TaylorKE
ChungSA
GrahamRR
OrtmannWA
LeeAT
2011 Risk alleles for systemic lupus erythematosus in a large case-control collection and associations with clinical subphenotypes. PLoS Genet 7 e1001311 doi:10.1371/journal.pgen.1001311
21. van der Helm-van MilAH
VerpoortKN
BreedveldFC
HuizingaTW
ToesRE
2006 The HLA-DRB1 shared epitope alleles are primarily a risk factor for anti-cyclic citrullinated peptide antibodies and are not an independent risk factor for development of rheumatoid arthritis. Arthritis Rheum 54 1117 1121
22. MorganAW
RobinsonJI
ConaghanPG
MartinSG
HensorEM
2010 Evaluation of the rheumatoid arthritis susceptibility loci HLA-DRB1, PTPN22, OLIG3/TNFAIP3, STAT4 and TRAF1/C5 in an inception cohort. Arthritis Res Ther 12 R57
23. LeeHS
RemmersEF
LeJM
KastnerDL
BaeSC
2007 Association of STAT4 with rheumatoid arthritis in the Korean population. Mol Med 13 455 460
24. CooperGS
GilbertKM
GreidingerEL
JamesJA
PfauJC
2008 Recent advances and opportunities in research on lupus: environmental influences and mechanisms of disease. Environ Health Perspect 116 695 702
25. Sarzi-PuttiniP
AtzeniF
IaccarinoL
DoriaA
2005 Environment and systemic lupus erythematosus: an overview. Autoimmunity 38 465 472
26. McCartyDJ
ManziS
MedsgerTAJr
Ramsey-GoldmanR
LaPorteRE
1995 Incidence of systemic lupus erythematosus. Race and gender differences. Arthritis Rheum 38 1260 1270
27. JohnsonAE
GordonC
PalmerRG
BaconPA
1995 The prevalence and incidence of systemic lupus erythematosus in Birmingham, England. Relationship to ethnicity and country of birth. Arthritis Rheum 38 551 558
28. MarchiniJ
HowieB
MyersS
McVeanG
DonnellyP
2007 A new multipoint method for genome-wide association studies by imputation of genotypes. Nat Genet 39 906 913
29. PriceAL
PattersonNJ
PlengeRM
WeinblattME
ShadickNA
2006 Principal components analysis corrects for stratification in genome-wide association studies. Nat Genet 38 904 909
Štítky
Genetika Reprodukční medicínaČlánek vyšel v časopise
PLOS Genetics
2011 Číslo 3
Nejčtenější v tomto čísle
- Whole-Exome Re-Sequencing in a Family Quartet Identifies Mutations As the Cause of a Novel Skeletal Dysplasia
- Origin-Dependent Inverted-Repeat Amplification: A Replication-Based Model for Generating Palindromic Amplicons
- FUS Transgenic Rats Develop the Phenotypes of Amyotrophic Lateral Sclerosis and Frontotemporal Lobar Degeneration
- Limited dCTP Availability Accounts for Mitochondrial DNA Depletion in Mitochondrial Neurogastrointestinal Encephalomyopathy (MNGIE)