
Quantitative Fitness Analysis Shows That NMD Proteins and Many Other Protein Complexes Suppress or Enhance Distinct Telomere Cap Defects
To better understand telomere biology in budding yeast, we have performed systematic suppressor/enhancer analyses on yeast strains containing a point mutation in the essential telomere capping gene CDC13 (cdc13-1) or containing a null mutation in the DNA damage response and telomere capping gene YKU70 (yku70Δ). We performed Quantitative Fitness Analysis (QFA) on thousands of yeast strains containing mutations affecting telomere-capping proteins in combination with a library of systematic gene deletion mutations. To perform QFA, we typically inoculate 384 separate cultures onto solid agar plates and monitor growth of each culture by photography over time. The data are fitted to a logistic population growth model; and growth parameters, such as maximum growth rate and maximum doubling potential, are deduced. QFA reveals that as many as 5% of systematic gene deletions, affecting numerous functional classes, strongly interact with telomere capping defects. We show that, while Cdc13 and Yku70 perform complementary roles in telomere capping, their genetic interaction profiles differ significantly. At least 19 different classes of functionally or physically related proteins can be identified as interacting with cdc13-1, yku70Δ, or both. Each specific genetic interaction informs the roles of individual gene products in telomere biology. One striking example is with genes of the nonsense-mediated RNA decay (NMD) pathway which, when disabled, suppress the conditional cdc13-1 mutation but enhance the null yku70Δ mutation. We show that the suppressing/enhancing role of the NMD pathway at uncapped telomeres is mediated through the levels of Stn1, an essential telomere capping protein, which interacts with Cdc13 and recruitment of telomerase to telomeres. We show that increased Stn1 levels affect growth of cells with telomere capping defects due to cdc13-1 and yku70Δ. QFA is a sensitive, high-throughput method that will also be useful to understand other aspects of microbial cell biology.
Published in the journal:
. PLoS Genet 7(4): e32767. doi:10.1371/journal.pgen.1001362
Category:
Research Article
doi:
https://doi.org/10.1371/journal.pgen.1001362
Summary
To better understand telomere biology in budding yeast, we have performed systematic suppressor/enhancer analyses on yeast strains containing a point mutation in the essential telomere capping gene CDC13 (cdc13-1) or containing a null mutation in the DNA damage response and telomere capping gene YKU70 (yku70Δ). We performed Quantitative Fitness Analysis (QFA) on thousands of yeast strains containing mutations affecting telomere-capping proteins in combination with a library of systematic gene deletion mutations. To perform QFA, we typically inoculate 384 separate cultures onto solid agar plates and monitor growth of each culture by photography over time. The data are fitted to a logistic population growth model; and growth parameters, such as maximum growth rate and maximum doubling potential, are deduced. QFA reveals that as many as 5% of systematic gene deletions, affecting numerous functional classes, strongly interact with telomere capping defects. We show that, while Cdc13 and Yku70 perform complementary roles in telomere capping, their genetic interaction profiles differ significantly. At least 19 different classes of functionally or physically related proteins can be identified as interacting with cdc13-1, yku70Δ, or both. Each specific genetic interaction informs the roles of individual gene products in telomere biology. One striking example is with genes of the nonsense-mediated RNA decay (NMD) pathway which, when disabled, suppress the conditional cdc13-1 mutation but enhance the null yku70Δ mutation. We show that the suppressing/enhancing role of the NMD pathway at uncapped telomeres is mediated through the levels of Stn1, an essential telomere capping protein, which interacts with Cdc13 and recruitment of telomerase to telomeres. We show that increased Stn1 levels affect growth of cells with telomere capping defects due to cdc13-1 and yku70Δ. QFA is a sensitive, high-throughput method that will also be useful to understand other aspects of microbial cell biology.
Introduction
Linear chromosome ends must be protected from the DNA damage response machinery and from shortening of chromosome ends during DNA replication [1], [2]. Chromosome ends therefore adopt specialized structures called telomeres, distinct from double-stranded DNA breaks elsewhere in the genome. Telomeric DNA is protected, or capped and replicated by a large number of different DNA-binding proteins in all eukaryotic cell types [2], [3].
In budding yeast, numerous proteins contribute to telomere capping and amongst these are two critical protein complexes, the Yku70/Yku80 (Ku) heterodimer and the Cdc13/Stn1/Ten1 (CST) heterotrimeric complex [4]. Orthologous protein complexes play roles at telomeres in other eukaryotic cell types suggesting that understanding the function of the Ku and CST protein complexes in budding yeast will be generally informative about key aspects of eukaryotic telomere structure and function.
In budding yeast Yku70 is a non-essential protein that has multiple roles in DNA repair and at telomeres, being involved in the non-homologous end-joining (NHEJ) DNA repair pathway, in the protection of telomeres and the recruitment of telomerase. The mammalian orthologue, Ku70, has similar properties [5]. In budding yeast, deletion of the YKU70 gene (yku70Δ) results in short telomeres and temperature sensitivity [6]. At high temperatures, cells lacking Yku70 accumulate ssDNA at telomeres, which activates the DNA damage response and leads to cell-cycle arrest [7], [8], [9].
Cdc13 is a constituent of the essential budding yeast Cdc13-Stn1-Ten1 (CST) protein complex which is analogous to the CST complex found recently in mammalian, plant and fission yeast cells [10], [11]. Cdc13 binds to ssDNA overhangs at telomeres and functions in telomerase recruitment and telomere capping [12], [13], [14]. Acute inactivation of Cdc13 by the temperature sensitive cdc13-1 allele induces ssDNA generation at telomeres and rapid, potent checkpoint-dependent cell cycle arrest [14].
cdc13-1 or yku70Δ mutations each cause temperature dependent disruption of telomere capping that is accompanied by ssDNA production, cell-cycle arrest and cell death [7], [15]. Interestingly, the poor growth imparted by each mutation can be suppressed by deletion of EXO1, removing the Exo1 nuclease that contributes to ssDNA production when either Cdc13 or Yku70 is defective [7]. However, cdc13-1 and yku70Δ mutations show a synthetic poor growth interaction [8] and different checkpoint pathways are activated by each mutation [7]. These latter observations, along with numerous others, show that CST and Ku complexes perform distinct roles capping budding yeast telomeres and that further clarification of their functions at the telomere is important to help understand how eukaryotic telomeres function.
Many insights into the telomere cap and the DNA damage responses induced when capping is defective were first identified as genetic interactions. For example all DNA damage checkpoint mutations suppress the temperature sensitive growth of cdc13-1 mutants [16], but only a subset of these suppress the temperature sensitive growth of yku70Δ mutants [7]. We reasoned that the roles of Cdc13 and Yku70 at telomeres could be further understood by quantitative, systematic analysis of genetic interactions between telomere capping mutations and a genome-wide collection of gene deletions.
We used standard synthetic genetic array (SGA) approaches to combine the systematic gene deletion collection with cdc13-1 and yku70Δ mutations [17], [18]. After this, strain fitnesses were measured at a number of temperatures by quantitative fitness analysis (QFA). For QFA, liquid cultures were spotted onto solid agar plates and culture growth was followed by time course photography. Images were processed and fitted to a logistic growth model to allow an accurate estimation of growth parameters, such as doubling time. In other high-throughput experiments such as SGA or EMAP approaches, culture fitness is determined from colony size [17], [18], [19]. In QFA, analysis of growth curves of cultures grown on solid agar plates allows us to measure fitness more precisely.
Through QFA we identify hundreds of gene deletions, in numerous different classes, showing genetic interactions with cdc13-1, yku70Δ or both. One particularly striking example of the type of genetic interactions we measured by QFA is between deletions affecting nonsense mediated RNA decay pathways (upf1Δ, upf2Δ, upf3Δ), cdc13-1 and yku70Δ. Additional experiments show that disabling nonsense mediated mRNA decay pathways, using upf2Δ as an example, suppresses the cdc13-1 defect but enhances the yku70Δ defect by increasing the levels of the telomere capping protein Stn1. QFA is generally applicable and will be useful for understanding other aspects of yeast cell biology or studying other microorganisms.
Results
QFA identifies gene deletions that interact with cdc13-1 and yku70Δ
To systematically examine genetic interactions between a genome-wide collection of gene deletion strains (yfgΔ, your favorite gene deletion, to indicate any of ∼4200 viable systematic gene deletions) and mutations causing telomere capping defects we crossed the knockout library to cdc13-1 or yku70Δ mutations, each affecting the telomere, or to a neutral control query mutation (ura3Δ) using SGA methodology [17], [18]. Since both cdc13-1 and yku70Δ mutations cause temperature sensitive defects, we generated all double mutants at low, permissive temperatures before measuring the growth of double mutants at a number of semi-permissive or non-permissive temperatures. We cultured yku70Δ yfgΔ strains at 23°C, 30°C, 37°C and 37.5°C, cdc13-1 yfgΔ strains at 20°C, 27°C and 36°C and ura3Δ yfgΔ strains at 20°C, 27°C and 37°C and measured fitness.
Double mutant fitness was measured after spotting of dilute liquid cultures onto solid agar. We estimate approximately 100 separate cells were placed in each of 384 spots on each agar plate. Fitness of thousands of individual cultures, each derived from spotted cells, was deduced by time course photography of agar plates followed by image processing, data analysis, fitting of growth measurements to a logistic model and determination of quantitative growth parameters (Figure 1) [20], [21], [22]. We fitted logistic growth model parameters to growth curves allowing us to estimate maximum doubling rate (MDR, population doublings/day) and maximum doubling potential (MDP, population doublings) of approximately 12,000 different yeast genotypes (e.g. cdc13-1 yfg1Δ, yku70Δ yfg1Δ, etc.) at several temperatures. At least eight independent biological replicates for each strain at each temperature were cultured and repeatedly photographed, capturing more than 4 million images in total. To rank fitness we assigned equal importance to maximum doubling rate and maximum doubling potential and defined strain fitness as the product of the MDR and MDP values (Fitness, F, population doublings2/day). Other measures of fitness can be derived from the sets of logistic parameters available from Text S1.

Figure 1A shows approximately 170 example images, corresponding to eight independent time courses for each of three pair-wise combinations of yku70Δ, ura3Δ and upf2Δ mutations. These example images clearly show, qualitatively, that upf2Δ yku70Δ strains grow less well than yku70Δ ura3Δ strains, which in turn grow less well than upf2Δ ura3Δ strains at 37°C. These fitness measures are consistent with numerous earlier studies, showing that yku70Δ mutants do not grow well at high temperatures, but also demonstrate a novel observation, that the upf2Δ mutation enhances the yku70Δ defect and this is further investigated below. Images like those in Figure 1A were processed, quantified, plotted and logistic growth curves fitted to the data (Figure 1B). We applied QFA to all genotypes at each temperature, as the three examples in Figure 1C illustrate.
QFA of telomere capping mutants
QFA of cdc13-1 yfgΔ, yku70Δ yfgΔ and ura3Δ yfgΔ double mutant libraries was performed at a number of temperatures and therefore a variety of informative comparisons were possible. For example to help identify gene deletions that suppress or enhance the yku70Δ temperature dependent growth defect it is useful to compare the fitness of yku70Δ yfgΔ cells incubated at 37.5°C, with that of control, ura3Δ yfgΔ, cells incubated at 37°C. In Figure 2, genes which, when deleted, suppress the yku70Δ phenotype at 37.5°C will be positioned above the linear regression line and enhancers of yku70Δ defects below the line. yfgΔ mutations that result in low fitness when combined with the neutral ura3Δ mutation will be found on the left and those with high fitness on the right of the x-axis.

The location of each gene in Figure 2 indicates the effect of each deletion on fitness of yku70Δ strains versus the effect of the deletion on fitness of ura3Δ strains. The regression line drawn through all data points (solid gray line) indicates the expected yku70Δ yfgΔ fitness given the fitness of the corresponding ura3Δ yfgΔ mutant. The line of equal growth (dashed gray line) shows the expected positions of yku70Δ yfgΔ strains if they grew similarly to ura3Δ yfgΔ strains. Comparing the linear regression with the line of equal growth, it is clear that yku70Δ mutants grow poorly relative to control ura3Δ mutants, as expected due to the temperature dependent telomere uncapping observed in yku70Δ mutants. Figure 2 also highlights large numbers of yku70Δ yfgΔ strains growing significantly better than expected, given the fitness of the equivalent ura3Δ yfgΔ mutation at 37°C (red data points, Figure 2) and these yfgΔ genes can be classified as yku70Δ suppressors. There are also large numbers of yku70Δ yfgΔ strains that grow worse than expected and these are classified as yku70Δ enhancers (green data points, Figure 2). Three further example plots comparing growth of yfgΔ cdc13-1 versus yfgΔ ura3Δ at 20°C; yfgΔ cdc13-1 versus yfgΔ ura3Δ at 27°C and yfgΔ ura3Δ at 37°C versus yfgΔ ura3Δ at 20°C are shown in Figure S1 and others can be found on our supporting information data files website.
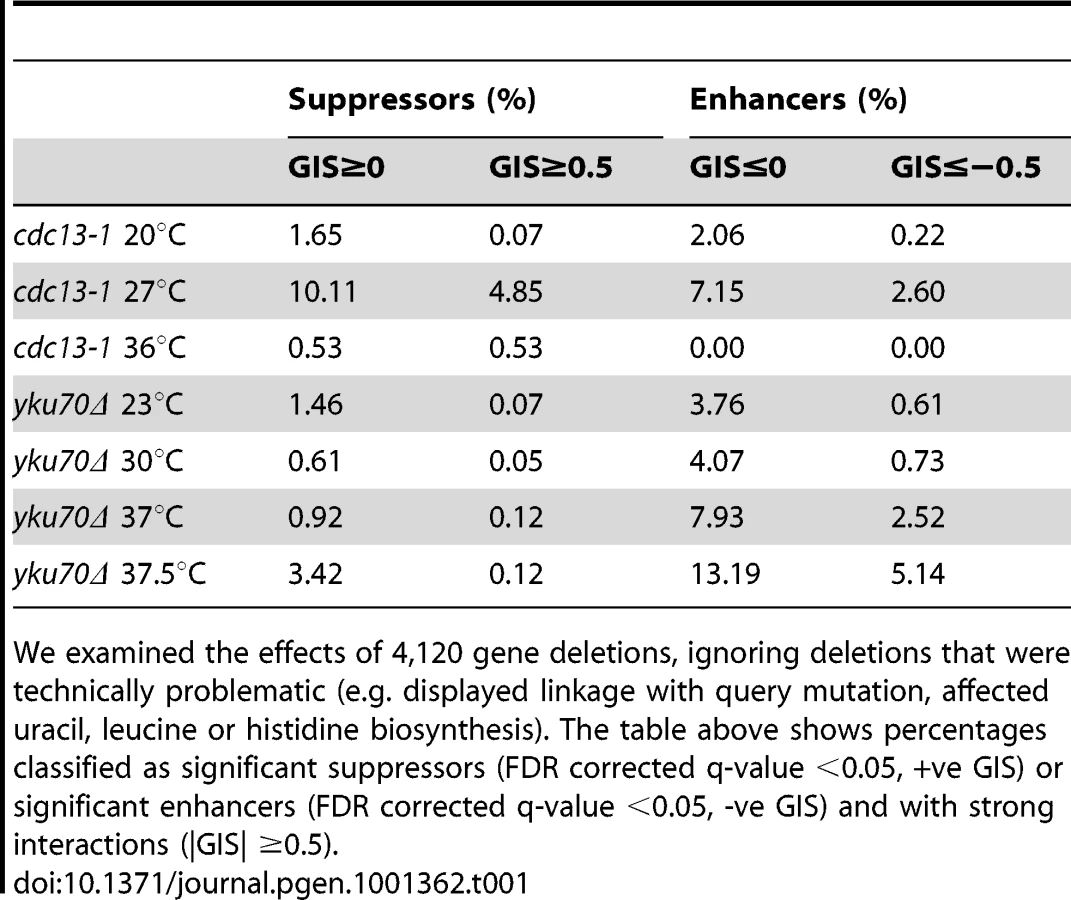
We estimated genetic interaction strength (GIS) as the vertical displacement of each yku70Δ yfgΔ normalised mutant fitness from the expected normalised fitness, with expected fitness given by a linear regression model (see Text S1, experimental procedures). GIS is dimensionless. This method is equivalent to defining GIS as the deviation of observed fitness from that expected if a multiplicative model of genetic interaction were correct. In all, more than 30,000 genetic interaction strengths, together with their statistical significances, were calculated (Tables S1, S2, S3, S4, S5, S6). Table 1 summarizes the numbers of statistically significant genetic interactions observed under the different conditions of telomere capping. Table 1 clearly illustrates that many more genetic interactions are observed under conditions of mild telomere uncapping (cdc13-1 strains at 27°C and yku70Δ strains at 37.5°C) and that at these temperatures around 5% of gene deletions can show strong suppressing or enhancing interactions (GIS >0.5).
Comparing genetic interactions between cdc13-1 and yku70Δ
In order to compare the effects of gene deletions on cell fitness when combined with cdc13-1 or yku70Δ induced telomere cap defects, it was particularly useful to compare the GIS of each gene with respect to cdc13-1 or yku70Δ after induced telomere uncapping. Figure 3 summarises how different gene deletions interact with the two types of telomere capping defect, suppressing, enhancing or showing no strong interaction with each telomere cap defect. For example, genes that when deleted significantly suppress temperature sensitivity of both cdc13-1 and yku70Δ mutants appear in the top right of this plot (Figure 3, region 3). EXO1 is in this area as expected because Exo1 generates ssDNA at telomeres in both types of telomere capping mutants (Figure 3, region 2/3, arrow) [7]. Deleting components of the checkpoint sliding clamp (9-1-1 complex) and its clamp loader, suppress cdc13-1 but have minor effects on growth of yku70Δ mutants [7]. DDC1, RAD17 and RAD24 are in region 2, as expected. MEC3, encoding the third component of the sliding clamp was missing from our knock out library and was not tested. Gene deletions that disrupt the telomerase enzyme directly (est1Δ, est3Δ) enhance the temperature sensitivity of both mutations and so appear in region 7. Genes that, when deleted, suppress cdc13-1 yet enhance the yku70Δ temperature sensitivity (Figure 3, region 1) represent a novel telomere-related phenotype and interestingly include three major components of the nonsense mediated RNA decay pathways (UPF1, UPF2, UPF3). It is reassuring that the UPF genes cluster so closely in Figure 3 because this strongly suggests that positioning of genes on this plot is an accurate measure of the function of the corresponding gene products in telomere biology.
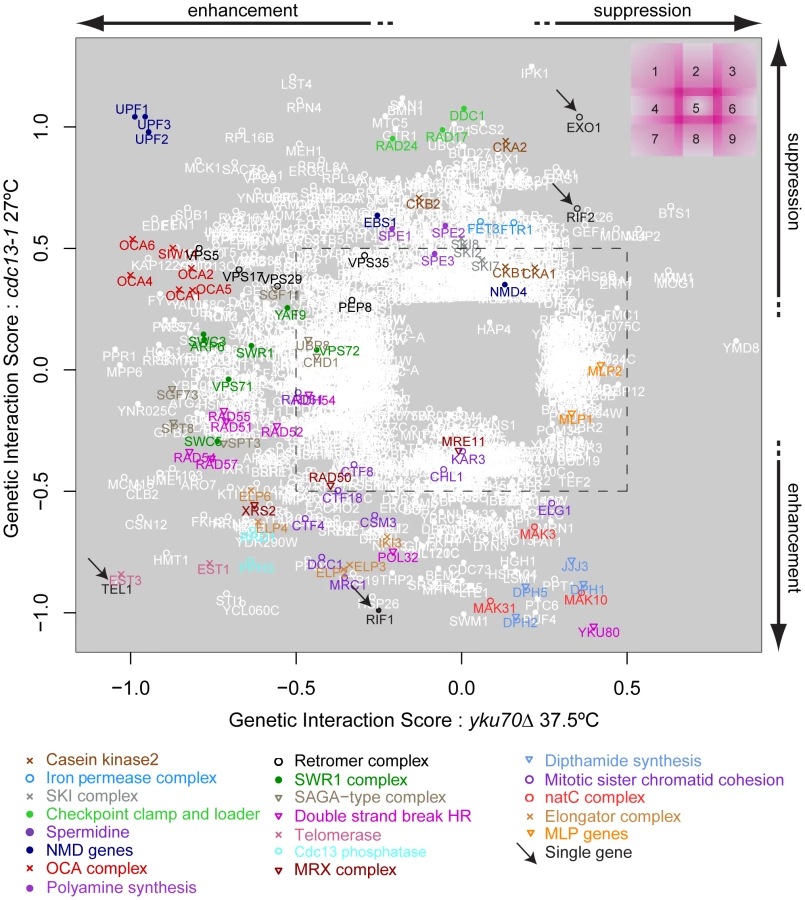
The position of YKU80 in the bottom right corner of region 8 is informative. The negative interaction of yku80Δ with cdc13-1 is expected since it is known that yku80Δ (and yku70Δ) mutations reduce fitness of cdc13-1 mutants, even at permissive temperatures [8]. However, the positive effect of yku80Δ on the growth of yku70Δ mutants appears, at first, surprising. The positive epistatic effect simply reflects the fact that yku70Δ, yku80Δ and yku70Δ yku80Δ double mutants are all similarly unfit at high temperatures. We have confirmed that in the different W303 genetic background that yku70Δ, yku80Δ and yku70Δ yku80Δ double mutants are all similarly unfit at high temperatures. According to the multiplicative model of epistasis the fitness of the yku70Δ yku80Δ double mutants is significantly higher than expected based on the fitness of the single mutants. Thus, by this criterion, yku80Δ suppresses the yku70Δ fitness defect. These data can be explained if neither single sub-unit of the Ku comlex retains a telomere capping function in the absence of the other.
It is reasonable to hypothesize, based partly on the behaviour of UPF1, UPF2 and UPF3 genes, that genes having similar genetic interactions with cdc13-1 and yku70Δ under particular conditions which are proximal in Figure 3 share similar functions in telomere biology. For example, genes that function similarly to EXO1 and for example, regulate ssDNA at uncapped telomeres might appear close to EXO1 in Figure 3. Similarly, genes with strong effects on telomerase function might appear in region 7. Consistent with this hypothesis, it is clear from Figure 3 that many genes encoding members of the same protein complex, or proteins which work together to perform a particular function, often have similar genetic interaction profiles and are located in similar positions on this plot. Examples in Figure 3 include: NMD pathway (UPF1, UPF2, UPF3, region 1); OCA complex (regions 1 & 4); clamp-loader and clamp-like complex (RAD24, DDC1, RAD17, region 2); telomerase (EST1, EST3, region 7) and dipthamide biosynthesis (JJJ3, DPH1, DPH2, DPH5, regions 8 & 9) genes, as well as the numerous other complexes highlighted by the key at the bottom of Figure 3. Table 2 shows the number of genes found in each section of Figure 3. Table 3 lists 19 different sets of genes that are functionally or physically related and that cluster in Figure 3 as well as the single genes EXO1, RIF1, RIF2 and TEL1 also found in interesting positions. EXO1 is in its expected position but it is interesting that RIF1 and RIF2 are found in different positions in Figure 3, suggesting they have different functions in telomere biology. Further experiments in the W303 genetic background confirm the different interactions of RIF1 and RIF2 with cdc13-1 (Xue, Rushton and Maringele, submitted). TEL1 encodes the ATM orthologue and is required for telomere maintenance and it clusters very near components of telomerase, in region 7.


Groupings such as these and their positioning on this type of plot help generate testable, mechanistic predictions about the roles of proteins/protein complexes on telomere capping in budding yeast. For example, we predict that NMD genes (which we examine further in this study) and dipthamide synthesis genes have opposing effects on both Cdc13-mediated and Yku70-mediated telomere capping, because they lie in opposite corners of Figure 3.
The QFA experiments summarised by Figure 3 were performed in a high-throughput manner with the systematic knock out collection in the S288C genetic background and the fitness of different query mutants was measured in slightly different types of media. It was therefore conceivable that some of the genetic interactions scored were due to: defects in the knock out collection, such as incorrect mutations being present or the presence of suppressor mutations, the S288C genetic background, subsets of the cell populations that progressed through the mass mating, sporulation and germination that occur during SGA or media differences.
To test whether genetic interactions identified by QFA with cdc13-1 or yku70Δ strains were robust observations we retested a subset of interactions in the W303 genetic background, on rich media, after construction of strains by individual tetrad dissection by manual spot test. Figure 4 and Figure S2 show the behaviour of a number of gene deletions chosen from different regions in Figure 3 to test the effects in W303. In all we measured 26 genetic interactions between 13 gene deletions and cdc13-1 or yku70Δ. Of these we estimate that 20/26 interactions were as expected, 5/26 difficult to classify, and 1/26, due to elp6Δ, opposite to that expected after QFA. In particular exo1Δ, mlp1Δ, mlp2Δ, mak31Δ and dph1Δ mutations suppress the growth defects of yku70Δ strains in W303 at 36°C, consistent with their position on the right side of Figure 3 and exo1Δ, rad24Δ, upf1Δ and upf2Δ strongly suppress cdc13-1 at 26°C consistent with their position near the top of Figure 3. upf1Δ, upf2Δ, rrd1Δ and pph3Δ mutations all reduced growth of yku70Δ strains at 36°C consistent with their position on the left of Figure 3, while elp6Δ, mak31Δ, dph2Δ, rrd1Δ and pph3Δ mutations all enhanced cdc13-1 growth defects consistent with their positions near the bottom of Figure 3. Other genes have more subtle effects, the oca1Δ and oca2Δ mutations had marginal effects on yku70Δ strains but improved growth of cdc13-1 strains (Figure S2). Interestingly the elp6Δ mutation enhanced the cdc13-1 defect at 26°C, as expected, but suppressed the yku70Δ strain growth defect at 36°C, the opposite of what was expected from Figure 3. Further experiments will be necessary to clarify the role of Elp6 and other elongator factors in cells with uncapped telomeres. However, overall, it is clear that the majority of genetic interactions identified by QFA are reproducible in smaller scale experiments in a different genetic background.

Analysis of fitness at other temperatures
Suppressors and enhancers of the cdc13-1 and yku70Δ phenotypes were most easily identified at semi-permissive temperatures for the query mutations (Figure 2, Figure 3), however QFA at other temperatures also proved informative. For example, comparison of the fitness of yfgΔ ura3Δ strains at 37°C versus 20°C, allowed us to identify temperature sensitive mutants (Figure S1C and Table S9). Of the 57 genes which were categorized with a phenotype of “heat sensitivity: increased” in the Saccharomyces Genome Database (http://www.yeastgenome.org), as identified by low though-put experiments, which were also present in the knockout library we used, 45 (79% of total) were identified as being significantly heat sensitive by our independent QFA.
2-dimensional GIS plots, like Figure 3, also proved useful for identifying broader patterns of genetic interactions. For example, we observed a difference between the effects of deleting small and large ribosomal subunit genes on the growth of telomere capping mutants (Figure S3A, S3B). Gene deletions which affect the small ribosomal subunit are generally neutral with both cdc13-1 and yku70Δ mutations (Figure S3A, S3B red). In contrast, disruptions of large ribosomal subunit function suppress the effect of cdc13-1 on average and enhance that of yku70Δ (Figure S3A, S3B blue). Although the basis for this novel observation is unknown it may be related to the finding that the large ribosome sub-unit is subject to autophagy upon starvation, whereas the small ribosome sub-unit is not [23]. Positive and negative regulators of telomere length [24], [25], [26] also showed differing distributions in GIS comparisons – gene deletions which suppress the yku70Δ defect are more likely to result in long than short telomeres (Figure S3C). This is perhaps to be expected since yku70Δ mutants, on their own, have a short telomere phenotype. Importantly, over 90% of genes identified as suppressors of cdc13-1 in a previous study [20] showed a positive GIS with cdc13-1 (Figure S2D), demonstrating that QFA reproduces conclusions derived from qualitatively scored visual inspection. It should be noted however, that the improved sensitivity of QFA has allowed identification of significantly more enhancing mutations than were indentified in the preceding, qualitatively scored study [20].
QFA is sensitive enough to permit identification of genetic interactions even where gene deletions combined with the control ura3Δ query mutation impart a poor growth phenotype. For example, deletion of all three SPE genes resulted in low fitness that was strongly rescued by cdc13-1 (Figure S1B, blue, Figure 3 region 2). Interestingly it has recently been reported that increasing spermidine levels increases lifespan in organisms such as yeast, flies and worms [27], but no previous connection with telomeres has been made. Telomere-driven, replicative senescence is thought to be a significant component of the ageing phenotype. Our observations of interactions between SPE genes and cells with uncapped telomeres may ultimately lead to experiments to provide insight into the mechanisms by which spermidine affects lifespan.
NMD and telomere capping
One of the most striking results obtained from QFA experiments was the effect of deleting nonsense mediated RNA decay genes on growth of cells with telomere capping mutations. Deletion of any of the NMD genes UPF1, UPF2 or UPF3 suppresses the cdc13-1 telomere capping defect but enhances the yku70Δ defect (Figure 3, region 1). We wanted to understand the basis of this interesting interaction and decided to further analyze the NMD genes. We also investigated EBS1, a gene that has proposed roles in both the NMD pathway and telomere function [28], [29], [30] and was identified previously as interacting with CDC13 [20], [31]. EBS1 had less strong, but qualitatively similar GISs to UPF genes in our analysis (Figure 3, region 1∼2), suggesting that the position of EBS1 in Figure 3 was due a partial defect in nonsense mediated RNA decay.
One potential mechanism by which UPF genes and EBS1 affect telomere capping is if they regulate the levels of telomere capping proteins. Indeed, UPF genes have been shown to regulate transcripts of genes involved in telomere function [32], [33]. The effect of EBS1 on these transcripts has not so far been reported. Therefore we compared mRNA levels of three NMD targets with roles in telomere regulation (STN1, TEN1 and EST2) in upf2Δ, ebs1Δ and wild-type strains. Transcripts of STN1 and TEN1 were increased significantly in upf2Δ and ebs1Δ, mutants whereas EST2 transcripts were increased only in upf2Δ strains (Figure 5A). We conclude that both EBS1 and UPF2 modulate expression of STN1 and TEN1, but the effects of ebs1Δ are modest compared to those of upf2Δ. Furthermore, elevated levels of Stn1 protein were detected in both ebs1Δ and upf2Δ mutants (Figure 5B). Consistent with the measured mRNA levels of STN1, the increase in Stn1 levels was smaller in ebs1Δ strains than upf2Δ strains. Thus we concluded that the effects of UPF2 and EBS1 could be due to the effects on Stn1 and possibly Ten1 levels.

Increased Stn1 and Ten1 levels are known to suppress the cdc13-1 defect [33], [34]. To test whether elevated levels of Stn1 or Ten1 proteins could reproduce the enhancement of the yku70Δ defect observed in ebs1Δ and upf2Δ mutants, we over-expressed Stn1 and Ten1 independently of NMD by providing extra copies of STN1 and TEN1 on plasmids. Both single copy (centromeric; Figure 5C) and high copy (2 µ) Stn1-expressing plasmids [35] suppressed the temperature sensitivity of cdc13-1 strains and enhanced the temperature sensitivity of yku70Δ strains (Figure S4A), mimicking the upf2Δ and ebs1Δ phenotypes. In contrast, Ten1-expressing plasmids [35] did not affect the growth of either cdc13-1 or yku70Δ mutants (Holstein; data not shown). We therefore conclude that both UPF2 and EBS1 affect telomere capping by modulating expression of STN1. However, it is also possible that UPF2 and EBS1 affect telomere capping by modulating expression of genes other than STN1. To test this and the relative contribution of STN1 versus any other mechanisms, it would be informative to reduce STN1 expression in upf2Δ mutants. Such experiments might be difficult to perform and interpret since both centromeric single-copy and 2 micron multi-copy STN1 plasmids suppress the cdc13-1 defect to similar extents (Figure S4A), suggesting there is not a simple correlation between Stn1 levels and effects on growth of cdc13-1 and yku70Δ mutants.
Since the effect of ebs1Δ was milder than that of upf2Δ on the fitness of cdc13-1 and yku70Δ cells (Figure 3), we hypothesized that if ebs1Δ imparts a mild NMD defect, an ebs1Δ upf2Δ double mutation would result in the same phenotype as upf2Δ on its own. Figure 5D shows that both upf2Δ and ebs1Δ mutations suppress cdc13-1 temperature sensitivity and exacerbate yku70Δ temperature sensitivity in the W303 genetic background. We also confirmed that upf1Δ upf2Δ double mutants suppress cdc13-1 temperature sensitivity and exacerbate yku70Δ temperature similarly to either single mutant (Figure S4B). It is clear that the effects of ebs1Δ are less strong than upf2Δ mutations and interestingly upf2Δ ebs1Δ double mutants have slightly stronger effects on growth of both cdc13-1 and yku70Δ mutants, suggesting that ebs1Δ effects are not solely due to defects in nonsense mediated RNA decay (Figure 5D). We therefore conclude that, at least with respect to telomere capping, EBS1 and UPF2 act partially through different pathways. We do not yet understand these differences, but they may be related to the homology between Ebs1 and the telomerase protein Est1.
It is simple to hypothesize why increased Stn1 levels, caused by inactivation of nonsense mediated mRNA decay pathways, suppress the cdc13-1 defect, presumably by stabilizing the Cdc13-1/Stn1/Ten1 complex at telomeres. It is less simple to explain why increased Stn1 levels enhance the yku70Δ-induced telomere-capping defect. Our hypothesis is based on the facts that the Stn1 protein can inhibit telomerase activity [36], [37] and that Yku70 interacts with and helps recruit telomerase to telomeres [38], [39]. Thus we hypothesized that yku70Δ causes a partial defect in telomerase recruitment, one that is exacerbated by the upf2Δ mutation that causes high levels of Stn1, thus inhibiting telomerase activity. To test the simplest version of this hypothesis, that yku70Δ and upf2Δ mutations reduce the amount of telomerase binding to telomeres, we performed ChIP analyses. We examined binding of the Est2 sub-unit of telomerase in yku70Δ, upf2Δ and yku70Δ upf2Δ double mutants. Interestingly we observed a significant reduction in binding of telomerase to telomeres in yku70Δ, upf2Δ and yku70Δ upf2Δ mutants (Figure 5E). It is known that yku70Δ mutants recruit less telomerase to telomeres [39] but we are unaware of any other reports showing that upf2Δ mutants recruit less telomerase to telomeres. This observation most likely explains the short telomere phenotype of upf2Δ (as well as yku70Δ) mutants [24], [25]. It is noteworthy that although the upf2Δ mutation causes a four-fold increase in the EST2 transcript, it causes a reduction in the amount of Est2 bound to telomeres. This suggests that the increased levels of Stn1in upf2Δ cells more than counteracts any mass action effects on telomerase recruitment to telomeres caused by EST2 over-expression. However, the simple hypothesis that yku70Δ upf2Δ mutants show a more severe capping defect because of a reduction in the recruitment of telomerase appears not to be valid. Further experiments will be necessary to better understand the complex interplay between Ku, nonsense mediated decay pathways, Cdc13, Stn1 and telomere capping (Figure 6).

Discussion
Systematic measurement of genetic interactions is a powerful way to help understand how cells and organisms function [40], [41]. This is because genetic approaches examine the role of individual gene products, or individual residues in genes, in the context of the whole organism and can help dissect the effects of weak biochemical interactions that are important for cells to function [42]. Systematic SGA and eMAP experiments typically examine millions of genetic interactions and use comparatively crude measures of growth (colony size) to infer genetic interactions [19], [41]. Here we have more accurately measured a smaller number of genetic interactions, focusing on interactions that affect budding yeast telomere function. The telomere is an important and interesting subject for systematic genetic analysis because it is a complex, subtle and in some senses paradoxical nucleic acid/protein structure that plays critical roles during human ageing and carcinogenesis. One paradox of telomeres is that many DNA damage response proteins, which induce DNA repair or cell cycle arrest when interacting elsewhere in the genome, induce neither response at telomeres but instead play important roles in telomere physiology.
We used Quantitative Fitness Analysis (QFA) to accurately assess the fitness of many thousands of yeast strains containing mutations that affect telomere function in combination with other deletion mutations. To assess fitness, cells were grown in parallel, in 384 spot arrays on solid agar plates. Photographs of plates were taken, images processed and analysed and growth curves for each culture generated. The growth curves are in essence very similar to those observed in liquid culture, with clear exponential and saturation phases (Figure 2 from Lawless et al. 2010) and can be summarized with as few as three logistic growth parameters. The major advantage of QFA over parallel liquid culture methods to measure yeast fitness is that many more cultures can be examined in parallel. For example we routinely follow the growth of about 18,000 parallel cultures (4,500 yeast strains, incubated at four different temperatures), whereas parallel liquid culture based methods are generally restricted to up to 200 parallel cultures [43].
QFA is similar to SGA or EMAP approaches but typically four times fewer strains per plate are cultured (384 spots versus 1536 colonies) [17], [18], [19], [41]. A further difference between QFA and SGA is that in QFA, which has a liquid growth phase, double mutants are cultured for longer before fitness is assessed. This means that that in QFA, synthetically sick double mutants often show poorer growth than is observed in SGA experiments simply because the more divisions that occur the easier it is to observe growth defects. There is a risk with QFA that during the comparatively long culturing period that suppressors or modifiers will arise. In the experiments we performed in this paper the double mutants show conditional, temperature sensitive defects and were generated in permissive conditions where there was little selection for suppressors/modifiers. The principal advantage of QFA over SGA and EMAP is that QFA provides more accurate fitness measurements that can be measured at higher culture densities. The accuracy of QFA is indicated by the tight clustering of genes affecting particular biochemical pathways/functions in Figure 3.
QFA is also lower throughput than “bar code” based assays where up to 6000 independent strains compete in a single culture [44]. One principal difference between QFA and bar code competition methods is that fitness measures are absolute, rather than comparative.
Comparison of genetic interactions observed in yeast cells containing cdc13-1 or yku70Δ mutations, affecting telomeres in different ways, has generated numerous new insights into telomere biology. For example, we have identified at least 19 groups of genes, each representing a particular protein complex or biological process, that significantly affect growth of cells with telomere capping defects in different ways and these are highlighted in Figure 3. Each of these groups of genes, as well as numerous individual genes, warrant further investigation to characterize how they influence the telomere cap. In this paper we followed up just one striking observation that deletions of NMD pathway genes suppress the cdc13-1 temperature-sensitive phenotype and enhance the yku70Δ temperature sensitive phenotype. In upf2Δ strains, levels of STN1 transcripts and levels of Stn1 protein increased. Our detailed follow-up observations are consistent with the hypothesis that the NMD pathway influences Cdc13 - or Yku70-mediated telomere capping through modification of Stn1 but not Ten1 levels (Figure 6).
As well as helping generate hypotheses about the roles of individual gene products at telomeres QFA will be ideal for developing, constraining and testing dynamic, systems models of the effects of complex biological processes on telomere function. Any model describing cellular growth and division as an outcome of the complex interaction of gene products e.g. [45] could usefully be parameterized and tested by QFA. We expect QFA to be widely applicable to other quantitative phenotypic screens in budding yeast and other microbial systems.
Materials and Methods
Growth media
Library strains created using SGA in this study were cultured in SD/MSG media [17] with appropriate amino-acids and antibiotics added – Canavanine (final concentration, 50 µg/ml); G418 (200 µg/ml); thialysine (50 µg/ml); clonNAT (100 µg/ml); hygromycin B (300 µg/ml). Media were made lacking arginine when using canavanine and lacking lysine when using thialysine. W303 genetic background strains were cultured in YEPD (ade).
Western blot analysis
Cell lysis and western blot analysis were performed as previously described [46]. Antibody 9E10 from Cancer Research UK was used to detect the C-Myc epitope and anti-tubulin antibodies, from Keith Gull, Oxford, UK, used as loading controls.
Quantitiative RT-PCR
RNA extraction and RT-PCR were performed as previously described [47]. RNA concentrations of each sample were normalized relative to the loading control, BUD6.
ChIP
Chromatin immunoprecipitation was performed as previously described with minor modifications [48]. Mouse anti-myc (9E10) or goat anti-Mouse antibodies were used for the immunoprecipitations. Immunoprecipitated DNA was quantified by RT-PCR using the SYBR Green qPCR SuperMIX-UDG w/ROX kit (Invitrogen, 11744500).
Plate filling
Rectangular, single chamber, SBS footprint plates (omnitrays; Nunc, Thermo Fisher Scientific) were filled with 35 ml molten agar media using a Perimatic GP peristaltic pump (Jencons (Scientific) Limited, Leighton Buzzard, UK) fitted with a foot switch. 96-well plates (Greiner Bio-One Ltd.) were filled with liquid media or distilled H2O (200 µl per well) using a Wellmate plate-filler with stacker (Matrix Technologies, Thermo Fisher Scientific).
Robotics
Solid agar to solid agar pinning was performed on a Biomatrix BM3-SC robot (S&P Robotics Inc., Toronto, Canada) using either 384-pin (1 mm diameter) or 1536-pin (0.8 mm diameter) pintools. Inoculation from solid agar to liquid media was performed on the Biomatrix BM3-SC robot using a 96-pin (1 mm diameter) pintool. Resuscitation of frozen strain collections (from liquid to solid agar) was performed on the Biomatrix BM3-SC robot using a 384-pin (1 mm diameter) tool. Re-array procedures were carried out using the BM3-SC robot equipped with a 96-pin rearray pintool. Dilution and spotting of liquid cultures onto solid agar plates was performed on a Biomek FX robot (Beckman Coulter (UK) Limited, High Wycombe, UK) equipped with a pintool magnetic mount and a 96-pin (2 mm diameter) pintool (V&P Scientific, Inc., San Diego, CA, USA). Both the Biomatrix BM3-SC and the Biomek FX were equipped with bar-code readers (Microscan Systems, Inc.) and the bar-codes of plates involved in each experiment were recorded in robot log-files.
Strains, strain collections, oligonucleotide primers, and plasmids
All strains, strain collections oligonucleotide primers and plasmids are described in Text S1. Single gene deletion collections (a gift from C. Boone) were stored at −80°C in 384-well plates (Greiner BioOne) in 15% glycerol and when required, were thawed and pinned onto YEPD + G418 agar. Strains were then routinely pinned onto fresh YEPD + G418 agar plates approximately every two months but were re-pinned from frozen stocks after approximately 6 months. An array containing 6 replicates of 12 telomere-related genes, 14 replicates of his3Δ and 6 replicates of 37 randomly chosen genes was created from the original deletion collection (SGAv2). This array (plate 15 in our deletion mutant collections) was designed to quickly check that gene deletions with familiar phenotypes were behaving as expected and to also provide high numbers of replicates for a small number of genes (49) allowing more robust statistical analysis. This collection was SGAv2p15. Collection SGAv3 was made by re-arraying each of the 15 plates of SGAv2p15, randomly, with the exceptions that all his3Δ strains on the plate periphery [17] were not moved and genes which were in the corner area of plates in SGAv2p15 were specifically moved to non-corner positions in SGAv3.
Growth assays
Liquid-to-solid agar 384-format robotic spot tests were performed as follows. Colonies were inoculated from solid agar SGA plates into 96-well plates containing 200 µl appropriately supplemented liquid SD/MSG media in each well. These were grown to saturation (usually three days), without shaking, at 20°C. Cultures were resuspended, diluted approximately 1/100 in 200 µl H2O and spotted onto appropriately supplemented solid SD/MSG media plates which were incubated at different temperatures.
SGA with cdc13-1 and yku70Δ
SGA query strains DLY5688 (cdc13-1 flanked by LEU2 and HPHMX (HygromycinR)), DLY3541 (yku70Δ::URA3) and DLY4228 (ura3::NATMX) were crossed to SDLv2p15 and SDLv3 in quadruplicate, giving eight biological replicate crosses each. Fitness of each strain under different conditions was assayed in 384-spot growth assays. As previously [20], growth at 36°C was used as an indication of failure of the SGA process or spontaneous reversion in SGA screens where cdc13-1 was the query mutation. In this study, repeats with modeled Trimmed Area >25000 after 6 days at 36°C (provided this included no more than 3 repeats for a single gene deletion) were stripped out. In each SGA experiment, a small number of strains were missing from the starting mutant array (due to mis-pinning, strains being lost, replaced etc.). These experiment-specific missing strains; together with genes affecting selection during SGA; and experiment-specific genes situated within 20 kb of SGA markers; were removed from analysis.
Photography
Solid agar plates were photographed on an spImager (S&P Robotics Inc., Toronto, Canada). The integrated camera (Canon EOS 40D) was used in manual mode with a pre-set manual focus. Manual settings were as follows: exposure, 0.25 s; aperture, F10; white balance, 3700 K; ISO100; image size, large; image quality, fine; image type, .jpg. Using the spImager software, the plate barcode number and a time stamp (date in year, month, day and time in hour, minute, second) were incorporated as the image name (e.g. DLY00000516-2008-12-24_23-59-59.jpg).
Image analysis
The image analysis tool Colonyzer [21] was used to quantify cell density from captured photographs. Colonyzer corrects for lighting gradients, removing spatial bias from density estimates. It is designed to detect cultures with extremely low cell densities, allowing it to capture a wide range of culture densities after dilute spotting on agar. Colonyzer is available under GPL at http://research.ncl.ac.uk/colonyzer.
384 spot versus 1,536 colony sensitivity
We directly compared QFA of pinned 1536 - colony format versus spotted 384 - culture format and found that the range of normalized 384 spot fitness is approximately 4 times that estimated from 1,536 colony growth curves (Lawless et al., in prep). We also find that 384 spot fitness estimates adequately captures the strong temperature dependent growth of cdc13-1 mutants, whereas 1536-format growth estimates do not, and that analysis of growth in 384 spot format captures a much higher dynamic range of cell densities than 1536 colony format (approx 1,000 versus 20 fold, see Fig. 2, Lawless et al, 2010). For these reasons we chose to perform QFA of telomere capping mutants arrayed as 384 spotted cultures.
Sample tracking and data storage
Strain array positions on a 384-spot layout (plate, row, column) were defined in a comma-separated text file and tracked using bar-codes reported in robot log-files. Data was stored in a Robot Object Database (ROD) as described previously [20]. Screen data is exported from ROD in tab delimited format (Table S7) ready for modeling and statistical analysis (see below).
Modeling of fitness
Culture density (G) was estimated from captured photographs using the Integrated Optical Density (IOD or Trimmed Area; Table S7) measure of cell density provided by the image-analysis tool Colonyzer (Lawless et al 2010). Observed density time series were summarised with the logistic population model, which is an ODE describing self-limiting population growth. It has an analytical solution G (t):
Modelled inoculum density (G0, AU) was fixed (at 43 AU in this case), assuming that all liquid cultures reached the same density in stationary phase before water dilution and inoculation onto agar. Logistic parameter values r (growth rate, d−1) and K (carrying capacity, AU) were inferred by least squares fit to observations, using optimization routines in the SciPy Python library (code available from http://sourceforge.net/projects/colonyzer/).
For least-squares minimisation, initial guesses for K were the maximum observed cell density for that culture. For r, we constructed initial guesses by observing that G'(t) is at a maximum when t = t*:
Linearly interpolating between cell density observations we estimated the time of greatest rate of change of density. We then estimated r as:
A quantitative measure of fitness was then constructed from the optimal parameters. The particular measure we used was the product of the maximal doubling rate (MDR, doublings.d−1), which is the inverse of the doubling time and the maximal doubling potential (MDP, doublings). These phenotypes were quantified using logistic model parameter estimates as follows.
We estimate the minimum doubling time T which the cell population takes to reach a density of 2G0 (assuming that the culture is in exponential phase immediately after inoculation):
MDP is the number of divisions the culture is observed to undergo. Considering cell growth as a geometric progression:
These two phenotypes provide different information about the nature of population fitness and both of them are important, reflecting the rate of growth (MDR) and the capacity of the mutant to divide (MDP) under given experimental conditions. Our chosen measure of fitness (F = MDR×MDP) places equal importance on these two phenotypes.
Quantifying genetic interaction
To estimate GIS, F is obtained for a particular temperature for both the QFA screen of interest and a second QFA screen using a control query mutation, ura3Δ, which is assumed to be neutral under the experimental conditions, approximating wild-type fitness. Experimental and control strain fitnesses are analysed for evidence of epistatic interactions contradicting a multiplicative model of genetic independence [49] (used due to the ratio scale of the phenotype). We denote the fitness of the query (or background) mutation Fxyz, that of a typical deletion from the yeast knockout library FyfgΔ and double mutant fitnesses as Fxyz yfgΔ. Genetic independence therefore implies:and re-arranging gives:where M = Fxyz/Fura3Δ is a constant independent of the particular knockout, yfgΔ. Thus, after normalising fitnesses () so that the means across all knockouts for both the experimental (QFA, xyz yfgΔ) and control (cQFA, ura3Δ yfgΔ) mutation strains are equal to 1, evidence that is significantly different from is evidence of genetic interaction. Thus for each knockout a model is fitted of the form: where i = 1,2, j = 1,..,ni is the jth normalised fitness for treatment i (cQFA = 1, QFA = 2), µ is the mean fitness for the knockout in the control QFA, γ1 = 0, γ2 represents genetic interaction and εij is (normal, iid) random error. Typically ni is 8 (4 replicates each of SGAv2p15 and SGAv3), but is sometimes a larger multiple of 8 for strains that are repeated in the libraries (e.g. those on plate 15). The model is fitted in R using the lmList command. For each knockout the fitted value of γ2 is recorded as an estimated measure of the strength of genetic interaction (with the sign indicating suppression or enhancement) and the corresponding p-value is used as a measure of statistical significance of the effect. The p-value is corrected using the R function p.adjust to give a FDR-corrected q-value, and it is this q-value which is thresholded to give the lists of statistically significant genetically interacting strains (see Figure 2).
The R code used for the statistical analysis of data from ROD and Colonyzer is available from the authors on request and sample logistic analysis output is presented in Table S8.
Stringent lists of genetic interactors for each query mutation and growth condition (Tables S1, S2, S3, S4, S5, S6) were compiled by imposing a 5% FDR cutoff and arbitrarily removing genes with −0.5< GIS >0.5.
Supplementary information data files website
Raw output data and hyperlinked supplementary tables, together with detailed legends for interpretation of data files are available from: http://research.ncl.ac.uk/colonyzer/AddinallQFA/
Supporting Information
Zdroje
1. OlovnikovAM
1973 A theory of marginotomy. The incomplete copying of template margin in enzymic synthesis of polynucleotides and biological significance of the phenomenon. J Theor Biol 41 181 190
2. LongheseMP
2008 DNA damage response at functional and dysfunctional telomeres. Genes Dev 22 125 140
3. GreiderCW
BlackburnEH
1985 Identification of a specific telomere terminal transferase activity in Tetrahymena extracts. Cell 43 405 413
4. LydallD
2009 Taming the tiger by the tail: modulation of DNA damage responses by telomeres. EMBO J 28 2174 2187
5. FisherTS
ZakianVA
2005 Ku: a multifunctional protein involved in telomere maintenance. DNA Repair (Amst) 4 1215 1226
6. BoultonSJ
JacksonSP
1998 Components of the Ku-dependent non-homologous end-joining pathway are involved in telomeric length maintenance and telomeric silencing. EMBO J 17 1819 1828
7. MaringeleL
LydallD
2002 EXO1-dependent single-stranded DNA at telomeres activates subsets of DNA damage and spindle checkpoint pathways in budding yeast yku70Delta mutants. Genes Dev 16 1919 1933
8. PolotniankaRM
LiJ
LustigAJ
1998 The yeast Ku heterodimer is essential for protection of the telomere against nucleolytic and recombinational activities. Curr Biol 8 831 834
9. GravelS
LarriveeM
LabrecqueP
WellingerRJ
1998 Yeast Ku as a regulator of chromosomal DNA end structure. Science 280 741 744
10. MiyakeY
NakamuraM
NabetaniA
ShimamuraS
TamuraM
2009 RPA-like mammalian Ctc1-Stn1-Ten1 complex binds to single-stranded DNA and protects telomeres independently of the Pot1 pathway. Mol Cell 36 193 206
11. SurovtsevaYV
ChurikovD
BoltzKA
SongX
LambJC
2009 Conserved telomere maintenance component 1 interacts with STN1 and maintains chromosome ends in higher eukaryotes. Mol Cell 36 207 218
12. LinJJ
ZakianVA
1996 The Saccharomyces CDC13 protein is a single-strand TG1-3 telomeric DNA-binding protein in vitro that affects telomere behavior in vivo. Proc Natl Acad Sci U S A 93 13760 13765
13. NugentCI
HughesTR
LueNF
LundbladV
1996 Cdc13p: a single-strand telomeric DNA-binding protein with a dual role in yeast telomere maintenance. Science 274 249 252
14. GarvikB
CarsonM
HartwellL
1995 Single-stranded DNA arising at telomeres in cdc13 mutants may constitute a specific signal for the RAD9 checkpoint. Mol Cell Biol 15 6128 6138
15. ZubkoMK
GuillardS
LydallD
2004 Exo1 and Rad24 differentially regulate generation of ssDNA at telomeres of Saccharomyces cerevisiae cdc13-1 mutants. Genetics 168 103 115
16. WeinertTA
KiserGL
HartwellLH
1994 Mitotic checkpoint genes in budding yeast and the dependence of mitosis on DNA replication and repair. Genes Dev 8 652 665
17. TongAH
BooneC
2006 Synthetic genetic array analysis in Saccharomyces cerevisiae. Methods Mol Biol 313 171 192
18. TongAH
EvangelistaM
ParsonsAB
XuH
BaderGD
2001 Systematic genetic analysis with ordered arrays of yeast deletion mutants. Science 294 2364 2368
19. CollinsSR
MillerKM
MaasNL
RoguevA
FillinghamJ
2007 Functional dissection of protein complexes involved in yeast chromosome biology using a genetic interaction map. Nature 446 806 810
20. AddinallSG
DowneyM
YuM
ZubkoMK
DewarJ
2008 A genomewide suppressor and enhancer analysis of cdc13-1 reveals varied cellular processes influencing telomere capping in Saccharomyces cerevisiae. Genetics 180 2251 2266
21. LawlessC
WilkinsonD
YoungA
AddinallS
LydallD
2010 Colonyzer: automated quantification of micro-organism growth characteristics on solid agar. BMC Bioinformatics 11 287
22. ShahNA
LawsRJ
WardmanB
ZhaoLP
HartmanJLt
2007 Accurate, precise modeling of cell proliferation kinetics from time-lapse imaging and automated image analysis of agar yeast culture arrays. BMC Syst Biol 1 3
23. KraftC
DeplazesA
SohrmannM
PeterM
2008 Mature ribosomes are selectively degraded upon starvation by an autophagy pathway requiring the Ubp3p/Bre5p ubiquitin protease. Nat Cell Biol 10 602 610
24. AskreeSH
YehudaT
SmolikovS
GurevichR
HawkJ
2004 A genome-wide screen for Saccharomyces cerevisiae deletion mutants that affect telomere length. Proc Natl Acad Sci U S A 101 8658 8663
25. GatbontonT
ImbesiM
NelsonM
AkeyJM
RuderferDM
2006 Telomere length as a quantitative trait: genome-wide survey and genetic mapping of telomere length-control genes in yeast. PLoS Genet 2 e35 doi:10.1371/journal.pgen.0020035
26. SGD
2008 Saccharomyces Genome Database
27. EisenbergT
KnauerH
SchauerA
ButtnerS
RuckenstuhlC
2009 Induction of autophagy by spermidine promotes longevity. Nat Cell Biol 11 1305 1314
28. FordAS
GuanQ
Neeno-EckwallE
CulbertsonMR
2006 Ebs1p, a negative regulator of gene expression controlled by the Upf proteins in the yeast Saccharomyces cerevisiae. Eukaryot Cell 5 301 312
29. LukeB
AzzalinCM
HugN
DeplazesA
PeterM
2007 Saccharomyces cerevisiae Ebs1p is a putative ortholog of human Smg7 and promotes nonsense-mediated mRNA decay. Nucleic Acids Res 35 7688 7697
30. ZhouJ
HidakaK
FutcherB
2000 The Est1 subunit of yeast telomerase binds the Tlc1 telomerase RNA. Mol Cell Biol 20 1947 1955
31. DowneyM
HoulsworthR
MaringeleL
RollieA
BrehmeM
2006 A genome-wide screen identifies the evolutionarily conserved KEOPS complex as a telomere regulator. Cell 124 1155 1168
32. DahlseidJN
Lew-SmithJ
LeliveltMJ
EnomotoS
FordA
2003 mRNAs encoding telomerase components and regulators are controlled by UPF genes in Saccharomyces cerevisiae. Eukaryot Cell 2 134 142
33. EnomotoS
GlowczewskiL
Lew-SmithJ
BermanJG
2004 Telomere cap components influence the rate of senescence in telomerase-deficient yeast cells. Mol Cell Biol 24 837 845
34. GrandinN
DamonC
CharbonneauM
2000 Cdc13 cooperates with the yeast Ku proteins and Stn1 to regulate telomerase recruitment. Mol Cell Biol 20 8397 8408
35. PetreacaRC
ChiuHC
NugentCI
2007 The role of Stn1p in Saccharomyces cerevisiae telomere capping can be separated from its interaction with Cdc13p. Genetics 177 1459 1474
36. PuglisiA
BianchiA
LemmensL
DamayP
ShoreD
2008 Distinct roles for yeast Stn1 in telomere capping and telomerase inhibition. EMBO J
37. ChandraA
HughesTR
NugentCI
LundbladV
2001 Cdc13 both positively and negatively regulates telomere replication. Genes Dev 15 404 414
38. StellwagenAE
HaimbergerZW
VeatchJR
GottschlingDE
2003 Ku interacts with telomerase RNA to promote telomere addition at native and broken chromosome ends. Genes Dev 17 2384 2395
39. ChanA
BouleJB
ZakianVA
2008 Two pathways recruit telomerase to Saccharomyces cerevisiae telomeres. PLoS Genet 4 e1000236 doi:10.1371/journal.pgen.1000236
40. BeltraoP
CagneyG
KroganNJ
2010 Quantitative genetic interactions reveal biological modularity. Cell 141 739 745
41. CostanzoM
BaryshnikovaA
BellayJ
KimY
SpearED
2010 The genetic landscape of a cell. Science 327 425 431
42. GibsonTJ
2009 Cell regulation: determined to signal discrete cooperation. Trends Biochem Sci 34 471 482
43. WarringerJ
EricsonE
FernandezL
NermanO
BlombergA
2003 High-resolution yeast phenomics resolves different physiological features in the saline response. Proc Natl Acad Sci U S A 100 15724 15729
44. HillenmeyerME
FungE
WildenhainJ
PierceSE
HoonS
2008 The chemical genomic portrait of yeast: uncovering a phenotype for all genes. Science 320 362 365
45. SmallboneK
SimeonidisE
SwainstonN
MendesP
2010 Towards a genome-scale kinetic model of cellular metabolism. BMC Syst Biol 4 6
46. MorinI
NgoHP
GreenallA
ZubkoMK
MorriceN
2008 Checkpoint-dependent phosphorylation of Exo1 modulates the DNA damage response. EMBO J 27 2400 2410
47. GreenallA
LeiG
SwanDC
JamesK
WangL
2008 A genome wide analysis of the response to uncapped telomeres in budding yeast reveals a novel role for the NAD+ biosynthetic gene BNA2 in chromosome end protection. Genome Biol 9 R146
48. AparicioO
GeisbergJV
StruhlK
2004 Chromatin immunoprecipitation for determining the association of proteins with specific genomic sequences in vivo. Curr Protoc Cell Biol Chapter 17 Unit 17 17
49. ManiR
St OngeRP
HartmanJLt
GiaeverG
RothFP
2008 Defining genetic interaction. Proc Natl Acad Sci U S A 105 3461 3466
50. BianchiA
ShoreD
2007 Early replication of short telomeres in budding yeast. Cell 128 1051 1062
Štítky
Genetika Reprodukční medicínaČlánek vyšel v časopise
PLOS Genetics
2011 Číslo 4
Nejčtenější v tomto čísle
- Survival Motor Neuron Protein Regulates Stem Cell Division, Proliferation, and Differentiation in
- PTG Depletion Removes Lafora Bodies and Rescues the Fatal Epilepsy of Lafora Disease
- Evolution of Vertebrate Transient Receptor Potential Vanilloid 3 Channels: Opposite Temperature Sensitivity between Mammals and Western Clawed Frogs
- An Evolutionary Genomic Approach to Identify Genes Involved in Human Birth Timing