
-eQTLs Reveal That Independent Genetic Variants Associated with a Complex Phenotype Converge on Intermediate Genes, with a Major Role for the HLA
For many complex traits, genetic variants have been found associated. However, it is still mostly unclear through which downstream mechanism these variants cause these phenotypes. Knowledge of these intermediate steps is crucial to understand pathogenesis, while also providing leads for potential pharmacological intervention. Here we relied upon natural human genetic variation to identify effects of these variants on trans-gene expression (expression quantitative trait locus mapping, eQTL) in whole peripheral blood from 1,469 unrelated individuals. We looked at 1,167 published trait - or disease-associated SNPs and observed trans-eQTL effects on 113 different genes, of which we replicated 46 in monocytes of 1,490 different individuals and 18 in a smaller dataset that comprised subcutaneous adipose, visceral adipose, liver tissue, and muscle tissue. HLA single-nucleotide polymorphisms (SNPs) were 10-fold enriched for trans-eQTLs: 48% of the trans-acting SNPs map within the HLA, including ulcerative colitis susceptibility variants that affect plausible candidate genes AOAH and TRBV18 in trans. We identified 18 pairs of unlinked SNPs associated with the same phenotype and affecting expression of the same trans-gene (21 times more than expected, P<10−16). This was particularly pronounced for mean platelet volume (MPV): Two independent SNPs significantly affect the well-known blood coagulation genes GP9 and F13A1 but also C19orf33, SAMD14, VCL, and GNG11. Several of these SNPs have a substantially higher effect on the downstream trans-genes than on the eventual phenotypes, supporting the concept that the effects of these SNPs on expression seems to be much less multifactorial. Therefore, these trans-eQTLs could well represent some of the intermediate genes that connect genetic variants with their eventual complex phenotypic outcomes.
Published in the journal:
. PLoS Genet 7(8): e32767. doi:10.1371/journal.pgen.1002197
Category:
Research Article
doi:
https://doi.org/10.1371/journal.pgen.1002197
Summary
For many complex traits, genetic variants have been found associated. However, it is still mostly unclear through which downstream mechanism these variants cause these phenotypes. Knowledge of these intermediate steps is crucial to understand pathogenesis, while also providing leads for potential pharmacological intervention. Here we relied upon natural human genetic variation to identify effects of these variants on trans-gene expression (expression quantitative trait locus mapping, eQTL) in whole peripheral blood from 1,469 unrelated individuals. We looked at 1,167 published trait - or disease-associated SNPs and observed trans-eQTL effects on 113 different genes, of which we replicated 46 in monocytes of 1,490 different individuals and 18 in a smaller dataset that comprised subcutaneous adipose, visceral adipose, liver tissue, and muscle tissue. HLA single-nucleotide polymorphisms (SNPs) were 10-fold enriched for trans-eQTLs: 48% of the trans-acting SNPs map within the HLA, including ulcerative colitis susceptibility variants that affect plausible candidate genes AOAH and TRBV18 in trans. We identified 18 pairs of unlinked SNPs associated with the same phenotype and affecting expression of the same trans-gene (21 times more than expected, P<10−16). This was particularly pronounced for mean platelet volume (MPV): Two independent SNPs significantly affect the well-known blood coagulation genes GP9 and F13A1 but also C19orf33, SAMD14, VCL, and GNG11. Several of these SNPs have a substantially higher effect on the downstream trans-genes than on the eventual phenotypes, supporting the concept that the effects of these SNPs on expression seems to be much less multifactorial. Therefore, these trans-eQTLs could well represent some of the intermediate genes that connect genetic variants with their eventual complex phenotypic outcomes.
Introduction
For many complex traits and diseases, numerous associated single nucleotide polymorphisms (SNPs) have been identified through genome-wide association studies (GWAS)through genome-wide association studies (GWAS) [1]. For many of these identified variants it is still unclear through which mechanism the association between the SNP and the trait or disease phenotype is mediated. A complicating factor is that disease-associated variants might not be the real causal variants, but are in linkage disequilibrium (LD) with the true disease-causing variant, making it difficult to accurately implicate the correct gene for a locus in disease pathogenesis.
Within the major histocompatibility locus (MHC) on 6p, many SNPs have been found to be associated with complex diseases such as celiac disease, inflammatory bowel disease, psoriasis, rheumatoid arthritis, diabetes mellitus, schizophrenia, lung cancer and follicular lymphoma [2]–[10]. An analysis of the Catalog of Published Genome-Wide Association Studies [1] revealed that out of 1,167 unique SNP associations with a reported p<5×10⁻⁷, 82 (7.0%) were located within the MHC (Fisher's Exact p<10−30). Except for celiac disease [11] it remains largely unclear how MHC variants increase disease susceptibility.
However, common variants have been identified that might exert their function by altering gene expression rather than by altering protein structure [2], [12]–[16] (expression quantitative trait loci, eQTLs). Comprehensive eQTL mapping (or genetical genomics [17]) will enable us to assess for every known disease-associated variant if it significantly affects gene expression. Genetic variants that affect expression of genes that map in their vicinity (cis-eQTLs) can potentially pinpoint the true disease gene from an associated locus. In addition, genetic variants may also affect expression of genes that reside further away or are on different chromosomes (trans-eQTLs) [18]. These trans-eQTLs are especially interesting, since they allow us to identify downstream affected disease genes which were not implicated by GWAS studies at all, and thereby potentially having the ability to reveal previously unknown (disease) pathways.
In this study we performed a comprehensive eQTL mapping to explore the downstream effects of SNPs on gene expression by analyzing genotype and expression data of 1,469 unrelated samples. In addition to a genome-wide analysis, we also performed a focused analysis for disease - and trait-associated SNPs and SNPs located within the HLA. We replicated the identified trans-eQTLs in a collection of monocyte expression data and expression data from subcutaneous adipose, visceral adipose, muscle and liver tissue. Principal component analysis (PCA) enabled us to remove non-genetic expression variation [19], [20], resulting in increased power to detect eQTLs. A stringent probe-mapping strategy was used to filter out false-positive cis-eQTLs due to primer-polymorphisms and false-positive trans-eQTLs due to cross-hybridizations. Furthermore, a permutation strategy was utilized that corrects for multiple-testing, while preventing potential confounders such as non-even distribution of SNP markers and expression probe markers across the genome, differences in minor allele frequency (MAF) between SNPs, linkage disequilibrium (LD) within the genotype data, and correlation between expression probes.
Results
Cis - and trans-eQTL mapping
Results of a genome-wide eQTL analysis on 289,044 common SNPs, present on the Illumina HumanHap300 platform in peripheral blood expression data of 1,469 unrelated individuals, are provided in Table 1, Table S1, Table S2, Figure S1 (controlling false discovery rate (FDR) at 0.05 using a permutation strategy).

As reported before [21]–[25] we also observed that eQTLs are strongly enriched for trait-associated SNPs (SNPs associated with a trait or disease phenotype, as reported in the Catalog of Published Genome-Wide Association Studies [1]): We therefore concentrated on these variants and imputed (Impute v2.0 [26]) additional genotype data permitting us to test 1,167 trait-associated SNPs. After removing false-positive eQTLs due to primer-polymorphisms and cross-hybridization 472 (40.4%) of these SNPs were cis-eQTLs, affecting the expression of 679 different transcripts, representing 538 genes (Figure 1, Table 1, Figure S2, Table S3). 67 (5.7%) SNPs were trans-acting on 130 different transcripts, representing 113 genes (Table S4). Results on the number of detected eQTLs per complex trait are provided in Table S5 and Figure S3. For nearly all significant trans-eQTLs the effect was present in each of the seven individual patient and controls cohorts, making up the total dataset (Table S6).

These trans-eQTLs provide valuable insight on previously unknown functional downstream consequences trait-associated SNPs have, e.g. rs2395185 is the strongest susceptibility variant for ulcerative colitis [27] (UC) but also the strongest SNP, trans-acting on Acyloxyacyl hydrolase (AOAH, p = 1.0×10−36), an enzyme that modulates host inflammatory responses to gram-negative bacterial invasion. It is known that deficiencies in response mechanisms against bacterial products like lipopolysaccharide, present on gram-negative bacterial cell walls, play an important role in UC disease pathogenesis [28]. Within the peripheral blood we observed that AOAH is significantly co-expressed with colony stimulating factor 1 receptor (CSF1R, r = 0.21) and major histocompatibility complex class II DR alpha (HLA-DRA, r = 0.19). Hyperstimulation of CSF1R has been implicated in UC [29], while HLA-DRA is one of the positional UC candidate genes mapping in very close proximity to rs2395185. Another UC HLA variant, rs9268877, was trans-acting on T cell receptor beta variable 18 (TRBV18), part of the TCRß locus at 7q34. It is known that TCRß mutant mice develop chronic colitis [30].
For type 1 diabetes (T1D) we observed that 59% (30/51) of the known and tested T1D associated SNPs are cis-acting (on in total 53 unique genes) and 17% (9/50) are trans-acting on 22 unique genes (Figure 2). Potentially interesting trans-genes include CCL2, CFB, CLN1, KRT19, OSR1 and RARRES1, all strongly co-expressed with each other. CCL2 and CFB are known immune response genes and have been implicated in T1D before [31]–[33].

For breast cancer we observed that rs3803662 [34] is trans-acting on origin recognition complex subunit 6 (ORC6L). This gene is involved in DNA replication and has been frequently used as part of prognostic profiles for predicting the clinical outcome in breast cancer [35], [36].
We observed a marked enrichment for SNPs within the MHC among the cis- and trans-acting trait-associated SNPs: 65 of 472 cis-acting SNPs (13.8%, EVD p<1.0×10⁻¹⁶) and 32 of 67 trans-acting SNPs (47.8%, EVD p<1.0×10⁻¹⁶) mapped within the MHC (Figure 3). These SNPs all map to the Human Leukocyte Antigens (HLA) locus: SNPs within the HLA class I region, class II region and class III region affect 20, 7 and 2 different genes in trans, respectively.

Biological convergence of cis - and trans-eQTLs
While multiple associated SNPs have been identified for many complex diseases, it often remains unclear what the intermediate effects of these variants are that eventually lead to disease. It is reasonable to assume that for a particular phenotype the different associated SNPs eventually converge on the same downstream gene(s) or pathways.
We identified 7 unique pairs of unlinked SNPs that are associated with the same phenotype and that also affect the same downstream genes in trans or cis (at FDR 0.05, Table 2, Figure 4a). In order to establish whether this was more than expected by chance, we repeated this analysis, while using a set of trans-eQTLs, equal in size to the set of real trans-eQTLs, most significant after having permuted the expression sample identifiers. We performed this procedure 100 times, and observed on average only 0.15 unique pairs of unlinked SNPs (range [0, 3], Figure 4b) that showed this convergence, which indicates that the observed number of converging pairs of SNPs is 47 times more than expected (EVD p<1.0×10⁻¹⁶) and implies a false-positive rate of 0.021.

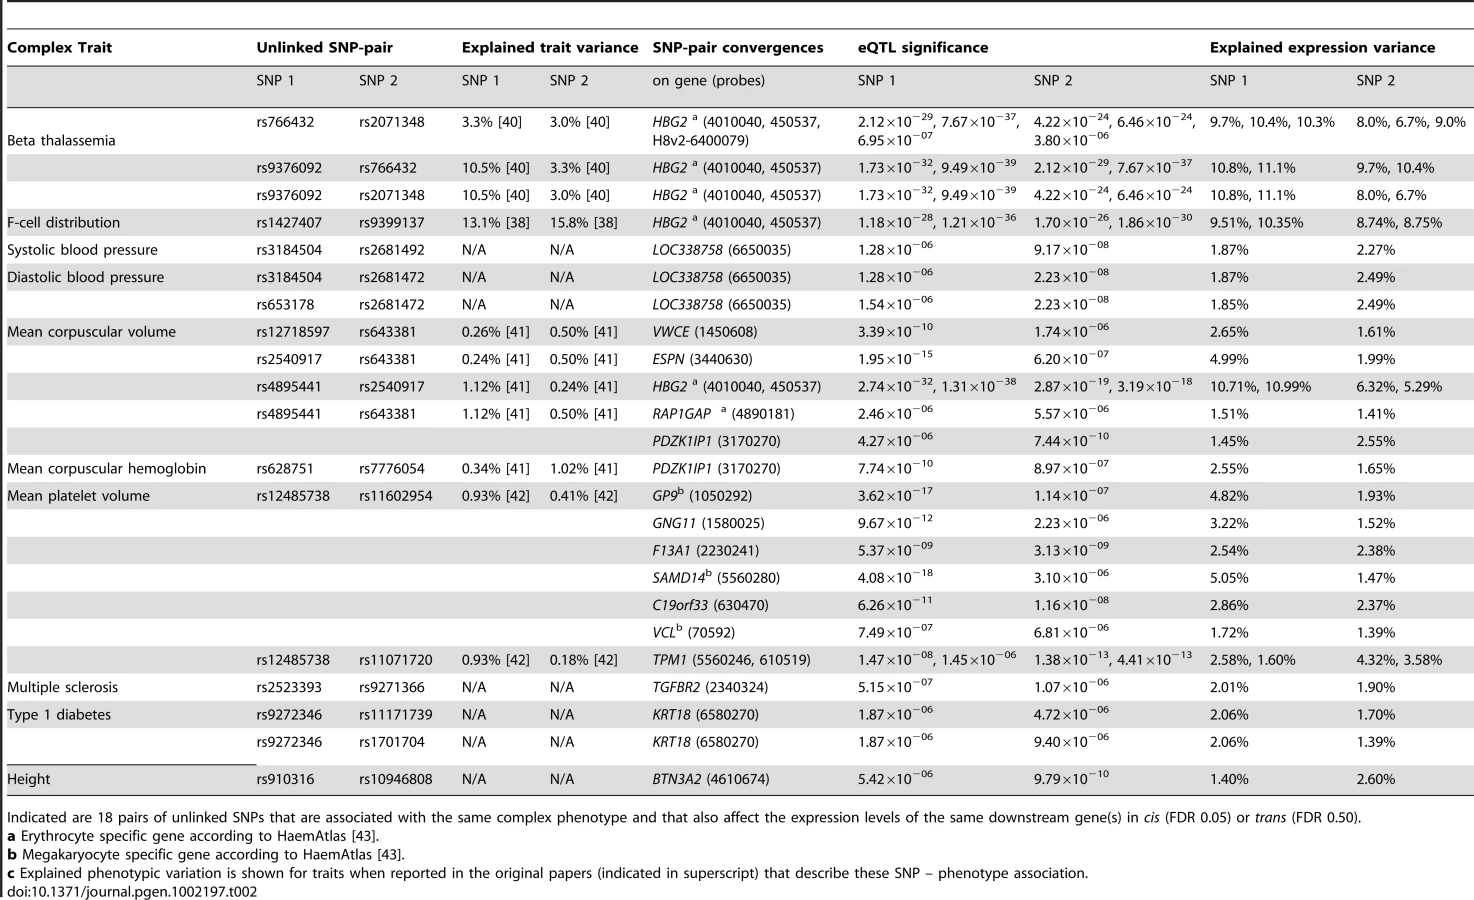
Due to this highly significant enrichment of converging pairs of SNPs and its low estimated false-positive rate, we also ran an analysis where we had relaxed the FDR for trans-eQTLs to 0.50 (Table S7). Here we observed 18 pairs of SNPs that converge on the same genes, whereas in the 100 subsequent permutations we observed this only on average for 0.84 SNP-pairs (range [0, 5], 21 times more expected by chance, EVD p<1.0×10⁻¹⁶, implying a false-positive rate of 0.047, Table 2, Figure 4b).
Many of these converging downstream genes make biological sense: three independent loci, associated with hemoglobin protein levels [37]–[39] and ß thalassemia susceptibility [40], significantly affect hemoglobin gamma G (HBG2) gene expression levels (each with p<1.0×10⁻²³, Figure 5). For mean corpuscular volume (MCV, Figure 5) two unlinked MCV SNPs [41], [42] also affect HBG2 gene expression levels in trans (at FDR 0.05), while other pairs of MCV SNPs converge on ESPN, VWCE, PDZK1IP1 and RAP1GAP.

For mean platelet volume (MPV) we observed that MPV SNPs rs12485738 on 3p26 and rs11602954 on 11p15 affect several transcripts in trans. These two SNPs converge on GP9, F13A1, C19orf33, SAMD14, VCL and GNG11. As GP9 and F13A1 are known blood coagulation genes, C19orf33 is a potential candidate gene, involved in coagulation as well. This is substantiated by strong co-expression between GP9 and C19orf33 within peripheral blood (Pearson r = 0.45, p = 7.0×10−63) and the fact these SNPs independently also affect various other blood coagulation genes in trans (including CD151, GP1BB, ITGA2B, MMRN1, THBS1 and VWF, Figure 4). Many of these are specific to megakaryocytes that are platelet precursor cells [43]. As expected, the Gene Ontology term ‘blood coagulation’ is strongly overrepresented among all these trans-genes, Fisher's exact p = 1.0×10⁻¹⁰.
We observed that MPV SNP rs12485738 (on 3p14.3) was also trans-acting on tropomyosin 1 (TPM1, 15q22.2, p = 9.7×10⁻⁹), a gene that is also regulated in cis by another MPV variant (rs11071720 on 15q22.2, p = 1.4×10⁻¹³). We observed this for two different expression probes that map within different locations of the TPM1 transcript (probes 5560246 and 610519), and note strong co-expression for these two TPM1 probes with 46 MPV trans-genes (Pearson r>0.19, p<1.0×10⁻¹¹, including five known coagulation genes). Although several genes reside within the rs11071720 MPV locus, these observations strongly implicate TPM1 as the causal MPV gene.
For both MPV and MCV we observed that the identified cis - and trans-eQTL probes generally were more strongly co-expressed in peripheral blood than expected (Figure S4, MPV co-expression Wilcoxon P<10−200, MCV co-expression Wilcoxon P = 0.009), substantiating the likelihood these genes reflect coherent biological sets. We repeated this co-expression analysis after we had regressed out all cis - and trans-eQTL effects, and observed that most of this co-expression was independent of the eQTL SNP-effect on the expression of these genes, which further substantiates that these genes are biologically related (MPV co-expression Wilcoxon P<1−200, MCV co-expression Wilcoxon P = 0.018).
Phenotypic buffering
Although the observed convergence provides insight into downstream genes, it is not clear whether the MPV or MCV phenotypes are eventually caused through these trans-genes, or whether these trans-eQTLs emerged as a result of changes to the volume of the platelets or the erythrocytes.
In order to gain insight into this, we analyzed the effect size of these SNP variants on both the expression levels and the phenotypes. While the effect sizes of these trait-associated SNPs on eventual phenotypes were usually small, their intermediate (molecular) effects was often substantially larger. This supports the notion that the effect on e.g. MPV and MCV is through these trans-genes, and suggests the presence of ‘phenotypic buffering’, shown previously in plants [44], in humans (Table 2, Figure 4b): the effects of the 18 converging pairs of SNPs on gene expression levels were often substantially higher than the originally reported effect sizes on the trait-phenotypes. For example, several MPV - and MCV-associated SNPs explain between 1.41% and 10.99% of trans-expression variation within the 1,469 unrelated samples, whereas these SNPs only explain between 0.24% and 1.12% of the MPV and MCV phenotype variation (and as such required over 13,000 samples [41], [42] for identification, Figure 4b).
Replication of trans-eQTLs in monocytes and four additional primary tissues
We analyzed peripheral blood which is a mixture of different hematopoetic cell types. In addition, we also assessed whether the identified trait-associated trans-eQTLs (detected at FDR 0.05) could be replicated in a single cell-type dataset. This is an important question, as it is potentially possible that the trans-acting SNP are able to alter the amount, volume or ratio of certain blood cell types, which might as a consequence result in an indirect net effect on the measured gene expression levels within the mix of the cells that comprise whole blood.
We therefore analyzed monocyte expression data from 1,490 independent samples [45] and did not find evidence that this was a widespread phenomenon as we could replicate 46 out of the 130 different trans-eQTLs (each of these with a nominal p<1.0×10⁻⁵ in the monocyte data, Table S8). These replicated eQTLs include the genes AOAH, HBG2, GP9, F13A1, SAMD14, CD151, ITGA2B, MMRN1, THBS1, VWF and TPM1 mentioned above. Surprisingly we could also replicate the trans-eQTL effects on various blood-coagulation genes for mean platelet volume SNP rs12485738: One might argue that rs12485738 primarily increases platelet volume, resulting in a relatively higher volume of platelet-RNA when assessing total peripheral blood RNA. If this were to be the case, a measurable trans-effect is expected for platelet-specific (blood coagulation) genes in whole blood. Such an effect would then not actually be an expression-QTL, but rather a ‘cellular-QTL’. However, the trans-eQTLs for rs12485738 were also present in single cell-type monocyte datasets, indicating that the above concerns do not apply. Clearly, trans-eQTL effects can manifest themselves outside the primary cell-type, in which they are expected to operate.
We also replicated 18 trait-associated trans-eQTLs (including AOAH, detected at FDR 0.05) in an independent dataset comprising four different non-blood tissues (subcutaneous adipose, visceral adipose, liver and muscle, Figure S5, Table S9 and S10). Since this dataset comprised only 90 samples, it is very encouraging that 18 trans-eQTL could be replicated.
Discussion
Here we investigated gene expression in peripheral blood from 1,469 individuals to identify cis- and trans-effects of common variants on gene expression levels. When comparing to other genetical genomics studies [12]–[14], [16], [18], [21]–[24], [45], [46] we observe an increasing percentage of genes that are cis- or trans-regulated (39% of 19,689 unique genes at FDR 0.05). When eQTL studies further increase the sample-sizes and thus increase statistical power, we expect that for the far majority of genes the expression levels are to some extent determined by genetic variation.
GWA studies have identified many loci, but it is still often unclear what the affected gene in each locus is. Here we showed that 39% of trait-associated SNPs affect gene expression in cis which is helpful in pinpointing the most likely gene per susceptibility locus. However, GWAS do not immediately provide insight in the trans-effects of these susceptibility variants on downstream genes. Here we identified for 2.6% of all trait-associated SNPs trans-eQTL effects on in total 113 unique genes. While some of these trans-eQTLs are known to be involved in these phenotypes (such as HBG2 in hemoglobin protein levels and ß-Thallasemia), most of these genes have not been implicated before in these complex traits, and provide additional insight in the downstream mechanisms of these variants. Interestingly, 48% of trans-acting trait-associated SNPs map within the HLA, indicating the HLA has a prominent role in regulating peripheral blood gene expression. This might partly explain why the HLA has been found to be associated with so many different diseases.
While we concentrated on peripheral blood, we could replicate 35% of the trans-eQTLs in monocytes. Particularly surprising was the observation that for SNPs, known to affect the volume of platelets or erythrocytes the identified trans-eQTL effects in whole blood were also present in these monocytes. Among these replicated genes are a considerable number of highly plausible trans-genes. For example, for mean platelet volume SNP rs12485738 we detected the same trans-eQTL effects on seven well-known blood coagulation genes (F13A1, GP1BB, GP9, ITGA2B, MMRN1, THBS1 and VWF) in both the peripheral blood data and the monocyte data. Interestingly, in both datasets, trans-effects for this SNP on another 31 genes were identified as well, which suggests these genes play a role in blood coagulation. It can thus be concluded that trans-eQTLs, identified in peripheral blood, generally apply to monocytes as well. We assumed these eQTLs might therefore also be present in other, non-blood tissues, as previously observed for rodents [47]–[49]. Indeed we could replicate some of these trans-eQTLs in a smaller dataset of four non-blood tissues. Importantly, as mentioned before [46], the allelic directions were nearly always identical to blood, which implies that trans-eQTLs, if also present in another tissue, work in the same way.
Our observation that sets of independent SNPs, associated with the same complex phenotype sometimes also affect exactly the same trans-gene, further substantiates the validity of our findings. Based on the reported effect-sizes of these variants on these complex phenotypes, we have shown here that the individual effects of these SNPs on trans-gene expression can often be stronger. This suggests that these down-stream gene expression effects do not fully propagate to the eventual phenotype and are somehow buffered. This ‘phenotypic buffering’ has been observed before in plants [44] and suggests that additional compensatory mechanisms exist that control these complex phenotypes. However, we do realize that accurate estimates on this phenomenon requires the availability of both gene-expression and phenotype data for these traits. As we did not have these phenotypes for our samples, we relied upon estimates from literature. Future studies that have collected both genome-wide genotype, expression and phenotype data from the same individuals will permit answering the question what the extent of this phenotypic buffering is. We should emphasize that the number of converging pairs of SNPs that we identified must be a very strong underestimate, and as such the false-negative rate from this analysis is likely to be high: As we observed that on average 40.4% of the trait-associated SNPs affect gene expression levels in cis, we expect that many of these SNPs will exert effects on gene expression in trans. However, these effects are likely to be small and due to multiple testing issues our current study identified only a relatively small set of trans-eQTL effects. Likewise the number of detected converging pairs of SNPs is even smaller. However, as we observed this convergence for various pairs of SNPs, future genetical genomics studies using larger sample sizes will likely reveal many more pairs of converging SNPs, providing better insight in the downstream molecular mechanisms that are affected by these disorders.
The convergence and phenotypic buffering we observed might also help uncover some of the missing heritability in complex disease. As there are probably many SNPs with low marginal phenotypic effects [50], GWAS currently lack power to detect these. However, the effect of these trait-associated SNPs on expression seems to be less multifactorial, leading to larger expression effects. These numerous expression disturbances will eventually converge to a phenotype, explaining the small phenotypic effect of individual trait-associated SNPs.
Therefore, studying expression as intermediate phenotype will be important for disease association studies trying to account for the missing heritability of complex diseases. Disease SNPs, already found to be disease-associated and marked as eQTL, lead to a set of candidate downstream genes. Additional genetic variants that also affect the expression of these genes will therefore be powerful candidates for disease susceptibility.
Materials and Methods
Peripheral blood genetical genomics study populations
The peripheral blood genetical genomics study population contained 1,469 unrelated individuals from the United Kingdom and the Netherlands. Some of these are healthy controls while others are patient samples. The 49 ulcerative colitis (UC) cases in this study are part of the inflammatory bowel disease (IBD) cohort of the University Medical Centre Groningen. The 111 celiac disease samples were collected within the Barts and the London NHS Trust and the Oxford Radcliffe Hospitals NHS Trust. The 453 chronic obstructive pulmonary disease (COPD) samples were collected within the NELSON study. The 856 amyotrophic lateral sclerosis (ALS) cases and controls were collected in the University Medical Centre Utrecht. All samples were collected after informed consent and approved by local ethical review boards. Individual sample information is provided in Table S11.
Peripheral blood (2.5 ml) for all samples was collected with the PAXgene system (PreAnalytix GmbH, UK). PAXgene vials were chosen to prevent density gradient centrifugation, immortalization or in vitro cell culture artifacts changing mRNA profiles. PAXgene tubes were mixed gently and incubated at room temperature for two hours. After collection, tubes were frozen at −20°C for at least 24 hours followed by storage at −80°C. RNA was isolated using the PAXgene Blood RNA isolation kit (PreAnalytix GmbH, UK). RNA was quantified using the Nanodrop (Nanodrop Technologies, USA). Total RNA integrity was analyzed using an Agilent Bioanalyzer (Agilent Technologies, USA).
Peripheral blood SNP genotyping
Peripheral blood samples were either genotyped using the Illumina (Illumina, San Diego, USA) HumanHap300, HumanHap370 or 610 Quad platform. Genotyping was performed according to standard protocols from Illumina. Although the different genotype oligonucleotide arrays differ, they share 294,757 SNPs, to which the analysis was confined. In addition, SNPs with a minor allele frequency of <5%, or a call-rate <95%, or deviating from Hardy-Weinberg equilibrium (exact p-value <0.001) were excluded, resulting in 289,044 SNPs for further analysis. Genotype calling for each SNP was performed by a previously described algorithm [51].
Peripheral blood Illumina expression profiling
Anti-sense RNA was synthesized, amplified and purified using the Ambion Illumina TotalPrep Amplification Kit (Ambion, USA) following the manufacturers' protocol. Complementary RNA was either hybridized to Illumina HumanRef-8 v2 arrays (229 samples, further referred to as H8v2) or Illumina HumanHT-12 arrays (1,240 samples, further referred to as HT12) and scanned on the Illumina BeadArray Reader. Raw probe intensities were extracted using Illumina's BeadStudio Gene Expression module v3.2 (No background correction was applied, nor did we remove probes with low expression). The raw expression data of the 1,240 HT12 peripheral blood samples were combined with the raw expression data of 296 replication samples (described in detail in paragraph ‘Trans-eQTL replication dataset’). Both datasets (H8v2 and HT12) were quantile normalized separately to the median distribution and expression values were subsequently log2 transformed. Subsequently, the probes were centered to zero and linearly scaled such that each probe had a standard deviation of one.
Integration of the Illumina H8V2 and HT12 peripheral blood expression platform identifiers
The HT12 and H8v2 arrays share a considerable number of probes with identical probe sequences. However, in a considerable number of occasions the two platforms use different probe identifiers for the same probe sequences. More importantly, although probe identifiers are often identical, they sometimes represent different probe sequences. In order to permit a meta-analysis incorporating data from both arrays, we decided on the following naming convention: if an H8v2 probe had the same sequence as an HT12 probe, the HT12 ‘ArrayAddressID’ probe identifier was used. If not, the original H8v2 probe identifier was used, but with the prefix “Human_RefSeq-8_v2-” to prevent any potential probe identifier ambiguity. A total of 52,061 unique probes were used for further analysis, representing 19,609 unique genes according to HUGO gene nomenclature.
Initial genomic mapping of Illumina expression probe sequences
Various mapping strategies were used for the expression probes to get a mapping location that was as unambiguous as possible: if probes have been mapped incorrectly, or cross-hybridize to multiple genomic loci, it might be that an eQTL will be incorrectly deemed a trans-eQTL, while in fact it is a cis-eQTL or primer polymorphisms. We used Ensembl database version 52 (NCBI 36.3 assembly) to obtain, for each annotated gene, the transcript with the largest number of exons and included this main spliced transcript in our reference set. Second, we added one sequence per intron, extending intron boundaries 40 bp on each side to allow mapping of the 50 bp probe sequences that overlapping exon-intron junctions. Last, a version of the reference DNA genome with masked annotated transcripts was included. Probe sequences were mapped using NOVOALIGN V2.05.12 for all the sequences (main transcript, introns, and non standard exon-exon junctions) originating from the same transcript (parameters −t 150 −v 20 20 200 [>]( [ ̂_]*)_). For each probe it was determined whether it was mapping uniquely to one particular genomic locus, or, if multiple hits were present whether all these mappings resided in each other vicinity (<250 kb). Probes that did not map at all, or mapped to multiple different loci were excluded from further analyses. Using this approach, 43,202 of the 48,751 probes on the HT12 and 21,316 of the 22,185 probes on the H8v2 platform were eventually mapped to a single genomic location.
eQTL mapping
In order to detect cis-eQTLs, analysis was confined to those probe-SNP combinations for which the distance from the probe transcript midpoint to SNP genomic location was ≤250 kb. For trans-eQTLs, analysis was confined to those probe-SNP combinations for which the distance from probe transcript midpoint to SNP genomic location was ≥5 Mb (to exclude the possibility of accidentally detecting cis-eQTLs due to long ranging linkage disequilibrium). Additionally, for the trans-eQTL analysis the effects of the significant cis-eQTLs were removed from the expression data by keeping the residual expression after linear regression.
Association for cis - and trans-eQTL was tested with a non-parametric Spearman's rank correlation. For directly genotyped SNPs we coded genotypes as 0, 1 or 2, while for imputed SNPs we used SNP dosage values, ranging between 0 and 2. When a particular probe-SNP pair was present in both the HT12 and H8v2 datasets, an overall, joint p-value was calculated using a weighted (square root of the dataset sample number) Z-method.
To correct for multiple testing, we controlled the false-discovery rate (FDR) at 0.05: the distribution of observed p-values was used to calculate the FDR, by comparison with the distribution obtained from permuting expression phenotypes relative to genotypes 100 times within the HT12 and H8v2 dataset for both the cis - and trans - analyses [52].
In order to increase the number of detectable cis - and trans-eQTLs we applied a principal component analysis (PCA) on the sample correlation matrix. We, among others [19], [20], argue that the dominant PCs, capturing the larger part of the total variation, will primarily capture sample differences in expression that reflect physiological or environmental variation as well as systematic experimental variation (e.g. batch and technical effects). Figure S6 shows for the 1,240 HT12 samples what per individual the PC scores are. It is evident there are, especially among the first PCs, strong batch effects are still present after proper quantile-quantile normalization. By removing the variation captured by these PCs, we expected that the residual expression is more strongly determined by genetic variants and the number of significantly detected cis - and trans-eQTLs will increase. An aspect to consider is that with the removal of more PCs from the data, the degrees of freedom of the data will decrease. Furthermore, it is not immediately clear which PCs will actually capture physiological, environmental, and systematic variation, which might lead to removal of genetically determined expression variation as well. Therefore a tradeoff has to be made on the number of PCs to subtract from the data. We assessed this systematically, by removing up to 100 PCs from the genetical genomics dataset (in steps of 5).
Figure S7A shows that the number of significantly detected cis-eQTL probes increases two-fold when 50 PCs were removed from the expression data. There is a long plateau visible (around PC50), where the number of detected cis-eQTLs probes remains approximately constant, irrespective of removing for instance 10 fewer or 10 extra PCs (reported numbers in this figure also include false-positive eQTLs due to potential primer polymorphisms, as we here wanted to solely compare the performance of removing different numbers of PCs). Figure S7B shows that of the initial 5,950 significantly detected cis-eQTL probes (no PCs removed), 4,965 (83.5%) were still detected with 50 PCs subtracted. The 985 initially detected cis-eQTLs probes, yet no longer detected when 50 PCs had been removed from the expression data, all had a low significance (Figure S8). As we controlled the FDR at 0.05 in all analyses it is therefore likely that a considerable amount of these reflect false-positives. Figure S8C shows that for all the overlapping 4,965 detected cis-eQTLs probes between the different analyses, the allelic direction was identical, and effect size on expression correlate well (Pearson r = 0.95) although these were nearly always stronger after having subtracted 50 PCs.
We assessed this for trans-eQTLs as well. An important aspect to consider is that trans-eQTL SNPs might affect multiple genes. If these effects are substantial (either in effect size or the number of affected genes), it is likely that a certain PC will capture this. Removal of such PCs from the expression data will therefore unintentionally result in the inability to detect these trans-eQTLs. In order to avoid such false-negatives we first performed a QTL analysis on the first 50 PCs (that had been removed from the expression data for the cis-eQTL analysis) to assess whether some of these PCs are under genetic control (genome-wide analysis, controlling FDR at 0.05). We did this for the large HT12 and the smaller H8v2 expression data separately, as PCA had been applied independently to these datasets. We observed that out of the first 25 PCs in the HT12 data three PCs and in the H8v2 two PCs were to some extent genetically determined (r2>5%). This was different for PCAs 26–50 in the HT12 data: 11 PCs were under substantial genetic control (Figure S9a).
We therefore assumed that most trans-eQTLs could be detected when removing approximately 25 PCs. We quantified this systematically, by removing increasing amounts of PCs from the expression data and conducting a full genome-wide trans-eQTL mapping. Indeed, in these analyses at most 244 significant trans-eQTLs could be detected (at FDR 0.05, with potential false-positives due to cross-hybridizations removed), when removing 25 PCs (Figure S9b). The overlap with the expression with no PCs removed was substantial: 62 of the 82 trans-eQTLs (77%), detected in the original analysis were detected as well in the analysis with 25 PCs removed (Figure S9c), all with identical allelic directions (Figure S9d).
Identification of false eQTLs due to primer polymorphisms and cross-hybridization
One should be aware that sequence polymorphisms can cause many false cis-eQTLs [53]. Such false cis-eQTLs do not reflect actual expression differences caused by sequence polymorphisms in cis-acting factors that affect mRNA levels. Instead they indicate hybridization differences caused by sequence polymorphisms in the mRNA region that is targeted by the microarray expression probes. Therefore, SNP-probe combinations were excluded from the cis-eQTL analysis when the 50 bp long expression probe mapped to a genomic location that contained a known SNP that was showing at least some LD (r2>0.1) with the cis-SNP. We used SNP data from the 1000 Genomes Projects, as it contains LD information for 9,633,115 SNPs (April 2009 release, based on 57 CEU samples of European descent).
Detected trans-eQTLs might also reflect false-positives, although we initially had attempted to map the expression probes as accurately as possible, by using the aforementioned three different mapping strategies: it is still well possible that some of the identified, putative trans-eQTLs in fact reflect very subtle cross-hybridization (e.g. pertaining to only a small subsequence of the probe). We therefore tried to falsify each of the putative trans-eQTLs by attempting to map each trans-probe into the vicinity of the SNP probe location, by using a highly relaxed mapping approach. All putative Illumina trans-expression probes were mapped using SHRiMP [54], which uses a global alignment approach, to the human reference genome (NCBI 36.3 build). The mapping settings were chosen very loosely to permit the identification of nearly all potential hybridization locations: match score was 10, the mismatch score was 0, the gap open penalty was −250, the gap extension penalty was −100, Smith and Waterman minimum identical alignment threshold was 30.0%, while other SHRiMP parameters were left at default. Using these settings all mappings with a minimum overlap of 15 bases, or with 20 matches with one mismatch, or 30 matches with 2 mismatches, or full-length (50 bp) probe hybridizations with no more than 15 mismatches were accepted. Any trans-eQTL was discarded, if the expression probe had a mapping that was within 2 Mb of the SNP that showed the trans-eQTL effect. Once these potential false-positive trans-eQTLs had been removed from the real, non-permuted data, we repeated the multiple testing correction (again controlling the FDR at 0.05).
Using this strategy we observed several instances where only 20 out the 50 bases of a probe sequence mapped in the vicinity of the trans-SNP (data not shown). For these trans-eQTLs the Spearman's rank correlation p was often lower than 10−100, which would imply these SNPs explain over 25% of the total expression variation of the corresponding trans-genes. Given the small amount of trans-eQTLs we detected in total, such effect sizes are quite unlikely and therefore provide circumstantial evidence these indeed reflect cross-hybridization artifacts.
We also assessed whether any of the Illumina SNPs that constitute trans-eQTLs might map to a different position than what is reported in dbSNP. As such we mapped the 50 bp Illumina SNP probe sequences to the genome assembly, permitting up to four mismatches per 50 bp SNP probe sequence. We did not observe any SNP that could map (with some mismatches) to the same chromosome of the trans-probe.
It is still possible that some of the trans-eQTLs for which we did not find any evidence of cross-hybridization, still are false positives, e.g. by missing some cross-hybridizations due to imperfections in the NCBI v36 assembly we used. Although we have identified numerous occasions where a SNP affects two different probes within the same gene in trans, substantiating the likelihood these trans-eQTLs are real, providing unequivocal evidence that all our reported trans-eQTLs are real is not straightforward.
Enrichment analysis of trait-associated SNPs and SNPs located within the HLA region
To assess enrichment of trait-associated SNPs, we used a collection of 1,262 unique SNPs from 'A Catalog of Published Genome-Wide Association Studies' (accessed 09 February 2010, and each having at least one reported association p-value <5.0×10⁻⁷). We could successfully impute the genotypes for 1,167 of these SNPs and therefore confined all analyses to these SNPs. Of these SNPs 572 had been directly genotyped on the Illumina HumanHap300 platform, with a MAF>0.05, an HWE exact p-value >0.0001 and call-rate >95%.
To ascertain whether these SNPs are more often constituting an eQTL than expected, we used a methodology that is not affected by the following potential confounders: non-even distribution of SNP markers and expression probe markers across the genome, differences in MAF between SNPs and LD structure within the genotype date and correlation between probes in the expression data. Additionally, this methodology is also not confounded by the fact that for certain traits different SNPs in strong LD can have been reported, due to differences in the platforms that were used to identify these loci.
We first determined how many unique eQTL SNPs had been identified in the original eQTL mapping (with an FDR<0.05) and how many of these are trait-associated. Subsequently we permuted the expression phenotypes relative to the genotypes (thus keeping the correlation structure within the genotype data and the correlation structure within the expression data intact, yet assigning the genotypes of a sample to the expression data of a randomly chosen sample) and reran the eQTL mapping, sorting all tested eQTLs on highest significance. We then took an equal number of top associated, but permuted, eQTL SNPs and determined how many of these permuted eQTL SNPs are trait-associated. By performing 100 permutations we obtained an empiric distribution of the number of trait-associated SNPs expected by chance. We subsequently fitted a generalized extreme value distribution (EVD, using the EVD add-on package for R), permitting us to estimate realistic enrichment significance estimates (called EVD p throughout the manuscript).
For the MHC enrichment analysis the followed procedure was identical, with the difference that we looked for enrichment for SNPs within the MHC, defined as SNPs physically mapping between 20 Mb and 40 Mb on chromosome 6 (NCBI 36 assembly).
Trans-eQTL replication datasets
Replication of the detected eQTLs was performed in monocytes from 1,490 different samples [45] and in an independent population of 86 morbidly obese individuals that underwent elective bariatric surgery (Department of general surgery, Maastricht University Medical Centre, the Netherlands). Both these datasets also used the same Illumina HumanHT-12 expression platform.
For the 1,490 monocyte samples eQTL P-Values summary statistics were available for all monocyte trans-eQTLs with a nominal p<1.0×10⁻⁵. We ascertained how many of the trans-eQTLs we had found in our peripheral blood data had a nominal eQTL p<1.0×10⁻⁵ in this monocyte dataset.
We also assessed trans-eQTLs in four different tissues from the 86 morbidly obese individuals that underwent bariatric surgery. DNA was extracted from blood samples using the Chemagic Magnetic Separation Module 1 (Chemagen) integrated with a Multiprobe II Pipeting robot (PerkinElmer). All samples were genotyped using both Illumina HumanCytoSNP-12 BeadChips and Illumina HumanOmni1-Quad BeadChips (QC was identical as was applied to the peripheral blood samples). We imputed HapMap 2 genotypes using Impute version 2.0. In addition expression profiling was performed for four different tissues for each of these individuals using the Illumina HumanHT-12 arrays. Wedge biopsies of liver, visceral adipose tissue (VAT, omentum majus), subcutaneous adipose tissue (SAT, abdominal), and muscle (musculus rectus abdominis) were taken during surgery. RNA was isolated using the Qiagen Lipid Tissue Mini Kit (Qiagen, UK, 74804). Assessment of RNA quality and concentration was done with an Agilent Bioanalyzer (Agilent Technologies USA). Starting with 200 ng of RNA, the Ambion Illumina TotalPrep Amplification Kit was used for anti-sense RNA synthesis, amplification, and purification according to the protocol provided by the manufacturer (Ambion, USA). 750 ng of complementary RNA was hybridized to Illumina HumanHT12 BeadChips and scanned on the Illumina BeadArray Reader. Expression data preprocessing was as mentioned before. We first attempted to replicate the trait-associated trans-eQTLs per tissue, using an FDR of 0.05 and 100 permutations. Subsequently we conducted a meta-analysis, combining the four tissues. Per trans-eQTL we used a weighted Z-method to combine the four individual p-values. However, these four datasets are not independent, as they reflect the same individuals. We resolved this by conducting the permutations in such a way that in every permutation round the samples were permuted in exactly the same way for each of the four tissues. By doing this we retained the correlations that exist between the different tissues per sample, and were able to get a realistic empiric (null-)distribution of expected test-statistics.
Convergence analysis
Per trait we assessed all the SNPs that have been reported to be associated with that particular trait. We analyzed per trait all possible SNP-pairs. If a pair of SNPs was not in LD (r2<0.001) we assessed whether they affected the same gene in cis or trans. When using the trait-associated cis - and trans-eQTLs that had been identified when controlling the FDR at 0.05, we identified 7 unique pairs of SNPs that caused both the same phenotype and also affected the same gene(s). When using a somewhat more relaxed set of trans-eQTLs, identified when controlling the FDR at 0.5, we identified 18 unique pairs of SNPs that affect the same downstream gene.
We assessed whether these numbers were significantly higher than expected, by using the same strategy that we had used to assess the enrichment of trait-associated SNPs and the HLA; we ran 100 permutations. We kept per permutation the cis-eQTL list as it was, but generated a permuted set of trans-eQTLs, equal in size to the original set of non-permuted trans-eQTLs. This enabled us to determine per permutation round how many unique pairs of SNPs converge on the same gene(s). We subsequently fitted a generalized extreme value distribution, permitting us to estimate realistic enrichment significance estimates.
Co-expression between genes, based on HT12 peripheral blood co-expression
If a particular SNP is cis - or trans-acting on multiple genes, it is plausible that those genes are biologically related. Co-expression between these genes provides circumstantial evidence this is the case, strengthening the likelihood such cis - and trans-eQTLs are real. We assessed this in the peripheral blood data, by using the expression data of the 1,240 samples, run on the comprehensive HT12 expression platform. As we had removed 25 PCs (to remove physiological, environmental variation, and systematic experimental variation) for the trans-eQTL analyses, we decided to confine co-expression analyses to this expression dataset. As there are 43,202 HT12 probes that we mapped to a known genomic location, 43,202×43,201/2 = 933,184,801 probe-pairs exist. Given 1,240 samples, a Pearson correlation coefficient r≥0.19 corresponds to a p<0.05 when applying stringent Bonferroni correction for these number of probe-pairs.
Accession numbers
Expression data for both the peripheral blood and the four non-blood datasets have been deposited in GEO with accession numbers GSE20142 (1,240 peripheral blood samples, hybridized to HT12 arrays), GSE20332 (229 peripheral blood samples, hybridized to H8v2 arrays) and GSE22070 (subcutaneous adipose, visceral adipose, muscle and liver samples).
Supporting Information
Zdroje
1. HindorffLASethupathyPJunkinsHARamosEMMehtaJP 2009 Potential etiologic and functional implications of genome-wide association loci for human diseases and traits. Proc Natl Acad Sci U S A 106 9362 9367
2. DuboisPCTrynkaGFrankeLHuntKARomanosJ 2010 Multiple common variants for celiac disease influencing immune gene expression. Nat Genet
3. BarrettJCClaytonDGConcannonPAkolkarBCooperJD 2009 Genome-wide association study and meta-analysis find that over 40 loci affect risk of type 1 diabetes. Nat Genet
4. GregersenPKAmosCILeeATLuYRemmersEF 2009 REL, encoding a member of the NF-kappaB family of transcription factors, is a newly defined risk locus for rheumatoid arthritis. Nat Genet 41 820 823
5. ImielinskiMBaldassanoRNGriffithsARussellRKAnneseV 2009 Common variants at five new loci associated with early-onset inflammatory bowel disease. Nat Genet 41 1335 1340
6. KochiYOkadaYSuzukiAIkariKTeraoC 2010 A regulatory variant in CCR6 is associated with rheumatoid arthritis susceptibility. Nat Genet 42 515 519
7. NairRPDuffinKCHelmsCDingJStuartPE 2009 Genome-wide scan reveals association of psoriasis with IL-23 and NF-kappaB pathways. Nat Genet 41 199 204
8. O'DonovanMCCraddockNNortonNWilliamsHPeirceT 2008 Identification of loci associated with schizophrenia by genome-wide association and follow-up. Nat Genet 40 1053 1055
9. SkibolaCFBracciPMHalperinECondeLCraigDW 2009 Genetic variants at 6p21.33 are associated with susceptibility to follicular lymphoma. Nat Genet 41 873 875
10. WangYBroderickPWebbEWuXVijayakrishnanJ 2008 Common 5p15.33 and 6p21.33 variants influence lung cancer risk. Nat Genet 40 1407 1409
11. van HeelDAWestJ 2006 Recent advances in coeliac disease. Gut 55 1037 1046
12. ChoyEYelenskyRBonakdarSPlengeRMSaxenaR 2008 Genetic analysis of human traits in vitro: drug response and gene expression in lymphoblastoid cell lines. PLoS Genet 4 e1000287 doi:0.1371/journal.pgen.1000287
13. DixonALLiangLMoffattMFChenWHeathS 2007 A genome-wide association study of global gene expression. Nat Genet 39 1202 1207
14. HeapGATrynkaGJansenRCBruinenbergMSwertzMA 2009 Complex nature of SNP genotype effects on gene expression in primary human leucocytes. BMC Med Genomics 2 1
15. MoffattMFKabeschMLiangLDixonALStrachanD 2007 Genetic variants regulating ORMDL3 expression contribute to the risk of childhood asthma. Nature 448 470 473
16. StrangerBEForrestMSDunningMIngleCEBeazleyC 2007 Relative impact of nucleotide and copy number variation on gene expression phenotypes. Science 315 848 853
17. JansenRCNapJP 2001 Genetical genomics: the added value from segregation. Trends Genet 17 388 391
18. IdaghdourYCzikaWShiannaKVLeeSHVisscherPM 2010 Geographical genomics of human leukocyte gene expression variation in southern Morocco. Nat Genet 42 62 67
19. BiswasSStoreyJDAkeyJM 2008 Mapping gene expression quantitative trait loci by singular value decomposition and independent component analysis. BMC Bioinformatics 9 244
20. LeekJTStoreyJD 2007 Capturing heterogeneity in gene expression studies by surrogate variable analysis. PLoS Genet 3 e161 doi:10.1371/journal.pgen.0030161
21. NicaACMontgomerySBDimasASStrangerBEBeazleyC 2010 Candidate causal regulatory effects by integration of expression QTLs with complex trait genetic associations. PLoS Genet 6 e1000895 doi:10.1371/journal.pgen.1000895
22. NicolaeDLGamazonEZhangWDuanSDolanME 2010 Trait-associated SNPs are more likely to be eQTLs: annotation to enhance discovery from GWAS. PLoS Genet 6 e1000888 doi:10.1371/journal.pgen.1000888
23. EmilssonVThorleifssonGZhangBLeonardsonASZinkF 2008 Genetics of gene expression and its effect on disease. Nature 452 423 428
24. SchadtEEMolonyCChudinEHaoKYangX 2008 Mapping the genetic architecture of gene expression in human liver. PLoS Biol 6 e107 doi:10.1371/journal.pbio.0060107
25. ZhongHYangXKaplanLMMolonyCSchadtEE 2010 Integrating pathway analysis and genetics of gene expression for genome-wide association studies. Am J Hum Genet 86 581 591
26. MarchiniJHowieBMyersSMcVeanGDonnellyP 2007 A new multipoint method for genome-wide association studies by imputation of genotypes. Nat Genet 39 906 913
27. SilverbergMSChoJHRiouxJDMcGovernDPWuJ 2009 Ulcerative colitis-risk loci on chromosomes 1p36 and 12q15 found by genome-wide association study. Nat Genet 41 216 220
28. AbrahamCChoJH 2009 Inflammatory bowel disease. N Engl J Med 361 2066 2078
29. HuynhDDaiXMNandiSLightowlerSTrivettM 2009 Colony stimulating factor-1 dependence of paneth cell development in the mouse small intestine. Gastroenterology 137 : 136-144, 144 e131-133
30. MombaertsPMizoguchiEGrusbyMJGlimcherLHBhanAK 1993 Spontaneous development of inflammatory bowel disease in T cell receptor mutant mice. Cell 75 274 282
31. EikeMCOlssonMUndlienDEDahl-JorgensenKJonerG 2009 Genetic variants of the HLA-A, HLA-B and AIF1 loci show independent associations with type 1 diabetes in Norwegian families. Genes Immun 10 141 150
32. ValdesAMThomsonG 2009 Several loci in the HLA class III region are associated with T1D risk after adjusting for DRB1-DQB1. Diabetes Obes Metab 11 Suppl 1 46 52
33. YangBHoulbergKMillwardADemaineA 2004 Polymorphisms of chemokine and chemokine receptor genes in Type 1 diabetes mellitus and its complications. Cytokine 26 114 121
34. EastonDFPooleyKADunningAMPharoahPDThompsonD 2007 Genome-wide association study identifies novel breast cancer susceptibility loci. Nature 447 1087 1093
35. van 't VeerLJDaiHvan de VijverMJHeYDHartAA 2002 Gene expression profiling predicts clinical outcome of breast cancer. Nature 415 530 536
36. YuJXSieuwertsAMZhangYMartensJWSmidM 2007 Pathway analysis of gene signatures predicting metastasis of node-negative primary breast cancer. BMC Cancer 7 182
37. GilmanJGHuismanTH 1985 DNA sequence variation associated with elevated fetal G gamma globin production. Blood 66 783 787
38. MenzelSGarnerCGutIMatsudaFYamaguchiM 2007 A QTL influencing F cell production maps to a gene encoding a zinc-finger protein on chromosome 2p15. Nat Genet 39 1197 1199
39. TheinSLMenzelSPengXBestSJiangJ 2007 Intergenic variants of HBS1L-MYB are responsible for a major quantitative trait locus on chromosome 6q23 influencing fetal hemoglobin levels in adults. Proc Natl Acad Sci U S A 104 11346 11351
40. NuinoonMMakarasaraWMushirodaTSetianingsihIWahidiyatPA 2010 A genome-wide association identified the common genetic variants influence disease severity in beta0-thalassemia/hemoglobin E. Hum Genet 127 303 314
41. GaneshSKZakaiNAvan RooijFJSoranzoNSmithAV 2009 Multiple loci influence erythrocyte phenotypes in the CHARGE Consortium. Nat Genet 41 1191 1198
42. SoranzoNSpectorTDManginoMKuhnelBRendonA 2009 A genome-wide meta-analysis identifies 22 loci associated with eight hematological parameters in the HaemGen consortium. Nat Genet 41 1182 1190
43. WatkinsNAGusnantoAde BonoBDeSMiranda-SaavedraD 2009 A HaemAtlas: characterizing gene expression in differentiated human blood cells. Blood 113 e1 9
44. FuJKeurentjesJJBouwmeesterHAmericaTVerstappenFW 2009 System-wide molecular evidence for phenotypic buffering in Arabidopsis. Nat Genet 41 166 167
45. ZellerTWildPSzymczakSRotivalMSchillertA 2010 Genetics and beyond—the transcriptome of human monocytes and disease susceptibility. PLoS ONE 5 e10693 doi:10.1371/journal.pone.0010693
46. DimasASDeutschSStrangerBEMontgomerySBBorelC 2009 Common regulatory variation impacts gene expression in a cell type-dependent manner. Science 325 1246 1250
47. PeirceJLLiHWangJManlyKFHitzemannRJ 2006 How replicable are mRNA expression QTL? Mamm Genome 17 643 656
48. PetrettoEBottoloLLangleySRHeinigMMcDermott-RoeC 2010 New insights into the genetic control of gene expression using a Bayesian multi-tissue approach. PLoS Comput Biol 6 e1000737 doi:10.1371/journal.pcbi.1000737
49. PetrettoEMangionJDickensNJCookSAKumaranMK 2006 Heritability and tissue specificity of expression quantitative trait loci. PLoS Genet 2 e172 doi:10.1371/journal.pgen.0020172
50. YangJBenyaminBMcEvoyBPGordonSHendersAK 2010 Common SNPs explain a large proportion of the heritability for human height. Nat Genet 42 565 569
51. van HeelDAFrankeLHuntKAGwilliamRZhernakovaA 2007 A genome-wide association study for celiac disease identifies risk variants in the region harboring IL2 and IL21. Nat Genet 39 827 829
52. BreitlingRLiYTessonBMFuJWuC 2008 Genetical genomics: spotlight on QTL hotspots. PLoS Genet 4 e1000232 doi:10.1371/journal.pgen.1000232
53. AlbertsRTerpstraPLiYBreitlingRNapJP 2007 Sequence polymorphisms cause many false cis eQTLs. PLoS ONE 2 e622 doi:10.1371/journal.pone.0000622
54. RumbleSMLacroutePDalcaAVFiumeMSidowA 2009 SHRiMP: accurate mapping of short color-space reads. PLoS Comput Biol 5 e1000386 doi:10.1371/journal.pcbi.1000386
Štítky
Genetika Reprodukční medicínaČlánek vyšel v časopise
PLOS Genetics
2011 Číslo 8
Nejčtenější v tomto čísle
- An EMT–Driven Alternative Splicing Program Occurs in Human Breast Cancer and Modulates Cellular Phenotype
- Chromosome Painting Reveals Asynaptic Full Alignment of Homologs and HIM-8–Dependent Remodeling of Chromosome Territories during Meiosis
- A Pre-mRNA–Associating Factor Links Endogenous siRNAs to Chromatin Regulation
- Discovery of Sexual Dimorphisms in Metabolic and Genetic Biomarkers