
Genomic Analysis of the Necrotrophic Fungal Pathogens and
Sclerotinia sclerotiorum and Botrytis cinerea are closely related necrotrophic plant pathogenic fungi notable for their wide host ranges and environmental persistence. These attributes have made these species models for understanding the complexity of necrotrophic, broad host-range pathogenicity. Despite their similarities, the two species differ in mating behaviour and the ability to produce asexual spores. We have sequenced the genomes of one strain of S. sclerotiorum and two strains of B. cinerea. The comparative analysis of these genomes relative to one another and to other sequenced fungal genomes is provided here. Their 38–39 Mb genomes include 11,860–14,270 predicted genes, which share 83% amino acid identity on average between the two species. We have mapped the S. sclerotiorum assembly to 16 chromosomes and found large-scale co-linearity with the B. cinerea genomes. Seven percent of the S. sclerotiorum genome comprises transposable elements compared to <1% of B. cinerea. The arsenal of genes associated with necrotrophic processes is similar between the species, including genes involved in plant cell wall degradation and oxalic acid production. Analysis of secondary metabolism gene clusters revealed an expansion in number and diversity of B. cinerea–specific secondary metabolites relative to S. sclerotiorum. The potential diversity in secondary metabolism might be involved in adaptation to specific ecological niches. Comparative genome analysis revealed the basis of differing sexual mating compatibility systems between S. sclerotiorum and B. cinerea. The organization of the mating-type loci differs, and their structures provide evidence for the evolution of heterothallism from homothallism. These data shed light on the evolutionary and mechanistic bases of the genetically complex traits of necrotrophic pathogenicity and sexual mating. This resource should facilitate the functional studies designed to better understand what makes these fungi such successful and persistent pathogens of agronomic crops.
Published in the journal:
. PLoS Genet 7(8): e32767. doi:10.1371/journal.pgen.1002230
Category:
Research Article
doi:
https://doi.org/10.1371/journal.pgen.1002230
Summary
Sclerotinia sclerotiorum and Botrytis cinerea are closely related necrotrophic plant pathogenic fungi notable for their wide host ranges and environmental persistence. These attributes have made these species models for understanding the complexity of necrotrophic, broad host-range pathogenicity. Despite their similarities, the two species differ in mating behaviour and the ability to produce asexual spores. We have sequenced the genomes of one strain of S. sclerotiorum and two strains of B. cinerea. The comparative analysis of these genomes relative to one another and to other sequenced fungal genomes is provided here. Their 38–39 Mb genomes include 11,860–14,270 predicted genes, which share 83% amino acid identity on average between the two species. We have mapped the S. sclerotiorum assembly to 16 chromosomes and found large-scale co-linearity with the B. cinerea genomes. Seven percent of the S. sclerotiorum genome comprises transposable elements compared to <1% of B. cinerea. The arsenal of genes associated with necrotrophic processes is similar between the species, including genes involved in plant cell wall degradation and oxalic acid production. Analysis of secondary metabolism gene clusters revealed an expansion in number and diversity of B. cinerea–specific secondary metabolites relative to S. sclerotiorum. The potential diversity in secondary metabolism might be involved in adaptation to specific ecological niches. Comparative genome analysis revealed the basis of differing sexual mating compatibility systems between S. sclerotiorum and B. cinerea. The organization of the mating-type loci differs, and their structures provide evidence for the evolution of heterothallism from homothallism. These data shed light on the evolutionary and mechanistic bases of the genetically complex traits of necrotrophic pathogenicity and sexual mating. This resource should facilitate the functional studies designed to better understand what makes these fungi such successful and persistent pathogens of agronomic crops.
Introduction
Phytopathogenic fungi have evolved a wide range of strategies to infect and colonize plants through both convergent and divergent adaptations. This is reflected in the occurrence of species within common evolutionary branches with widely diverse pathogenic lifestyles, ranging from obligate biotrophs to necrotrophs, and from host-specific to broad host range pathogens. Operationally, necrotrophs have been defined as pathogens that derive nutrients from killed host cells, biotrophs as pathogens that derive nutrients from living tissues and hemibiotrophs as pathogens that derive nutrients from a combination of feeding from living and killed host cells, respectively. The mechanisms that drive these adaptations remain largely enigmatic.
Among the few pathogens considered to be exemplary necrotrophs are the white mold fungus Sclerotinia sclerotiorum (Lib.) de Bary and the taxonomically closely related grey mold fungus Botrytis cinerea Pers. Fr. [teleomorph Botryotinia fuckeliana (de Bary) Whetzel]. Both fungi have considerably broader host ranges (>400 and >200 species, respectively) than most plant pathogens and each causes multi-millions of US dollars in pre - and postharvest crop losses world wide [1], [2]. Necrotrophs secrete an array of cell wall-degrading enzymes and toxins, which led to their reputation as relatively less adapted as compared to biotrophic fungi, which manipulate host physiology to obtain their nutrients from living tissues. Biotrophs are widely accepted to intimately interact and co-evolve with their hosts. Recent studies have, however, revealed that interactions between necrotrophs and their host plants are considerably more complex and subtle than previously appreciated. Some necrotrophs secrete effector proteins which are internalised by host cells and interact with the host in a gene-for-gene relationship to initiate disease, albeit in an inverse manner compared to biotrophs [3]. In the case of S. sclerotiorum and B. cinerea, the active modulation of the host redox status and the subversion of host (programmed) cell death pathways by the pathogen appear to be crucial for disease to develop [4]–[8]. The availability of molecular tools has considerably advanced our understanding of the infection strategies and pathogenic development of S. sclerotiorum and B. cinerea, yet only very few absolutely critical virulence determinants have been identified by candidate gene approaches [9].
Their ability to infect different plant species and tissues under a wide range of environmental conditions, as well as their ability to produce sclerotia that survive in the soil for many years, contribute to the persistent and widespread nature of these pathogens (Figure 1). The melanized sclerotium plays a central role in the lifecycle of both fungi by germinating either vegetatively for local colonization or carpogenically to initiate the sexual cycle including the production of apothecia from which ascospores are released (Figure 1). Although S. sclerotiorum and B. cinerea share many developmental and physiological features, important differences exist in their regulation and potential for sporulation. Dispersal of both species is via air-borne spores. S. sclerotiorum exclusively produces ascospores and not conidia (asexual spores). In contrast, B. cinerea, although capable of producing ascospores, is dispersed predominantly via conidia. Furthermore the regulation of sexual sporulation is quite different, S. sclerotiorum being homothallic (self–fertile) [1] and B. cinerea heterothallic (requiring a sexual partner of opposite mating type) [2]. These differences in mitotic and meiotic sporulation impact not only the life histories of these fungi but also their epidemiology and the disease control methods employed towards each.

The characteristics of S. sclerotiorum and B. cinerea pathogenicity and development stand in stark contrast to their fellow Leotiomycete powdery mildew fungi (e.g. Blumeria, Erisyphe, Podosphaera) which are obligate biotrophs often restricted at the species level to a single host genus. The recent description of genome sequences of two powdery mildew species [10] and two phylogenetically distant, restricted host range necrotrophs (Phaeosphaeria nodorum [11], Pyrenophora teres f. teres [12]) provides the opportunity to assess whether genomic features can be identified that are common to broad host range necrotrophs such as B.cinerea and S. sclerotiorum, yet distinct from other plant pathogenic fungi. Here we describe and compare the genome sequence assemblies and annotations for S. sclerotiorum and for two strains of B. cinerea. The comparative genome analyses of these two phytopathogenic fungi to each other, to a closely related powdery mildew and to distantly related necrotrophs offer insight into common genes underlying development and pathogenesis in S. sclerotiorum and B. cinerea, as well as genes that condition specific features of their pathogenic success.
Results/Discussion
Phylogenetic relationship between S. sclerotiorum and B. cinerea
S. sclerotiorum and B. cinerea are now the only fully sequenced species in the order Helotiales and with the obligate biotroph, Blumeria graminis, in the class Leotiomycetes of the Pezizomycotina, the largest subphylum of Ascomycota [10], [13], [14]. Within the Pezizomycotina, Leotiomycetes are most closely related to the sister lineage Sordariomycetes, and more distantly to the Eurofotiomycetes and the Dothideomycetes [14]–[16]. A phylogeny based on 82 completed fungal genomes anchors a well-supported and highly divergent Helotiales lineage including S. sclerotiorum and B. cinerea [17]. The order is, however, far too large and heterogeneous to be characterized by S. sclerotiorum and B. cinerea alone. Additional species are needed to increase the phylogenetic resolution.
We constructed a five-locus phylogeny rooted with Blumeria graminis, that includes two loci not previously used for this taxon sample, G3PDH and HSP60. This analysis confirms that the Sclerotiniaceae, Sclerotinia and Botrytis are closely related but distinct, monophyletic evolutionary lineages (Figure 2). This analysis also confirms that “Sclerotinia” homoeocarpa, an important pathogen of turf with morphology and etiology quite distinct from that of Sclerotinia, is not a Sclerotinia and should be reassigned to a genus in the family Rutstroemiaceae pending a reassessment of related species and generic limits. The Sclerotiniaceae includes obligate and facultative biotrophs, such as Myriosclerotinia species, as well as necrotrophs, as exemplified by Sclerotinia and Botrytis. Botrytis is divided in two sub-lineages as previously described [18]; one lineage is associated with both eudicots and monocots and the other with eudicots only. The strongly supported lineage with species of Sclerotinia on one branch, also includes the asexual Sclerotium cepivorum, an important pathogen of Allium, and a representative of the genus Dumontinia associated with wild plants such as Anemone (Ranunculaceae). Wang et al. [13] suggest that the ancestors of the lineages representing the Sclerotiniaceae and Rutstroemiaceae were associated with conifers, inferring a radiation of the Sclerotiniaceae and Rutstroemiaceae in association with the emergence and diversification of angiosperms. Co-evolution of Botrytis with host species has been investigated but evidence is inconclusive [18]; evidence would be concordant phylogenies between symbiont/pathogen species and host species, as demonstrated in Monilinia [19]. Estimates of divergence times in the phylogeny would require a molecular clock model that could be violated if some lineages have undergone accelerated evolution, as in a radiation event. Such estimates are inexact, especially when not calibrated, e.g., by fossil evidence.

Genome organization
General genome features
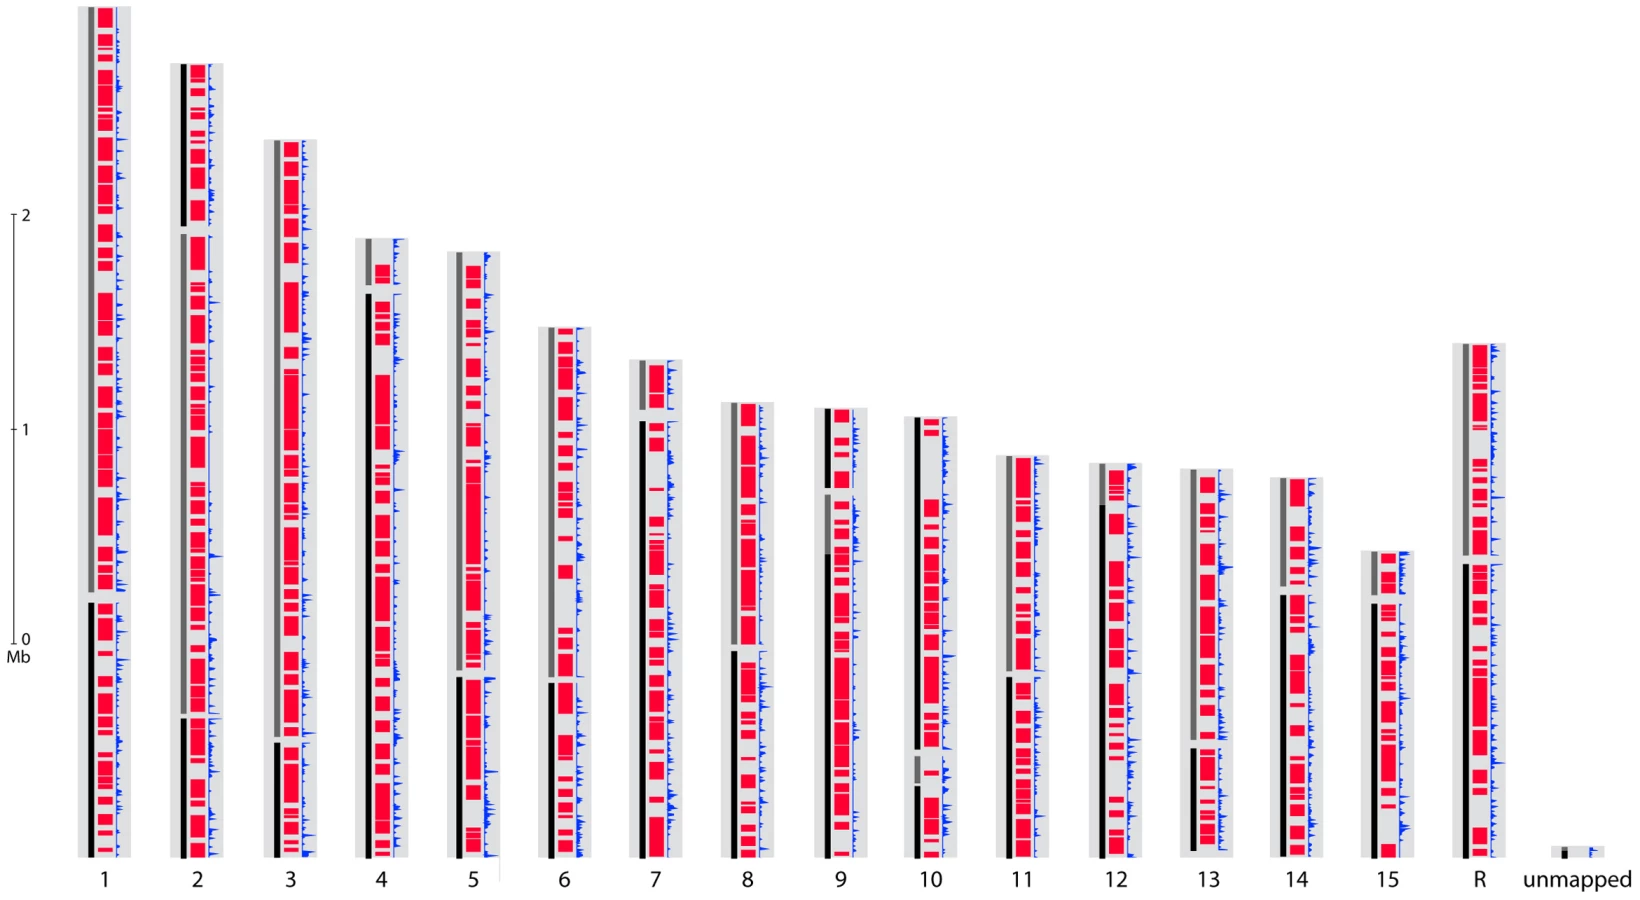
The genomes of S. sclerotiorum strain 1980 and B. cinerea strains T4 and B05.10 were sequenced using Sanger technology. High coverage (9.1X and 10X respectively) was generated for S. sclerotiorum 1980 and B. cinerea T4, and a lower coverage (4.5X) for B. cinerea B05.10 (Table 1). All sequences were assembled using Arachne [20] to generate a consensus for each genome. The three genomes are similar in size, ranging from 37.9 Mb to 38.8 Mb (Table 1). The slightly larger genome size for B. cinerea B05.10 (38.8 Mb) is likely inflated due to the lower sequence coverage, as small scaffolds may fall into larger scaffold gaps. To assess the accuracy and completeness of the S. sclerotiorum assembly, we generated an optical map, and aligned the 34 largest of the 36 assembly scaffolds to the optical map based on shared restriction sites (Figure S1). The map consists of 16 linkage groups which likely correspond to the estimation of 16 chromofsomes from pulsed-field gels of S. sclerotiorum chromosomes [21]. Microscopy in several Botrytis species, including B. cinerea, has estimated 16 chromosomes [22]. The total S. sclerotiorum optical map size is estimated at 39.6 Mb. Since 38.0 Mb is covered by scaffolds, approximately 1.6 Mb of sequence is missing from the assembly of S. sclerotiorum. Most of the uncovered regions of the map are located in the middle of chromosomes, which may correspond to centromeres (Figure S1). In many filamentous fungi, centromeres consist of highly repetitive sequences which can be refractory to cloning and therefore sequencing [23]. By contrast, most chromosomes are fully covered at their telomeric ends, with 28 of 32 chromosome ends being linked to telomeric repeats. One chromosome (chrR) ends in ribosomal DNA tandem repeats. The assembly of B. cinerea T4 was verified by generating a genetic map containing 134 polymorphic microsatellite markers and 62 SNPs, using 68 progeny from a cross (Text S1). The total length of scaffolds appearing in the genetic map (Table S1) covered 31.8 Mbp, representing 80% of the T4 sequence assembly. Two scaffolds were in conflict with the genetic map.

The average GC contents of S. sclerotiorum and B. cinerea genome sequences (41.8–43.2%) are comparable to Blumeria graminis (44%; [10]), but significantly lower than those from related fungi (50–52%, Pezizomycotina, Figure S2). Exon sequences in S. sclerotiorum and B. cinerea are 6% higher in GC content than introns (Table 1). GC% does not vary along contigs or chromosomes, and shows no evidence of AT-rich isochores, such as observed in Saccharomyces cerevisiae [24] or Leptosphaeria maculans [25], nor is it due to a bimodal distribution as observed in Neurospora crassa (Figure S2). The evenly distributed low GC content of Leotiomycetes, which distinguishes them from most other Pezizomycetes, may influence chromosome organization and steady state transcript levels [26].
The number of genes predicted in S. sclerotiorum strain 1980 (14,522 genes) and B. cinerea (16,448 and 16,360 genes for strains B05.10 and T4, respectively) is larger than those of related fungi (average 11,154 genes, Table S2). This discrepancy is mainly due to the large number (S. sclerotiorum: 3,461; B. cinerea B05.10 : 3,975; B. cinerea T4 : 4,229) of small predicted proteins less than 100 amino acids in length. Based on these observations, we revised the annotation process to flag small proteins without evidence as dubious. In order to be annotated, small proteins were required to show evidence of expression (ESTs and microarray signals), function (containing known domains) or evolutionary conservation (existence of orthologs or paralogs) (Figure S3). This resulted in a number of high confidence predicted proteins (S. sclerotiorum: 11,860; B. cinerea B05.10 : 13,664; B. cinerea T4 : 14,270), comparable to that of other fungal genomes (Figure S4 and Table S2).
Large synteny blocks are shared by S. sclerotiorum and B. cinerea
The gene sets of S. sclerotiorum and B. cinerea are highly similar with a total of 8,609 Bidirectional Best BLAST Hits (BDBHs) between S. sclerotiorum and B. cinerea B05.10 and 8,601 between S. sclerotiorum and B. cinerea T4. The protein sequences deduced from these pairs of BDBH genes have a median identity of 84.0%. A total of 19% of the S. sclerotiorum genome can be aligned at the nucleotide level to both B. cinerea genomes and 46% at the protein level. By contrast, nearly all of the two B. cinerea genomes can be aligned to each other, and these genomes share an average of 99.2% identity at the nucleotide level. To build syntenic regions between genomes, we used DAGchainer [27] to identify blocks of four or more orthologous BDBH gene pairs. Syntenic regions include 7,752 S. sclerotiorum genes with orthologs in B. cinerea; these regions also cover 3,618 unpaired genes from S. sclerotiorum that are enriched for dubious genes (2-fold more than the full genomes). Across all syntenic regions, the S. sclerotiorum genome shares 27.7 Mb with the B. cinerea T4 genome (Figure 3, Figure S5) and a similar amount with the B05.10 genome. Syntenic regions are distributed evenly across S. sclerotiorum chromosomes, including subtelomeric regions; some synteny breakpoints are marked by an increased density of repetitive elements in S. sclerotiorum (Figure 3). Further larger scale analysis of synteny requires anchoring the B. cinerea sequence onto chromosomes, using a genetic or physical map.
We also examined each of the genomes for segmental duplication blocks. The S. sclerotiorum genome contains 8 duplicated blocks ranging from 4 to 12 paired syntenic genes; only 2 duplicated blocks were identified in the B. cinerea B05.10 genome, and none in the B. cinerea T4 genome (Table S3). Of the 8 blocks in S. sclerotiorum, 4 contain genes encoding proteins similar to the heterokaryon incompatibility proteins HET-E-1 of Podospora anserina [28]. Most HET-E-1 homologs in S. sclerotiorum fall into a single gene family; in this family S. sclerotiorum has twice as many HET-E-1 domain containing genes as that of P. anserina, and three fold more than other fungi including B. cinerea. While duplicated blocks in B05.10 did not contain HET-like proteins, a different family of proteins with a HET domain (PF06985) is expanded in B. cinerea, with a total number of 65 or 79 in B05.10 or T4, respectively, compared to 41 in S. sclerotiorum. The recent expansion of two HET-domain containing families in both fungi suggests that these may have been involved in speciation.
Expansion of transposons in the S. sclerotiorum genofome
Repetitive sequences were first identified by self-alignment of each genome using cross match, revealing 7.7% of the S. sclerotiorum genome as repeats, as compared to 4.4% for B. cinerea B05.10 and 3.3% for B. cinerea T4 (Tables S4,S5). This de novo search identified 500 evenly distributed copies of a 300 bp element derived from the IGS region of the rDNA specific to S. sclerotiorum. rDNA derived repeats (>150 copies) have recently been described in the L. maculans genome [25], however such elements are more frequently found in plants [29]. Using the REPET pipeline [30], [31] and extensive manual annotation, transposable elements (TEs) were identified in S. sclerotiorum and B. cinerea genomes, grouped into families and annotated as either class I (LTR, LINE), class II (MITE, TIR) or unknown TEs (Table S6). They occupy 7% of the S. sclerotiorum genome and 0.6 to 0.9% of the B. cinerea genomes (T4, B05.10) respectively (Figure 4). Therefore, S. sclerotiorum has a 10-fold higher TE content than B. cinerea that is associated with an increase in the number of TE families (4-fold, N: 41) and the total number of TE copies (12-fold, N: 4143, Table S6). Moreover, S. sclerotiorum contains five families of high copy number LINE elements, which are not present in B. cinerea genomes (Table S6).

Despite the higher TE content of S. sclerotiorum, its genome size is similar to that of B. cinerea. This strongly contrasts with the related Leotiomycete B. graminis, which has a genome size of 130 Mb and a TE content of 64% [10]. We hypothesize that S. sclerotiorum has mechanisms to reduce the effects of TE expansion on genome organization. One such mechanism involves a reduction in TE length, as observed for S. sclerotiorum Gypsy and Copia retro-elements (Table S7) that are mainly composed of solo-LTRs (N: 2209; average ratio solo-LTRs/full-length copies: 42) scattered in the genome. Similar TEs in B. cinerea have a 20-fold lower proportion of solo-LTRs/full-length copies (average ratio 2; Table S7). Solo-LTRs result from recombination between LTRs of ancestral TE copies [32]. Since they represent only 1/10th of the length of intact retro-elements (average 5000 bp), the reduction in size from full-length retro-elements to solo-LTRs could have prevented an increase in genome size of 12 Mb (30% of the actual genome size), which would be expected if the S. sclerotiorum genome included 2,209 additional full-length retro-elements. The potential deleterious effect on the genome of such a large number of TEs appears to have been limited by truncating the majority of elements in the expanded retroelement families.
TEs in S. sclerotiorum are less diverse than those in B. cinerea. This is illustrated by the Mariner ScTIR1 family, which has a lower genetic diversity (θ: 0.12) including a subset of quasi-identical copies, as compared to the BcTIR1 family (θ: 0.24). Furthermore, ScTIR1 has 5 subfamilies consisting of 3 to 15 copies with identical sequences that are dispersed in the genome. Phylogenetic analysis suggests that a significant proportion of S. sclerotiorum TEs result from recent transposition events (Figure S6). These analyses highlight that the S. sclerotiorum genome experienced a profound, recent remodeling associated with a dramatic expansion of TEs. This recent evolution of the S. sclerotiorum genome is responsible for important differences in genome organization compared to B. cinerea. Indeed, loss of synteny between the two genomes is frequently associated with the presence of repeats at synteny break points (Figure 3). The TE expansion in S. sclerotiorum might also impact on its genome organization and functioning (gene inactivation, modification or regulation of expression).
Gene content
Gene conservation and evolution
We compared S. sclerotiorum and B. cinerea to a set of seven other genomes which include a biotrophic Leotiomycete (B. graminis), two non-related necrotrophs (Phaeosphaeria nodorum and P. teres), two hemi-biotrophic model plant pathogens (Magnaporthe oryzae and Gibberella zeae) and two saprobes (N. crassa and Aspergillus niger). About 8,200 genes from S. sclerotiorum and B. cinerea have homologs in other fungi, of which about 3,500 are conserved in all compared fungal genomes (Table S8). Both S. sclerotiorum and B. cinerea harbor fewer multigene families as compared to G. zeae, A. niger or P. nodorum but similar numbers as M. oryzae (Figure S7). Around 10% of the S. sclerotiorum and B. cinerea genes (1,454–1,600) are clade-specific, i.e. they are shared exclusively among the two species and have no orthologs in other fungi (Table S8). Nearly 90% of these clade-specific genes encode proteins without known PFAM domains; the subset of genes with functional domains is enriched in GO terms associated with transcription factors and cytochrome P450s (Table S9). After excluding dubious genes, the number of species-specific (either to S. sclerotiorum or to B. cinerea) genes was comparable to that in other fungal genomes (approximately 2,600). Many of these genes encode small proteins without functional domains. The species-specific genes harboring functional domains are enriched in genes encoding cytochrome P450s, transcription factors, and proteins with domains involved in chromatin remodeling (Table S9).
To more closely examine patterns of gain and loss of larger functional classes in S. sclerotiorum and B. cinerea, we examined PFAM domain content across these ten genomes. Two families of glycosyl hydrolase, GH71 and GH28, were the most enriched in S. sclerotiorum and B. cinerea (Table S10). These genomes are also enriched for domains of several enzymes, including a putative amidoligase enzyme, a GMC oxidoreductase, and a GDP_fucose protein O-fucosyltransferase. The other Leotiomycete included in these comparisons, B. graminis, does not contain similar expansions, and calculating enrichment for all Leotiomycetes identified no additional domains. As B. graminis contains only 5,495 predicted proteins, other less reduced Leotiomycetes may provide better points of comparison when sequenced. Extending the comparison to search for domains enriched in all necrotrophic fungi (including P. nodorum and P. teres) identified only one additional enriched domain, that for the Heterokaryon incompatibility protein. By contrast, conserved genes depleted in S. sclerotiorum and B. cinerea include a larger and more diverse set than the enriched. These include several families addressed further in this paper, the glycosyl hydrolases GH2 and GH43, the subtilase family (which is most prominent in M. oryzae and N. crassa), zinc finger domains associated with transcription factors, and a terpene synthase domain (Table S11).
Genes in primary metabolism
Conserved primary metabolism genes for amino acid synthesis and for mitochondrial function are present in both genomes, few features deviate from other fungi. S. sclerotiorum and B. cinerea contain five genes encoding alternative type II NADH dehydrogenases, while two or three such genes are found in most fungi, and four in N. crassa [33]. Components of the oxidative phosphorylation system are thus present in S. sclerotiorum and B. cinerea in a higher number than in most fungi. These genes may contribute to plasticity, as suggested for N. crassa [34], increasing fungal versatility in modulating energy production and the cellular redox status in response to environmental stimuli. This may be relevant for S. sclerotiorum and B. cinerea in view of their capacity of redox modulation by production of oxalic acid and the induction of ROS during infection (see section: ROS generation and tolerance).
Genes involved in signaling pathways
All types of genes that are involved in signalling pathways in filamentous fungi (G protein-coupled receptors, MAP kinases, heterotrimeric G proteins, cAMP signalling components and Ca2+-related signalling) are found in S. sclerotiorum and B. cinerea (Table S12). Few differences with other fungi were observed. One GPCR gene in S. sclerotiorum (SS1G_07511) and B. cinerea (BofuT4_P129750.1, BC1G_05052) is absent in N. crassa, but present in Aspergillus nidulans (GprC) and M. oryzae (MGG_08803). S. sclerotiorum and B. cinerea each contain two phospholipase C genes [35], while in M. oryzae and N. crassa there are four. S. sclerotiorum and B. cinerea each have two calmodulin genes while in M. oryzae and N. crassa there is only one. Moreover, S. sclerotiorum and B. cinerea contain an additional calmodulin-like gene (SS1G_05131, BofuT4_P159960.1, BC1G_11227), similar to those in plants, but which is not present in other fungal genomes. Another exception that stands out to the high degree of conservation is that of the S. sclerotiorum low MW Tyr phosphatase (SS1G_04959.1), which is highly similar to other LMW phosphatases, however it lacks the conserved C(X)5R(S/T) motif considered to be a cross-kingdom consensus for this class of phosphatases. The B. cinerea homolog (BC1G_14690.1) does contain the consensus motif. Whether this unique S. sclerotiorum phosphatase is functional has yet to be determined.
The group of genes encoding sensor histidine kinases (HKs) shows a high diversity in the number of members and domain structures. In general, filamentous fungi have a larger complement of HKs than yeast (S. cerevisiae has one, Schizosaccharomyces pombe has three). N. crassa has eleven HK-encoding genes while both S. sclerotiorum and B. cinerea possess twenty HK-encoding genes. Similar numbers of HK-encoding genes are found in Cochliobolus heterostrophus (21) and Gibberella moniliformis (16) [36]. Interestingly, group VIII of fungal HKs has been expanded in S. sclerotiorum and B. cinerea; it has only one representative in A. nidulans and M. oryzae, two in N. crassa but three (PHY1–PHY3) in S. sclerotiorum and B. cinerea. Members of this group contain domains common to plant phytochromes and represent putative red/far-red light sensors. Whether PHY1–PHY3 have a role in the life cycle of S. sclerotiorum and B. cinerea remains to be studied.
Even though the components of different signal transduction pathways are conserved among fungi, their activation by an external stimulus, their interconnections with other signalling components and their outputs vary significantly. For instance, the cAMP cascade regulates penetration and pathogenicity in appressoria-forming fungi [37]. In S. sclerotiorum, the cAMP cascade regulates infection cushion development and is essential for pathogenicity [38], while the same pathway plays a minor role in virulence of B. cinerea [39], [40]. Besides the cAMP cascade, MAPK modules, small GTPases and the Ca2+-calmodulin pathway have been studied in B. cinerea to obtain insight in their role in pathogenicity (reviewed by [9]).
Genes involved in programmed cell death in the pathogen
Programmed cell death (PCD), often referred to as apoptosis, is an important cellular process in eukaryotic organisms [41]. PCD in plants is important in conferring resistance to biotrophic plant pathogens during a hypersensitive response [42]. Conversely, the ability of necrotrophic pathogens to induce PCD in plants is crucial for their ability to infect their host [4], [43], [44]. However, the occurrence of PCD in fungal pathogens may also be important for their ability to infect plants, as demonstrated in M. oryzae [45], [46]. We explored the genomes of S. sclerotiorum and B. cinerea for genes involved in the execution or regulation of apoptosis. Both fungi contain homologs of apoptosis-associated genes (Table S13), and the encoded proteins share features with proteins in S. cerevisiae. However, in several cases they also share domains with human orthologs, which are not always present in the yeast counterpart. For example, S. cerevisiae Nma111p is a homolog of the human pro-apoptotic protein Omi/HrtA2, which contains an IAP-binding domain, a single PDZ domain, a trimerization motif and a mitochondrial localization signal. S. cerevisiae Nma111p has none of these features except for two short PDZ domains. The S. sclerotiorum and B. cinerea homologs are highly similar to each other and show greater sequence similarity to the S. cerevisiae than to the human protein. However, alike the human Omi/HtrA2, they have an IAP binding domain and a short, single PDZ domain [47]. This and similar findings are typical of the situation in many filamentous ascomycetes, suggesting that apoptotic networks in filamentous fungi might represent an evolutionary intermediate between budding yeasts and higher eukaryotes.
The phylogeny of apoptotic genes in fungi reveals close relatedness to higher eukaryotes, however some important components of the animal apoptosis network are absent in fungi. In particular there are no homologs of Bcl-2 or death receptors, both crucial apoptosis regulatory proteins in animals. A third important group are the ‘Inhibitor of Apoptosis Proteins’ (IAPs). There are eight IAP members in human, all of which contain 1 to 3 BIR (Baculovirus IAP Repeat) domains that are necessary for their anti-apoptotic activity. A single protein with two BIR domains is found in S. cerevisiae (Bir1p) and homologs of Bir1p are found in most fungi (Figure S8), including S. sclerotiorum and B. cinerea. Cross-kingdom analysis shows that BIR-domain containing proteins are only present in fungi and metazoans (not shown), suggesting that this domain first appeared in their common ancestor. The B. cinerea homolog (BcBir1; BC1G_14521.1) is anti-apoptotic, and its activity requires the two BIR domains [48]. Recent studies indicate that the BcBir1-mediated anti-apoptotic response is important for virulence of B. cinerea [49]. Functional analysis of candidate apoptosis-associated genes in S. sclerotiorum and B. cinerea genomes will elucidate their role in pathogenesis.
B. cinerea is heterogeneous for the presence of mobile intein elements
Inteins (internal proteins) are in-frame protein insertions embedded within other proteins, which are transcribed and translated with their host gene [50]. They are excised from protein precursors in a post-translational autocatalytic event, which forms a de novo peptide bond between the flanking extein (external protein) sequences. In addition to protein splicing domains, most inteins have a homing endonuclease domain (HEG), which facilitates their specific ‘homing’ into intein-less homologs by gene conversion. PRP8 inteins do not frequently occur in fungal genomes, but have been identified in various orders, i.e. Eurotiales, Onygenales, Sordariales, Chytridiales and Mucorales [50]. The genome sequence of B. cinerea strain B05.10 contains an intein element incorporated in the Prp8 gene (BC1G_06754/06755). The BciPRP8 intein element is 2,514 bp in length and encodes the N - and C-terminal splicing domains and the HEG domain. There is no intein in the Prp8 gene of B. cinerea strain T4, and the ‘empty’ Prp8 allele of T4 is identical to ‘empty’ alleles of other B. cinerea isolates. Heterogeneity for the presence or absence of an intein within a species is unique in filamentous fungi and was exploited to show the occurrence of gene conversion (‘homing’) at 100% efficiency, during meiosis in crosses between B. cinerea isolates carrying an intein and isolates with an empty Prp8 allele [51]. S. sclerotiorum (strain 1980 and 14 other strains) does not contain inteins, however analysis of the intein-extein junction region revealed that the ancestral S. sclerotiorum Prp8 gene contained an intein which was lost by precise deletion, leaving a footprint of previous occupation (Bokor et al., in preparation).
Genes involved in development
Genes involved in mating and fruiting body development
Genome sequencing of S. sclerotiorum and B. cinerea offers opportunities to gain insights into novel aspects of fungal mating and multicellular development (Figure 1). In particular, both species produce macroscopic, stipitate apothecia (sexual fruiting bodies), which arise from within the tissues of melanized, sclerotial stroma. This form of fungal sexual development has not previously been subjected to genome analysis. Also, sexual behaviour differs fundamentally between the species. Whereas S. sclerotiorum is homothallic (self fertile) and only occasionally outcrosses [52], B. cinerea is considered a heterothallic (obligate outcrossing) species with two mating types, MAT1-1 and MAT1-2 [53]. Genome analysis might explain the basis of such sexual differences.
Previous investigations of Pezizomycete fungi have established that differences in breeding systems are normally determined by the presence of different arrangements of mating-type (MAT) genes at one or more MAT loci [54]. MAT genes encode transcription factors required for sexual development [54]. Analysis of the present genomes indeed revealed differences in configuration of MAT loci between the two species (Figure 5). S. sclerotiorum has an organization typical of homothallic Pezizomycotina, with a single MAT locus containing both alpha - and high mobility group (HMG)-domain encoding MAT genes (SS1G_04004.1 and SS1G_04006.1). Only one HMG-type gene is present, supporting the hypothesis that the ancestral fungal MAT locus contained a single HMG gene [55], [56]. Meanwhile, the genomes of the two sequenced B. cinerea strains show the typical MAT organization of heterothallic Pezizomycotina, with the presence of dissimilar ‘idiomorphs’ at a single MAT locus [54]. Isolate B05.10 (mating type MAT1-1) contains a MAT1-1 idiomorph including a characteristic MAT1-1-1 alpha-domain gene (Bc1G_15148.1), whereas isolate T4 (mating type MAT1-2) contains a MAT1-2 idiomorph including a characteristic MAT1-2-1 HMG-domain gene (BofuT4_P160320.1).

However, the S. sclerotiorum and B. cinerea MAT loci were also found to have unusual features. First, two novel ORFs not previously reported from other fungi were detected. The first, designated MAT1-1-5 [54], is present in the MAT1-1 idiomorph of B. cinerea B05.10 (Bc1G_15147.1) with a homolog in the S. sclerotiorum MAT locus (SS1G_04003.1), but is absent from the MAT1-2 idiomorph of B. cinerea T4 (Figure 5). The second ORF, named MAT1-2-4, is present in the MAT1-2 idiomorph of B. cinerea T4 (BofuT4_P160330.1) with a homolog in the S. sclerotiorum MAT locus (SS1G_04005.1), but is absent from the MAT1-1 idiomorph of B. cinerea B05.10 (Figure 5). Novel genes have also been reported in MAT loci of other ascomycete fungi [57]–[60]. MAT regions were sequenced from seven additional S. sclerotiorum and two B. cinerea isolates to confirm these results were typical. S. sclerotiorum strain 1980 originates from a population with little evidence of genetic recombination. Sequencing of the MAT region from the additional S. sclerotiorum isolates, drawn from populations showing evidence of recombination, revealed the same MAT genes to be present, although with minor sequence differences (2–4 haplotypes for each gene). MAT region sequences from B. cinerea tester strains SAS56 (MAT1-1) and SAS405 (MAT1-2) [53] were very similar to B05.10 and T4, respectively.
A second unusual feature concerned the B. cinerea MAT loci. Fragments of MAT1-2-1 and MAT1-1-1 genes bordered the idiomorphs of B05.10 (MAT1-1) and T4 (MAT1-2), respectively (Figure 5). Both fragments appear non-functional, lacking start codons and a MAT domain. In typical heterothallic ascomycetes the MAT regions contain either MAT1-1 or MAT1-2 sequence, but not fragments of the MAT gene(s) of the opposite mating type. In some exceptional cases a complementary MAT fragment was present in solely one mating type (e.g. [61], [62]). B. cinerea is unique in having redundant fragments bordering both idiomorphs. This configuration is consistent with B. cinerea having evolved from a homothallic ancestor containing complete MAT1-1-1 and MAT1-2-1 genes at the same locus, with MAT1-1 and MAT1-2 mating types arising from the loss of core HMG and alpha-domain sequences, respectively, leaving only the disabled gene fragments seen in the current MAT loci (Figure 5). Indeed, the configurations of the B. cinerea MAT loci can be explained by the occurrence of two simple inversion and deletion events from a S. sclerotiorum-like homothallic ancestor (Figure 5). Such rearrangements have been observed in other MAT loci [57]. There are reports of the evolution of homothallism from heterothallism in nature based on rearrangements at the MAT locus [63], [64]; the current data provides the first clear evidence for the opposite transition from homothallism to heterothallism.
Finally, B. cinerea is unusual among pezizomycete fungi in that some isolates are capable of ‘dual mating’. Whereas most isolates act in a standard heterothallic fashion, occasionally isolates are detected that can mate with both MAT1-1 and MAT1-2 tester strains [53], [54], [65]. The organization of MAT loci in dual-mater strains of B. cinerea was investigated (Text S2). Four dual-mater isolates exhibited a MAT1-2 like locus, and one contained a MAT1-1 like locus. Neither PCR analysis nor Southern hybridization revealed any sequence homologous to the opposite MAT locus. We conclude that dual mating in B. cinerea is not due to the possession of both MAT1-1 and MAT1-2 sequence in the same genome. Instead this phenomenon arises by changes elsewhere in the genome - it is unknown whether this form of mating-type switching has a monogenic or polygenic basis.
Mating-type, and a series of other ‘sex-related’, genes have been identified as being involved in various stages of mating and fruiting body production in the Pezizomycotina but these genes have been identified primarily from studies concerning development of cleistothecia or perithecia [54], [66] rather than the apothecia seen in the Leotiomycotina. Screening of the genomes of S. sclerotiorum and B. cinerea with genes with known roles in mating and fruiting body development [66], [67] revealed orthologs for every gene tested (Table S14). This indicates that mating processes (e.g. pheromone signalling) and physiological factors governing asexual and sexual development (e.g. oxylipin signalling) are largely conserved within the Pezizomycotina. Given that the Leotiomycetes are a phylogenetic sister group of the Sordariomycetes, availability of genome sequence now makes it possible to compare how genes are spatially and temporally regulated and what novel genes give rise to tissue patterns distinctive of cleistothecia, perithecia and apothecia.
Genes involved in sclerotial development
Genes associated with sclerotial development have been described previously [68], including genes encoding the pH-responsive transcription factor Pac1, Ras, protein phosphatases, the MAP Kinases Smk1 and Bmp1 and adenylate cyclases Sac1 and Bac1. All of these proteins are components of signal transduction pathways and have pleiotropic effects on growth and development. Genes that are associated exclusively with sclerotial development may lend greater insight into the makeup, regulation and evolution of sclerotia. One such protein (Ssp1) was described originally as a sclerotium-specific protein [69] and accumulates to the highest abundance of any soluble protein in sclerotia, comprising nearly 50% of total soluble protein in a mature sclerotium. The ssp1 gene (SS1G_14065.1) was cloned [70] and characterized by deletion mutagenesis [71]. ssp1 transcripts accumulate only in sclerotial tissues making this a valuable gene for studying the regulation of sclerotium-specific gene expression. The search for related genes in other fungi outside the Sclerotiniaceae has revealed ssp1 homologs only in Aspergillus flavus and A. oryzae, distantly-related Eurotiomycetes that share with S. sclerotiorum and B. cinerea, the ability to produce sclerotia. Using Reciprocal Smallest Distance analysis [72], 245 orthologous gene pairs shared by S. sclerotiorum, B. cinerea, A. oryzae and A. flavus but absent from the non-sclerotia-producing A. nidulans and A. fumigatus have been identified (Table S15). This list includes ssp1 and may be enriched in sclerotium-specific genes offering a potential foothold into a broader understanding of sclerotium development and evolution.
Genes involved in conidiation
A developmental feature that distinguishes B. cinerea from S. sclerotiorum is conidiation. Both species produce spermatia (microconidia) from phialides arising singly or in clusters directly from basal hyphae. B. cinerea and other Botrytis species, however, have the ability to produce macroconidia from sterigmata on the swollen tips of aerial, branching conidiophores. Sclerotinia spp. do not produce structures resembling conidiophores or macroconidia. Genes dictating spatial patterning of sporulation might be present in B. cinerea but absent from S. sclerotiorum. Conidiophore pattern and cell-identity regulators in A. nidulans include medusa (medA), stunted (stuA), abacus (abaA) and bristle (brlA). Orthologs of medA, stuA, and abaA are present in B. cinerea and S. sclerotiorum whereas an unambiguous ortholog of brlA is not present in either genome (Table S16), as is also the case in N. crassa [73]. However, genes known to function upstream of brlA including fadA, fluG, flbC, and flbD are all present in both B. cinerea and S. sclerotiorum (Table S16). Neither B. cinerea nor S. sclerotiorum contains an ortholog to the N. crassa fluffy gene (NCU08726.3). Thus, comparative genomics fails to reveal a simple explanation for asexual sporulation in B. cinerea and its absence in S. sclerotiorum. However, there is no evidence that the B. cinerea orthologs of Aspergillus sporulation genes also function in sporulation in B. cinerea. The orthologs in S. sclerotiorum may have evolved to perhaps regulate the microconidiation pathway (shared between S. sclerotiorum and B. cinerea) or to regulate different processes. Functional analyses will be required to determine the role(s) of these genes in S. sclerotiorum and B. cinerea biology.
Genes involved in infection structure development
In addition to structures involved in sexual and asexual development unrelated to pathogenesis, B. cinerea and S. sclerotiorum both produce dedicated infection structures in order to invade plants. Both fungi demonstrate plasticity in the complexity of these structures used to breach the host cuticle. The structures range from simple swellings of germ tube tips and dome-shaped appressoria lacking melanin in their cell walls, to multi-lobed compound appressoria and the more complex infection cushions. Many of the genes that affect appressorium development in M. oryzae and other plant pathogenic fungi are components of the highly conserved MAP kinase and cAMP-dependent signal transduction pathways. Orthologs of all these genes are present in both S. sclerotiorum and B. cinerea, as well as in non-pathogenic fungi (Table S12). The tetraspanin-encoding gene (pls1) that is required for appressorium function in both M. oryzae and B. cinerea [74], is also present in S. sclerotiorum (Table S17). Among appressorium-associated genes (Table S17) are also members of the mas1-related gene family, which play a role in M. oryzae appressorium function [75]. Two members of the mas1 family from S. sclerotiorum were over-represented in EST sequences from an infection cushion cDNA library [76]. mas1/mas2 homologs in B. cinerea are upregulated during germination and appressorium formation, but the genes are not essential for infection [77]. Identifying specific genes that are essential for appressorium development as well as other developmental stages such as sclerotia and apothecia could provide targets for controlling disease spread through lifecycle interference.
Insights into infection strategies shared by S. sclerotiorum and B. cinerea
ROS generation and tolerance
The generation of reactive oxygen species (ROS) has long been associated with defense responses in plant-fungus interactions. The ‘oxidative’ burst is an early and universal plant response following pathogen challenge. Plants resist invading pathogenic fungi, often biotrophs, by induction of the hypersensitive response, a programmed cell death that results from pathogen recognition and is generally associated with the induction of ROS. ROS are detected in the host plant during infection by S. sclerotiorum and B. cinerea, and likely other necrotrophs. Disease development is impeded when pathogen-generated ROS is inhibited [78]. Whereas ROS-mediated plant cell death is detrimental for biotrophic fungal pathogens, generation of ROS seems advantageous for a necrotrophic pathogen. However, this raises questions as to how S. sclerotiorum and B. cinerea thrive in a highly oxidative environment.
We examined the two genomes for genes that are involved in ROS generation and tolerance to oxidative stress. Remarkably, both fungi have gene repertoires for ROS-generating enzymes and antioxidants that are very similar to those in other plant pathogenic fungi or in saprophytic fungi (not shown). Regulation of ROS and redox homeostasis is a versatile means for cells to respond to developmental cues. The importance of the ROS/redox “climate” in fungal growth and differentiation was suggested by Hansberg and Aguirre [79] who proposed that hyperoxidant states are a primary driving force leading to differentiated states in fungi. The importance of antioxidant enzymatic systems for effective cellular homeostasis and appropriate development was recently demonstrated in several fungi. The S. sclerotiorum and B. cinerea genomes each contain two NADPH oxidase encoding genes (Ssnox1, Ssnox2, BcnoxA, BcnoxB). Mutants in either of these genes were unable to develop sclerotia. S. sclerotiorum mutants in the Ssnox1 or Ssnox2 genes differed in virulence: Ssnox1 mutants were weakly pathogenic while Ssnox2 mutants were fully pathogenic (Veluchamy et al., unpublished). The B. cinerea mutants were both impaired in virulence but to different extents: BcnoxB is important for penetration, whereas BcnoxA is involved in lesion expansion. A double mutant is almost avirulent, as is a BcnoxR mutant lacking the regulatory subunit of the Nox complex [80]. Since NADPH oxidases are highly conserved and they are involved in differentiation in various fungi [81], [82], their role in S. sclerotiorum or B. cinerea could primarily be in the differentiation of infection structures.
How can fungi trigger oxidative processes in a plant and at the same time cope with an aggressive oxidative environment? There is little information as to how oxidants and antioxidants are balanced in time and space to provide the specificity required to regulate diverse cellular processes. ROS regulation is complex as there are numerous (enzymatic and non-enzymatic) participants, superimposed in a cellular context that also includes reactive nitrogen species (e.g. nitric oxide; [83]). For example, deletion of the B.cinerea bap1 gene, which encodes a transcription factor that controls enzymes required for oxidative stress responses (catalases, peroxidases, GSA,GRX,TRx) results in high sensitivity to oxidative stress in vitro, but there was no impact on virulence [84]. Antioxidant genes controlled by Bap1 were not induced in early stages of infection, during which the host mounts an oxidative burst. Thus B. cinerea does not sense oxidative stress. There must be alternative protection systems and we suggest this provides an explanation, at least in part, as to why S. sclerotiorum and B. cinerea do not possess a larger suite of such genes.
Biosynthesis of oxalic acid
S. sclerotiorum and B. cinerea are renowned for the ability to acidify their environment through the secretion of organic acids. In particular, the production by S. sclerotiorum of oxalic acid and its association with white mold symptom development has been studied for over a century [85]–[88]. The physiological roles of oxalic acid in pathogenesis are numerous. Oxalic acid enhances the activity of polygalacturonases to promote cell wall degradation [89], inhibits plant–protection enzymes [90], [91], suppresses the plant oxidative burst [92], deregulates stomatal guard cell closure [93], mediates pH signalling [94], induces apoptosis-like cell death [5] and alters the cellular redox-status in the plant [8]. Each of these activities separately may facilitate infection [1], [95]. Oxaloacetate acetyl hydrolase (OAH) activity is associated with oxalic acid accumulation in S. sclerotiorum [96] and B. cinerea [97]. Genes encoding OAH activity have been identified in the S. sclerotiorum and B. cinerea genomes (SS1G_08218.1, BC1G_03473.1, BofuT4_132860.1). Deletion mutants in SS1G_08218.1 and BC1G_03473.1 are deficient in oxalic acid biosynthesis [97, Rollins et al, unpublished]. This observation, however, does not establish whether the primary source of oxaloacetate is the TCA cycle, the glyoxalate cycle or both. The dynamic role of oxalic acid in S. sclerotiorum and B. cinerea physiology is further exemplified by the identification of genes encoding oxalate decarboxylase, which converts oxalate into formate and carbon dioxide. Such activity was previously reported from S. sclerotiorum [98]. The biological functions of oxalic acid rely on a dynamic balance of production and breakdown and not simply on a system of maximal synthesis and accumulation. The acidic environment created by oxalate secretion facilitates the optimal activity of certain sets of cell wall degrading enzymes and peptidases (following two sections).
B. cinerea and S. sclerotiorum genomes are especially suited for pectin decomposition
The ability to degrade complex plant carbohydrates is an important aspect of fungal lifestyle. Plant cell wall carbohydrates form a complex network of different polysaccharides that are subdivided in three categories: cellulose, hemicellulose (including xylan, xyloglucan, glucogalactomannan, galactan, and respective side chains), and pectin (composed of galacturonan, rhamnogalacturonan, and respective side chains). This network is the target of carbohydrate-active enzymes and auxiliary proteins (jointly referred to as CAZymes) needed to access internal plant tissues and to degrade plant cell wall components to simple monomers serving as carbon sources. The genomes of S. sclerotiorum and B. cinerea contain respectively 346 and 367 genes encoding putative CAZymes (Table S18) including at least 118 and 106 CAZymes unambiguously associated with plant cell wall degradation (Tables S19, S20), although many other CAZymes likely contribute to this activity. The CAZyme content in the genomes of S. sclerotiorum and B. cinerea was compared to other ascomycetes (Table S18) including plant pathogens (namely B. graminis, P. nodorum, P. teres f. teres, M. oryzae, G. zeae) and two saprobes (N. crassa, A. niger) to examine whether the lifestyle of these fungi correlates with their CAZyme content and distribution (Table 2 and Table S18). The CAZyme content in S. sclerotiorum and B. cinerea genomes is smaller than in the other plant pathogens analysed except for B. graminis, but equivalent in size to the saprotroph A. niger, renowned for its versatility in degrading plant carbohydrates. The CAZyme content in S. sclerotiorum and B. cinerea is, however, larger than in N. crassa, and in the powdery mildew B. graminis, suggesting that the evolution of these species has led to different degrees of reduction in their carbohydrate degrading capabilities. In B. graminis, the reduction in genes encoding plant cell wall (PCW) degrading enzymes is extreme (Table S19) [10].

Besides the quantitative differences, the CAZymes of S. sclerotiorum and B. cinerea display qualitative differences to those of the other plant pathogens analysed (Table 2, Table S19). S. sclerotiorum and B. cinerea have a noticeably lower number of enzymes putatively involved in degradation of hemicellulose (H, Table 2, Table S19). The pectin degrading capacity is larger for B. cinerea than for S. sclerotiorum (44 vs. 33 putative pectin-specific CAZymes, respectively). Their potential pectin degrading capacity is comparable to that of P. nodorum and M. oryzae, but significantly smaller than in Fusarium oxysporum and Nectria haematococca (73 and 74 pectin-specific CAZymes, respectively; data not shown). By contrast, the number of cellulose and hemicellulose degrading enzymes encoded in S. sclerotiorum and B. cinerea genomes is smaller than in all the other PCW-degrading pathogens. Different PCW-degrading pathogens likely use different approaches to decompose plant tissues. Even if the cellulose degrading capacity is similar between pathogens, their ability to cope with soft tissue components, e.g. hemicellulose and pectin, is likely to vary. Many saprotrophs degrade plant cell wall material in a manner totally different from S. sclerotiorum and B. cinerea. For instance, the CAZyme content in the genomes of N. crassa (Table S19), as well as Hypocrea jecorina and Podospora anserina (not shown) suggests a preference of these fungi for cellulose and hemicellulose rather than for pectin. Interestingly, the pectin-degrading CAZyme content of S. sclerotiorum and B. cinerea genomes shows similarities with that of the saprotroph A. niger. In particular, the cellulolytic, hemicellulolytic and pectin degrading capacities of B. cinerea and A. niger are strikingly similar. These two unrelated fungi are not only similar in the number of enzymes in all pectin-related CAZY categories, but also in the ratio of pectin-degrading lyases versus hydrolases. Such observations suggest a common preference for soft plant tissue (such as flowers or fruit), which is rich in pectin.There are also differences between B. cinerea and A. niger, particularly in the number of cellulose-binding modules (CBMs, Table S20). These categories are larger in S. sclerotiorum and B. cinerea, indicative of a stronger preference for vegetative plant tissues.
Among the unusual features of the S. sclerotiorum and B. cinerea genomes is the presence of a large set of enzymes likely involved in α-1,3-glucan degradation (family GH71). Many of the GH71 catalytic modules are attached to CBM24 modules, with up to four CBM24 modules linked to one GH71 module in a single polypeptide. Whether S. sclerotiorum and B. cinerea use such enzymes for the degradation of their own cell walls, the walls of antagonistic fungi, or for plant polysaccharides is presently unknown. Interestingly, a significant number of CBM18 (chitin-binding) modules is also present in both genomes, although the number of CAZymes involved in degrading chitin in the genomes of S. sclerotiorum and B. cinerea is low. Since several of the CBM18 modules are attached to CE4 chitin deacetylase modules, it is possible that these polypeptides contribute to reducing the release of chitooligosaccharides, which is known to lead to responses by host plants. Similar expansion of the CBM18 family is observed in all pathogenic fungi analysed (Table S20).
S. sclerotiorum and B. cinerea and five other ascomycetes were grown on monosaccharides and on plant-derived polysaccharides to establish correlations with their CAZyme content (Figure S9). Best growth for both S. sclerotiorum and B. cinerea was observed on pectin, while both grew poorly on xylan and cellulose. By contrast, fungi with a high number of genes encoding xylan - or cellulose-degrading enzymes grew better on these substrates while those containing a lower number of genes encoding pectin-degrading enzymes (M. oryzae, N. crassa) grew poorly on pectin. The CAZyme annotation and carbon growth profile suggest a specialization of S. sclerotiorum and B. cinerea towards degrading the pectin fraction of the plant cell wall. Their poor growth on xylan is due to a combination of a reduced xylanolytic system and the inability to use xylose, the main component of xylan, as carbon source. It is likely that the remaining ability to degrade hemicelluloses is not used for the release of nutrients, but rather for decomposition of plant cell walls to enable infection.
Transcriptome analysis identified 43 B. cinerea (11.1%) and 40 S. sclerotiorum (11.2%) CAZyme-encoding genes whose expression was significantly upregulated during colonization of sunflower cotyledons as compared to in vitro grown mycelium, whereas 6 B. cinerea (1.5%) and 10 S. sclerotiorum (2.8%) CAZyme-encoding genes were significantly downregulated (Table S21). While no pair of orthologs was downregulated in the two fungi, 17 pairs of orthologs were significantly upregulated in planta in both B. cinerea and S. sclerotiorum. Sunflower cell walls consist largely of cellulose, glucuronoxylans and pectin and to a lesser extent of mannans and xyloglucans [99]. Among the B. cinerea genes significantly upregulated in planta, 12 encode cellulose degrading enzymes, 3 xylan degrading enzymes, 6 pectin degrading enzymes and 2 mannan degrading enzymes (Table S21). This suggests that rather than focusing on specific components, B. cinerea produces a broad range of enzymes that is able to degrade both major and minor components of the sunflower cell wall. A similar pattern was observed for S. sclerotiorum during infection with upregulation of genes encoding enzymes involved in the degradation of cellulose (6), xylan (8), pectin (11) and mannan (2).
Secreted peptidases
Pathogenic as well as saprotrophic fungi secrete peptidases to degrade a variety of (poly)peptides in their environment. This degradation is potentially beneficial in eliminating the activity of antifungal host proteins and in providing nutrients. The genomes of S. sclerotiorum and B. cinerea were analysed for genes encoding proteins with predicted proteolytic activity, with emphasis on the secreted peptidases (Table 3). S. sclerotiorum and B. cinerea have a variety of peptidases comparable to the Eurotiomycetes and Sordariomycetes. The number and variety of peptidases encoded by the B. graminis genome is strongly reduced. S. sclerotiorum and B. cinerea possess more secreted sedolisins (S53, acidic optimum) than G. zeae and M. oryzae, which in turn have many more subtilisins (S8A, alkaline optimum). Sedolisins and subtilisins belong to the same clan (SB) and share the same ancestral peptidase [100]. S. sclerotiorum and B. cinerea also have two genes encoding glutamic peptidase (G01), an enzyme that is active at pH 2 [101]. Altogether S. sclerotiorum and B. cinerea possess a large number of genes encoding peptidases with an acidic pH optimum and a small number of genes encoding peptidases with a basic pH optimum. These data suggest an adaptation of the peptidase gene content in S. sclerotiorum and B. cinerea, to perform well in a low pH environment generated by the production of oxalic acid (see section: Biosynthesis of oxalic acid). A notable difference between S. sclerotiorum and B. cinerea is that the S. sclerotiorum genome contains only 9 aspartic proteinase (A01A)-encoding genes while B. cinerea has 14 such genes [102], however, the functional consequences of this observation are unknown.

Secreted effector proteins
Secreted effector proteins that are transferred into plant host cells have been recently shown to be essential for pathogenesis in many plant pathogenic microorganisms, for example in the biotrophic powdery mildews [10], smuts [103], and rusts [104] and in the hemibiotroph M. oryzae [105]. In the necrotrophic fungi P. nodorum and Pyrenophora tritici-repentis, host-specific proteinaceous toxins have been demonstrated to serve as effectors that enhance virulence [106], [107]. Up to now, little experimental evidence for the existence of similar effector proteins is available for B. cinerea and S. sclerotiorum. One exception is the recent identification of a xylanase in B. cinerea that acts as a virulence factor, promoting necrosis in the host plant independent of its enzymatic activity [108]. From genes encoding proteins with N-terminal leader peptides (based on SignalP prediction), genes for CAZymes and peptidases were eliminated, resulting in 879 and 603 genes encoding secreted proteins, respectively, in the genomes of B. cinerea and S. sclerotiorum. The larger size of the B. cinerea secretome was also evident for the small secreted proteins: 521 in B. cinerea and 363 in S. sclerotiorum were smaller than 300 amino acids, and 333 in B. cinerea and 193 in S. sclerotiorum were smaller than 150 amino acids. Experimental support (microarray expression data, ESTs and OrthoMCL analysis) was obtained for approximately half of the gene models encoding small secreted proteins (respectively 49–51% for <150aa, and 63–65% for <300aa). Comparative expression analysis during in planta and in vitro growth suggested a role in pathogenesis only for CAZymes, as described above (see section: B. cinerea and S. sclerotiorum genomes are especially suited for pectin decomposition). For the remaining secretome, the number of genes upregulated in planta was not significantly higher than the average of all genes (Table S22). On the contrary, both in S. sclerotiorum and B. cinerea, more genes encoding secreted proteins were downregulated than upregulated in planta.
Differences in infection strategies between S. sclerotiorum and B. cinerea
Comparative infection transcriptomics
At least 69% of predicted genes in S. sclerotiorum and B. cinerea appears to be expressed, as concluded from their representation in at least one of the cDNA libraries tested (Figure S10) or from hybridization signals in custom oligoarrays. Transcripts were found to be differentially expressed in equal proportions in both fungi, when comparing sunflower-inoculated cotyledons (48 hpi) and mycelium grown in vitro: 192 S. sclerotiorum (1.8%) and 253 B. cinerea (1.75%) predicted genes are upregulated in leaves while 173 S. sclerotiorum (1.65%) and 247 B. cinerea (1.7%) genes are downregulated. When considering B. cinerea/S. sclerotiorum orthologs, it appears that 50% of the genes significantly upregulated during sunflower colonization in one species have a similar expression pattern in the other. This proportion was smaller (20%) for the genes that are downregulated during sunflower colonization. The common set of genes that are upregulated in planta suggests that the two species share at least some mechanisms to colonize plant tissues. The lists of upregulated S. sclerotiorum and B. cinerea genes are enriched in CAZyme-encoding genes relative to the whole gene complement (9-fold for both species), with 40–43 genes in each species (approx. 11% of the CAZy genes in each of the genomes) (see section: see section: B. cinerea and S. sclerotiorum genomes are especially suited for pectin decomposition). There is also an enrichment in P-type ATPases, MFS-type sugar transporters and peptidase-encoding genes. Of the genes that are only present in one of the two species, it appears that B. cinerea exhibits a two-fold higher number of in planta upregulated genes than S. sclerotiorum. This suggests that B. cinerea and S. sclerotiorum may have adopted species-specific strategies for infection. In addition to the genes that are differentially expressed between the in vitro and in planta conditions, the expression analysis provided a list of genes that are most highly expressed during infection, including several peptidases and other secreted proteins. Details of experiments, raw values and lists of differentially expressed genes with associated normalized values are available at http://urgi.versailles.inra.fr/Data/Transcriptome.
Secondary metabolism
One of the crucial weapons that necrotrophic, polyphageous pathogens possess is the production of (non-specific) phytotoxic compounds to kill cells of a range of plant species. Two groups of phytotoxic metabolites produced by B. cinerea have been characterized i.e. the sesquiterpene botrydial and related compounds [109] and botcinic acid and its derivatives [110]. To identify the pathways involved in the production of other secondary metabolites in S. sclerotiorum and B. cinerea, we searched the genomes for genes encoding key enzymes such as NRPS (non-ribosomal peptide synthetase), PKS (polyketide synthase), TS (terpene synthase) and DMATS (dimethylallyl tryptophane synthase), which are essential for the biosynthesis of peptides, polyketides, terpenes and alkaloids, respectively [111]. Both genomes contain a significant number of genes encoding key secondary metabolism (SM) enzymes (28 in S. sclerotiorum, 43 in B. cinerea; main classes in Figure 6A, complete list in Table S23). S. sclerotiorum and B. cinerea have the potential to produce approximately 26 and 40 main secondary metabolites, respectively, as some SM pathways have more than one key enzyme. The numbers of key enzyme genes are similar to the average found in ascomycetes (Table 4) and significantly higher than in the Leotiomycete B. graminis, which has undergone massive gene loss probably due to its exclusively biotrophic life-style [10]. Among the ascomycetes, B. cinerea has the highest number of TS from the STC (sesquiterpene cyclase) sub-family, although similar numbers of STC genes were identified in basidiomycetes [112]. Most S. sclerotiorum and B. cinerea key SM genes (90%) belong to clusters of genes that encode other biosynthesis enzymes, regulators and/or transporters. Generally in fungi, all genes from a SM cluster are involved in the same metabolic pathway and are co-regulated [111], [113], [114]. In S. sclerotiorum and B. cinerea, about one third of the clusters contain a gene encoding a Zn(II)2Cys6 transcription factor, that could control the expression of genes within its own cluster. Also, 40% of the SM clusters contain a gene encoding an ABC or MFS transporter that could export the metabolites produced by the enzymes encoded by the gene cluster. SM clusters are randomly distributed in the genome of S. sclerotiorum (Figure S11), and there was no enrichment in the location of clusters in sub-telomeric regions. By contrast, SM gene clusters in Aspergillus spp. and G. zeae are frequently (50%) located in sub-telomeric regions [67], [115].


B. cinerea has a higher number of genes encoding key SM enzymes (43) compared to S. sclerotiorum (28, Figure 6A). This difference is even more striking when considering orthologs and paralogs (Figure 6A, Table S23). Only 19 key SM genes correspond to orthologous pairs in both genomes, while 24 genes are only found in B. cinerea and 9 only in S. sclerotiorum. The 19 shared key SM genes belong to 17 clusters that have a comparable organization between the two genomes (microsynteny), with one exception. B. cinerea genes BcPKS6 and BcPKS9 are jointly responsible for production of the phytotoxin botcinic acid. In B. cinerea these PKS genes are in different genomic locations while their orthologs in S. sclerotiorum are part of the same cluster. This suggests that a major genomic rearrangement, either a fusion or fission, has occurred in one of the species [116]. Among the other clusters shared by the two species (detailed in Text S3) are those that are conserved among ascomycetes and are involved in biosynthesis of melanin (PKS13), coprogen (NRPS6) and intracellular siderophores (NRPS2, NRPS3).
For nearly all key SM genes present in both S. sclerotiorum and B. cinerea, orthologs were found in other fungal genomes. The S. sclerotiorum or B. cinerea key SM genes found in only one of the two genomes, were called “specific”, although most have orthologs in at least one other fungal genome. The 9 S. sclerotiorum “specific” key SM genes encode PKS (6 genes) and PKS-NRPS hybrids (2 genes). S. sclerotiorum also has one specific TS corresponding to a non-classical DTC (diterpene cyclase) with an additional GGPP synthase domain (Table S23). This bifunctional terpene synthase is orthologous to the fusicoccin synthase (FUS) from Phomopsis amygdali [117] although the cluster is only partially conserved with P. amygdali suggesting that S. sclerotiorum might produce a metabolite different from fusicoccin. The 24 B. cinerea “specific” key SM genes encode TS (10 genes), PKS (7 genes), NRPS (3 genes) and PKS-NRPS hybrids (4 genes). Remarkably, S. sclerotiorum does not contain STC genes, while B. cinerea has 6, including the STC1 (also named BcBOT2) gene which is part of the cluster required for synthesis of the phytotoxin botrydial [118]. B. cinerea also contains a TS encoding gene (PAX1) orthologous to the Penicillium paxilli PaxC gene, involved in biosynthesis of the indole-diterpene paxillin [119] (Table S23).
The genomic regions located upstream and downstream of the B. cinerea-specific SM clusters were detected in the S. sclerotiorum genome. Genes from the surrounding regions have the same physical organization in both species, demonstrating that these regions were syntenic, except for the presence or absence of a given SM cluster. As discussed above, loss of synteny between both genomes is frequently associated with the occurrence of TE-rich regions in the S. sclerotiorum genome. In several cases, the loss of synteny at a locus with a species-specific SM cluster indeed appears to be associated with the presence of TEs in one of the genomes. For example, the B. cinerea-specific DTC3 gene cluster corresponds to a locus in the S. sclerotiorum genome where a reverse transcriptase is detected, as well as a relic of the DTC3 ortholog. This observation suggests that a deletion in S. sclerotiorum has removed most of the original DTC3 cluster. The striking difference in the content of SM clusters between S. sclerotiorum and B. cinerea might reflect a recent gain of clusters in B. cinerea, or the loss of clusters in S. sclerotiorum. As most of the SM key enzyme genes found in B. cinerea have orthologs in other fungi, the most probable hypothesis is that the SM clusters were present in the common ancestor of the Sclerotiniaceae and that many of them were lost in S. sclerotiorum as exemplified for the DTC3 gene cluster.
Overall, 42 and 65% of B. cinerea and S. sclerotiorum SM clusters, respectively, are orthologous. Most of the shared clusters are conserved among ascomycetes and involved in elementary cellular processes including cell protection (melanin) and iron scavenging (siderophores). On the other hand, the capacity for producing SMs considerably differs between these two related species, despite their similar behaviour as plant pathogens. More than half of the B. cinerea SMs cannot be produced by S. sclerotiorum. Two of the B. cinerea-specific SM clusters are involved in production of the phytotoxin botrydial [118] and the phytohormone abscisic acid [120]. In addition, B. cinerea-specific SM genes are highly expressed during sunflower cotyledon colonization (see 6.1) which suggests they may be involved in the production of metabolites important for infection.
Transporters
Plant pathogens must protect themselves, especially during infection where they are likely to encounter host defense mechanisms. Membrane transporters play a role in counteracting the physiological impact of antimicrobial host defense compounds. For example, the B. cinerea ABC transporter AtrB has been shown to be required for tolerance to the Arabidopsis phytoalexin camalexin [121]. Mutations leading to overexpression of AtrB and a MFS-type drug efflux transporter are responsible for the appearance of B. cinerea field strains with increased tolerance to unrelated fungicides (multidrug resistance) in French and German vineyards [122]. The genomes of S. sclerotiorum and B. cinerea were analysed for genes encoding nutrient transporters, mitochondrial carriers, aquaporins and efflux pumps. ABC-transporters utilizing ATP hydrolysis to provide energy for transport [123] have a conserved architecture of one nucleotide binding fold (NBF) and six transmembrane-spanning helices (TMD) in different arrangements (Table 5). The major facilitator superfamily (MFS) proteins use proton-motive force for substrate translocation. The differential regulation of 17 MFS-type hexose transporter genes during colonization of sunflower cotyledons provided support for their involvement in sugar uptake during pathogenesis [124]. Analyses of fungal genomes for the content of membrane transporter-encoding genes did not reveal major differences between saprotrophs and pathogens [125], [126]. Comparison of the numbers of transporter genes in the genome of S. sclerotiorum with the two B. cinerea strains revealed a bias towards larger sizes of certain families in B. cinerea (Table 5; Figure 6B). While 42 and 40 ABC transporter genes were identified in B. cinerea B05.10 and T4, respectively, only 33 were identified in S. sclerotiorum. Similarly, B. cinerea contains 30% more MFS transporter genes (282–286) as compared to S. sclerotiorum (218). Differences in gene numbers were less evident or not observed for P-type ATPases, amino acid transporters, mitochondrial carriers and aquaporins (Figure 6B). The majority of B. cinerea genes that were absent in S. sclerotiorum did not have orthologs in other fungi, indicating that gene expansion in B. cinerea rather than gene loss in S. sclerotiorum has likely been the driving force for the observed differences. Approximately half of the transporter genes were highly expressed both in mycelium and during infection (Table S24). Members of the MFS transporter gene families showed higher expression levels during growth in planta as compared to growth in vitro. By contrast, the majority of MDR-related MFS transporters were repressed during infection. Several P-type ATPases were upregulated in planta in B. cinerea but not in S. sclerotiorum.

Transcription factors
Transcription factors (TFs) are essential players in regulatory networks. Thirty-seven TF families have been identified in fungi (http://supfam.org/SUPERFAMILY) among which six are specific to the fungal kingdom [127]. Despite the close phylogenetic relatedness between S. sclerotiorum and B. cinerea, there are striking differences in the number of TFs between both species. 330 TF-encoding genes were identified in S. sclerotiorum, and 392–410 in B. cinerea (Table S25). The difference between the two fungi also extends to the distribution among families, i.e. a large number of TFs are from the Zn(II)2Cys6 binuclear cluster family (S. sclerotiorum 155 and B. cinerea 222, Figure 6C) and the Zn(II)-coordinating C2H2 (S. sclerotiorum 98 and B. cinerea 116). The total number of TFs shared (i.e. encoded by orthologous genes) between S. sclerotiorum and B. cinerea is 323. Among them, 54 (17%) have no ortholog in other sequenced fungal genomes (Figure 6C). Additionally, B. cinerea has 96 TFs that are absent in S. sclerotiorum, while only 12 S. sclerotiorum TFs are absent in B. cinerea. These three categories of TFs mostly (86%) belong to Zn(II)2Cys6 binuclear cluster and C2H2 zinc finger families. Indeed, S. sclerotiorum and B. cinerea share 153 Zn(II)2Cys6 binuclear cluster TFs (Figure 6C), while an additional set of 69 of these TFs are found only in B. cinerea. For the C2H2 zinc finger family, S. sclerotiorum and B. cinerea share 93 TFs, while an additional set of 23 C2H2 TFs are found only in B. cinerea. Among the 69 B. cinerea-specificZn(II)2Cys6 binuclear cluster TFs lacking in S. sclerotiorum, 9 are located in secondary metabolism gene clusters that are not present in S. sclerotiorum.
Overall, among the B. cinerea TFs that have no counterpart in S. sclerotiorum, 57 out of 96 (60%) are encoded by genes that have orthologs in other fungal genomes, while 39 are B. cinerea-specific. This distribution suggests that 57 TFs conserved among fungi have been lost in S. sclerotiorum. The cellular processes controlled by these TFs are possibly altered in S. sclerotiorum. It would be of interest to characterise the regulatory networks that, in other fungi, are controlled by these conserved TFs. Such studies might provide clues about the cellular deficiencies occurring in S. sclerotiorum (e.g. the inability of asexual sporulation). Additionally, the function of the 39 B. cinerea–specific TFs remains to be investigated.
Conclusions
Comparative genomics of S. sclerotiorum and B. cinerea has revealed an expected high degree of sequence identity and synteny, however, we observed several striking differences in gene content between these plant pathogens. The first difference was in the content of transposable elements. The data suggest a recent burst of transposition in the S. sclerotiorum genome relative to B. cinerea. The two species differ in the regulation of sexual reproduction and this is fully explained from the sequence and organization of the MAT loci. Features of these loci provide evidence for an evolution of heterothallism from homothallism. The failure of S. sclerotiorum to produce conidiospores could not be explained from the gene content, as all key conidiation genes seemed to be present and potentially functional. The genome sequences further revealed a striking difference in the amount and types of potential secondary metabolites. The botrydial toxin biosynthetic cluster and the phytohormone abscisic acid biosynthetic genes were unique to B. cinerea. The precise chemical nature and biological function of most of these metabolites remains to be determined to understand whether they contribute to the adaptation of the two species to different ecological niches. The content of CAZyme-encoding genes revealed a preference of S. sclerotiorum and B. cinerea for pectin as nutrient source. This is in agreement with the observation that S. sclerotiorum and B. cinerea are pathogens of dicots and preferentially grow on aerial plant tissues that are rich in pectin. With respect to pathogenicity determinants, there are no unique features that could be identified as ‘silver bullets’, which distinguish these aggressive pathogens from other pathogenic and non-pathogenic fungi. Comparison with two other necrotrophic fungi revealed only few (if any) genes shared among necrotrophs and absent in fungi with other trophic lifestyles (i.e saprotrophs or hemi-biotrophs). These findings point to the multigenic, variable, and sophisticated nature of necrotrophic pathogenicity whose nuance may only be revealed through systematic functional analysis of candidate activities and regulators. We suggest that the specific regulation of networks of the available suite of genes is key to pathogenic success for S. sclerotiorum and B. cinerea.
Materials and Methods
Materials and methods for phylogenetic analysis
Isolate sampling
The isolates included in the sample were 9 species in the genus Botryotinia (including the genome strains B05.10 and T4), 4 species in the genus Sclerotinia (including the sequenced strain 1980), 4 members of the Sclerotiniaceae (Monilinia fructicola, Myriosclerotinia scirpicola, Sclerotium cepivorum and Dumontinia tuberosa), 3 members of the Rutstroemiaceae (Lambertella langei, Lambertella subrenispora and Sclerotinia homoeocarpa) with the powdery mildew Blumeria graminis as the presumed outgroup. Details of the isolates are provided in Table S26.
Fungal cultures and DNA extraction
All isolates were grown on potato dextrose agar (Difco Laboratories, Detroit, MI) for 3–5 days, and were then transferred to standing culture potato dextrose broth (Difco Laboratories) for 1–2 days. On both solid and liquid media, cultures were grown in the dark at ambient room temperature (20–22°C). Cultures were filtered through Miracloth (Calbiochem, EMD Chemicals Inc., Darmstadt, Germany) and lyophilized. DNA was extracted from 10–15 mg of lyophilized mycelium using a DNeasy Plant Mini Kit (Qiagen, Mississauga, ON). Quantity of DNA was estimated on 1.0% ethidium bromide-stained agarose gels, with known quantities of bacteriophage lambda DNA as standards against which comparisons of band intensity could be made. DNA extractions were diluted to 10–20 ng/µL in elution buffer (10 mM Tris-Cl, 0.5 mM EDTA; pH 9.0) for use in PCR.
PCR and sequencing
An approximately 500 bp segment of the internal transcribed spacer (ITS) region, and portions of genes encoding actin (ACT), calmodulin (CAL), glyceraldehyde-3-phosphate dehydrogenase (G3PDH), and heat shock protein 60 (HSP60) were amplified using the primer sets listed in Table S27. Polymerase chain reactions were performed using GoTaq Colourless Master mix (Promega Corporation, Madison, WI) containing: GoTaqDNA Polymerase in 1× Colorless GoTaqReaction Buffer (pH 8.5), 200 µM dNTPs, and 1.5 mM MgCl2; 0.2 µM of each primer; 10–20 ng of DNA template in the total volume of 50 µL per reaction. PCR was performed under the following conditions in a GeneAmp PCR System 9700 programmable thermal cycler (Applied Biosystems, Foster City, CA): denaturing at 95°C for 2 min followed by 35 cycles of 30 s denaturing at 95°C, 30 s annealing at corresponding temperatures for each primer set (Table S27), and 1 min elongation at 72°C, followed by a final extension step at 72°C for 5 min. PCR fragments were visualized by electrophoresis on a 1.0% ethidium-bromide stained agarose gel, using a 100 bp ladder (BioShop Canada Inc., Burlington, ON) to estimate the size of the fragments. All PCR products were purified and sequenced using 3730×l DNA Analyzer systems (Applied Biosystems, Foster City, CA) at the McGill University and Genome Quebec Innovation Centre.
Phylogenetic analyses
Sequences were aligned in Clustal X v. 1.81 [128] and further edited manually. Maximum parsimony (MP) and maximum likelihood (ML) analyses were performed in PAUP* 4.0b10 [129] with heuristic searches. Characters were treated as unordered and gaps as missing data. Bootstrap support for internal branches was estimated from 1000 pseudoreplicates for both MP and ML analyses. Models of sequence evolution were estimated for each locus with ModelTest 3.7 [130], [131], and the phylogenetic parameters are shown in Table S28.
Bayesian analyses were performed for each genetic locus in Mr. Bayes v.3.0b4 [132] to estimate the posterior probabilities of tree topology with Metropolis-coupled Markov chain Monte Carlo (MCMCMC) searches. All analyses employed one cold chain and three incrementally heated chains, where the heat of the ith chain is b = 1/[1+(I−1)T] and t = 0.2; when I = 1, B = 1, corresponding to the cold chain. Independent analyses of each of the four loci were conducted with 2,000,000 generations each, with a sampling frequency of 1 tree every 100 generations. The average standard deviation of split frequencies stabilized (to a difference of less than one percent) after 10,000 generations in all our analyses. Therefore the initial 10,000 generations from each run were discarded as burn-in when summarizing tree parameters and topology. Flat Dirichlet probability densities were used as priors for the substitution rate parameters and stationary nucleotide frequencies and uniform priors were used for the shape and topology parameters and an exponential unconstrained prior was used for the branchlengths parameter.
Analyses of the combined (concatenated) dataset were performed using ML and Bayesian inference. A partitioned dataset with each partition corresponding to each genetic locus with a unique evolutionary model for each partition (Table S28) was used for the Bayesian analysis. The heuristic ML approach employed a combined data set with the following single, overall model of evolution re-estimated from ModelTest 3.7: a general time reversible model with gamma distribution with invariant sites (base frequencies = [0.2580, 0.2512, 0.2277, 0.2631]; rate matrix = [1.3214, 4.0315, 1.3851, 0.8728, 7.8478]; shape parameter for gamma distribution = 0.9427; proportion of invariant sites = 0.3866).
The resultant tree topology is shown in Figure 2, with bolded branches indicating well-supported nodes (ML bootstrap values >90% and Bayesian posterior probabilities >0.95; Table S29). The concatenated tree was rooted with members of the Rutstroemiaceae, previously shown to be an outgroup to the Sclerotiniaceae [13], [14], [132].
Sequencing, assembly, and physical mapping
The sequenced strain of S. sclerotiorum ‘1980’ is available from the Fungal Genetics Stock Center (http://www.fgsc.net/). Plasmid (4-kb and 10-kb inserts) and Fosmid (40-kb inserts) libraries were generated with randomly sheared and size-selected DNA. Plasmid and Fosmid inserts were sequenced from both ends to generate paired reads. Sequence reads (total of 507,621) were filtered for quality, vector and other contamination, and the resulting 476,001 reads were assembled with the Arachne assembler [20]. A consensus sequence was determined from an average of approximately 9.1-fold sequence depth (7.8 depth in Q20 bases). The assembly (GenBank accession AAGT01000000) totals 38.3 Mb and consists of 36 scaffolds with an N50 of 1.6 Mb. The scaffolds consist of 679 sequence contigs with a N50 of 123 kb; at least half of all bases in the assembly fall within at least the size of the N50 scaffold or contig. The contigs total 38.0 Mb, so only 0.8% of the assembly is represented by contig gaps. This assembly contains 98.7% of bases with Q40 quality or greater.
The sequence of B. cinerea strain B05.10 was generated by Syngenta AG using four size selected shotgun libraries. Sequence reads were filtered for quality, vector and other contamination, and the resulting 291,603 reads were assembled using the Arachne assembler. A consensus sequence was generated from an average of approximately 4.5 fold sequence depth (3.9-fold depth in Q20 bases). The assembly (GenBank accession AAID00000000) totals 42.3 Mb and consists of 4,534 contigs with a N50 of 16.4 kb, which are ordered and oriented by paired end clone reads within 588 scaffolds, with a N50 of 257 kb.
The sequence of B. cinerea strain T4 (Genbank accessions FQ790245 to FQ790362) was determined and assembled by Genoscope, Evry, France. The genome was sequenced using a whole genome shotgun (WGS) strategy, by generating plasmid (3 kb and 10 kb inserts) and BAC (∼50 kb inserts) libraries. Clones from these libraries were end-sequenced to generate paired reads. Sequence reads from plasmid inserts (573,705, representing 10.5× coverage) were assembled with Arachne [20], resulting in 3,054 contigs. Contigs were ordered and oriented into scaffolds using paired sequences from BACs (35,668 reads). The gap lengths were estimated using linked clones. 118 scaffolds larger than 20 kb with gap sizes lower than 10%, were used for annotation. These 118 scaffolds (39.5 Mb, N50 of 562 kb, Table 1) contain 2,281 contigs (37.9 Mb, N50 of 35 kb). This assembly contains 98.7% of bases with Q40 quality or greater.
An optical map, a type of physical map, was created for S. sclerotiorum strain 1980 by OpGen. The restriction enzyme BsiWI was used to create ordered fragments and the resulting map contained 16 optical contigs. These likely correspond to complete chromosomes, in agreement with an estimated chromosome number of 16 using pulsed-field gel electrophoresis [21]. The assembly was compared to the optical map using an in silico digest of the assembly (http://www.broadinstitute.org/annotation/genome/sclerotinia_sclerotiorum/MultiHome.html). This comparison suggested that supercontig 4 contained an unsupported join in the assembly, between contigs 132 and 133; the assembly was updated to break scaffold 4 between these contigs, and a revised version of the assembly was submitted to Genbank. No other major disagreements were found. A total map size of approximately 38.5 Mb was estimated by calculating the ratio between the assembly fragments and map units. The assembly supercontigs cover 99.4% of the optical map (contigs cover 98.6%) (Figure S1). Only two supercontigs, 35 and 36, were not anchored to the optical map; these supercontigs are 39 kb and 16 kb respectively, and do not contain any BsiWI restriction site. Supercontig 35 consists of arrayed ribosomal DNA repeats. The optical contigs appear to correspond to complete chromosomes, as they end with a flush set of DNA molecules (data not shown). Additionally, reads containing telomeric repeat arrays of (TTAGGG) are linked to the ends of 26 of the 32 chromosome ends, and are present at the end of two additional scaffolds (Figure S1). At least two scaffolds are mapped to each optical contig, suggesting that centromeres could lie in these unassembled gaps.
Genetic linkage map of B. cinerea
68 individual progeny from a cross between strains T4 (isolated from tomato) and 32 (isolated from Vitis vinifera) were kindly provided by Caroline Kunz (Université Pierre et Marie Curie, Paris). Around 400 microsatellite markers were designed from the genomic sequences of the B05.10 and T4 strains by using the “GRAMENE” software [133]. In addition, a set of 144 SNP (Single Nucleotide Polymorphism) markers were identified through the comparison of the B05.10 and T4 genome sequences and genotyped in the progeny using the SNPlex genotyping assay (Applied Biosystems). The segregation of markers among the progeny was analysed using MAPMAKER software [134] set at min LOD3 and max Distance at 37.
Gene prediction
For S. sclerotiorum and B. cinerea B05.10, gene structures were predicted using a combination of FGENESH and GENEID. The version of GENEID used for these calls was 1.2a. FGENESH is unversioned. As FGENESH uses a statistical model of gene structure that requires training on each organism for accurate prediction, Softberry trained FGENESH on S. sclerotiorum sequences. GENEID is an ab initio gene caller and was run with the default parameters after being trained on a set of 542 S. sclerotiorum genes that were manually curated based on EST and protein alignments.These S. sclerotiorum trained gene models were also used for B. cinerea B05.10 without additional training.
The results from these two gene callers were combined in the following manner. Both FGENESH and GENEID were run on the entire genomic sequences of S. sclerotiorum and B. cinerea (B05.10) to provide an initial set of predicted genes. This resulted in a set containing 12,961 FGENESH predictions and 14,711 GENEID predictions for S. sclerotiorum, and 13,864 FGENESH predictions and 16,907 GENEID predictions for B. cinerea. Next, gene predictions less than 30aa (90 nt) were removed, and any gene prediction less than 50aa (150 nt) was removed, unless it was overlapped by a prediction from a different program, BLAST evidence, a HMMER PFAM domain, or an EST alignment. Applying these criteria removed 2,166 S. sclerotiorum and 2,373 B. cinerea genes from consideration. We manually annotated 1,141 S. sclerotiorum and 751 B. cinerea genes. FGENESH and GENEID predictions were clustered based on overlapping exons, requiring strand consistency. For each locus, a gene structure was chosen based on BLAST similarity to other proteins (requiring ≥60% average identity and ≥80% query coverage), and selecting the gene prediction from the program with best overall agreement to EST splice sites (GENEID performed better than FGENESH by this metric). The initial gene sets contained 14,522 genes for S. sclerotiorum and 16,448 genes for B. cinerea.
The accuracy of the gene set was evaluated by comparing to EST sequences. For S. sclerotiorum, a set of 75,468 ESTs that were sequenced as part of this project or available in Genbank, were aligned to the genome using BLAT. EST alignments were clustered by combining all overlapping ESTs. Each of the resulting 7,400 EST clusters was compared to any overlapping predicted genes. In cases where multiple overlapping ESTs suggest different gene structures, the EST that most closely matched the gene structure was used. Roughly one-third of genes (5,192) have some overlap with an EST cluster; of these, 75% show no splice site disagreements. A small number of predicted genes appear partial in S. sclerotiorum: 4 are missing a start codon, 6 are missing a stop codon, and 98 span contigs. Possible missed annotations include ESTs with no overlapping gene; a total of 559 clusters are at least 200 bases from an annotated gene, and of these 88 contain canonical splice signals. After the automated annotation was complete, ESTs from additional libraries were generated and aligned to the genome. In total, we sequenced ESTs from 8 libraries, generating 96,700 quality filtered sequences (Table S30). These ESTs align to 7,942 genes.
For B. cinerea (B05.10), a set of 9,207 ESTs were aligned to the genome using BLAT. EST alignments were clustered by combining all overlapping ESTs into a cluster. Each of the resulting 2,349 EST clusters was compared to overlapping predicted genes. In cases where multiple overlapping ESTs suggest different gene structures, the EST that most closely matched the gene structure was used. Roughly one-eighth of genes (2,012) have some overlap with an EST cluster; of these, 82% show no splice site disagreements. A small number of predicted genes appear partial in B. cinerea (B05.10): 67 are missing a start codon, 153 are missing a stop codon, and 444 span contigs. Possible missed annotations include ESTs with no overlapping gene; a total of 132 clusters are at least 200 bases from an annotated gene, and of these only 4 contain canonical splice signals.
S. sclerotiorum and B. cinerea (B05.10) gene calls were further evaluated to remove transposable elements and other dubious calls. Genes with at least 100 bases of overlap with repeats called by RepeatMasker or BLAST similarity against a transposon-related protein database, or containing a PFAM repeat domain but not a PFAM non-repeat domain, were flagged as dubious gene calls. Also, genes that have 5 or more BLAST hits at ≥95% identity to the same genome and have no supporting ESTs, BLAST hits or non-repeat PFAM domains, were flagged as dubious. To identify poorly supported gene calls, two additional gene predictors, GeneMark and SNAP, were run on both genomes. Genes less than 100 amino acids that were only supported by a single gene predictor (comparing GENEID, FGENESH, GeneMark, and SNAP) and without EST, BLAST, or PFAM domain support were flagged as dubious genes. Additionally, genes with two predictions that do not share the same reading frame were flagged. In total, all these methods flagged 2,662 S. sclerotiorum genes and 2,784 B. cinerea (B05.10) genes as dubious. All predicted genes were used to query the PFAM set of hidden Markov models using HMMER (http://hmmer.janelia.org) and the public protein databases using BLASTP. Transfer RNAs were identified using the tRNAScan-SE program.
For B. cinerea T4, the automated gene prediction was performed using the URGI genomic annotation platform including pipelines, databases and interfaces, developed for fungi (http://urgi.versailles.inra.fr/). Gene prediction was performed using Eugene pipeline version 3 [135]. The gene models predicted by EuGene rely on a combination of several in silico evidences (ab initio and similarity). Ab initio gene prediction softwares are Eugene_IMM [136] (probabilistic models discriminating coding from non coding sequences), SpliceMachine [137] (prediction of CDS start sites and intron splicing sites) and FGENESH (http://linux1.softberry.com/berry.phtml) (ab initio gene predictor). Several similarity methods were used to identify genes such as BLASTN and Sim4 against B. cinerea ESTs, as well as BLASTX against Uniprot and fungal protein databases. The different results were used by Eugene to predict final gene models. The three ab initio gene prediction softwares were trained using a set of manually annotated genes from B. cinerea. FGENESH was trained by Softberry (Boston, USA), while EuGene-IMM and SpliceMachine were trained at URGI using a set of 305 genomic/full-coding cDNA pairs. One third of the set was used for training ab initio softwares, one third to optimize the parameters of EuGene and the last third to calculate the accuracy of EuGene. We finally obtained for exons and genes, a sensitivity of 97.8 and 92.1 and a specificity of 97.5 and 92.1, respectively. Genes with a size smaller than 100 nucleotides were automatically filtered out by EuGene. EuGene finally predicted 16360 genes in the B. cinerea T4 genome. In addition, 434 tRNA genes were predicted by tRNAscan-SE [138].
Genome alignment and synteny
Genome assemblies were aligned using MUMmer [139]. The B. cinerea genomes were aligned with nucmer, selecting only 1∶1 matches (−mum), and alignments were processed with delta-filter to select 1∶1 local mapping of the reference to query. A total of 35.5 Mb of each could be aligned, or 94% of the B. cinerea T4 genome and 91% of the B. cinerea B05.10 genome. A total of 98,744 insertion/deletion positions and 175,009 SNPs were identified from the nucmer alignments using the show-snps program. This suggests that the overall rate of difference between the two genomes in aligned regions is 1 SNP every 203 bases and 1 insertion/deletion every 360 bases. S. sclerotiorum and B. cinerea are too distant to align well at the nucleotide level globally; only a total of 7.4 Mb can be aligned at 85.0% identity. Therefore the B. cinerea genomes were aligned to S. sclerotiorum using promer, selecting only 1∶1 matches (−mum), and alignments were processed with delta-filter to select 1∶1 local mapping of the reference to query. The promer alignments cover 17.4 Mb sharing 74.3% identity for S. sclerotiorum-B. cinerea T4 and 17.2 Mb sharing 74.6% identity for S. sclerotiorum-B. cinerea B05.10.
To identify larger syntenic regions between genomes, we first identified orthologs using BLASTP as well as OrthoMCL. Using BLASTP (1e-5, softmasked), S. sclerotiorum shares 8,609 best bi-directional (bbd) BLAST hits with B. cinerea B05.10 or 8,601 with B. cinerea T4; 8,088 S. sclerotiorum proteins have matches in both genomes. About 1,300 additional proteins in S. sclerotiorum have BLAST matches that are not best bidirectional. Using OrthoMCL to cluster the three genomes, which uses BLASTP similarity for clustering, there are a total of 12,095 protein families, of which 8,079 are in all three genomes and nearly all of these (7,677) are single copy. Either raw BLAST data or ortholog sets were then used to find syntenic regions of at least four genes between genomes using DAGchainer [27], and parsed using accessory perl scripts. Syntenic regions between the two B. cinerea genomes include 11,422 paired genes and cover 36.9 Mb in 249 regions (average size 148 kb). Syntenic regions between S. sclerotiorum and B. cinerea T4 include 7,752 paired genes and cover 27.7 Mb in 571 regions (average size 49 kb). Syntenic regions between S. sclerotiorum and B. cinerea B05.10 include 7,702 paired genes and cover 27.9 Mb in 602 regions (average size 46 kb). Segmental duplication blocks were identified by comparing each genome against itself, using DAGchainer [27].
Transposable elements detection and annotation
Transposable Elements (TEs) were detected and annotated using the REPET pipeline [30], [31] http://urgi.versailles.inra.fr/Tools/REPET) for detection (TEdenovo) and annotation (TEannot) of transposons in eukaryotic genomes. The TEdenovo pipeline detects TE copies, groups them into families and defines the consensus sequence for each family containing at least 3 copies. The TEannot pipeline annotates TEs using the consensus sequences library. Manual annotation of the consensus sequences allowed their grouping in TE super-families corresponding to a transposon with a defined full-length copy (with both LTRs or ITRs and full ORFs when available) and classified as classI or classII TE. In addition, the genome of B. cinerea T4 was searched using TBLASTN for sequences similar to either the transposase of B. cinerea mariner element Flipper [140] or the reverse transcriptase from Boty1 [141]. Sequences with similarities to TE-encoded proteins were grouped and aligned to identify or reconstruct the corresponding full-length TE. Manually identified TEs were compared to the consensus sequences obtained from REPET.
Functional annotation of predicted genes
Automated functional annotation of S. sclerotiorum and B. cinerea proteins was performed using protein sequences deduced from all gene models automatically predicted. The pipeline uses protein domain identifier InterProScan [142] which runs a set of methods including pattern matching and motif recognition. In addition, we used an automated assignment against protein domains databases such as CDD [143], KEG [144] and KOG [145]. Sub-cellular targeting signals as well as transmembrane domains were predicted using SignalP, TargetP and TMHMM [146]. Orthologs in S. sclerotiorum were determined based on best bi-directional BLAST hits. Overall, 72% of B. cinerea T4 predicted genes (11767 of 16360) encode proteins having either functional information and/or an ortholog in S. sclerotiorum. This percentage increases to 82% taking into account only reliable genes.
Analysis of support for the predicted genes from the three genomes
Four types of evidence were used to support gene calls, based on bioinformatics or experimental criteria (Figure S3). The first criterium was based on identification of functional domains (e.g. InterProScan, CDD) or topology/targeting domains (e.g. SignalP, TargetP, TMHMM) (see M7). Genes with at least one positive hit (functional or topology/targeting domain) were considered as supported by protein domain evidence. The second criterium was based on identification of orthology to genes in other fungi using OrthoMCL (see M9). The third criterium relied on expression data using ESTs (existence of at least one EST for a gene) (see M10). The fourth criterium relied on expression data using hybridization signals on a whole-genome oligonucleotide Nimblegen microarray (see M11). Among the 16,360 predicted genes in B. cinerea T4, 13,555 (83%) genes are supported by at least 1 type of evidence and 6,462 (39.5%) genes are supported by all 4 types of evidence. Among the 16,448 predicted genes in B. cinerea B05.10, 13,922 (85%) genes are supported by at least 1 type of evidence and 6,319 (38.5%) genes are supported by all 4 types of evidence. Among the 14,522 predicted genes in S. sclerotiorum, 12,283 (85%) genes are supported by at least 1 type of evidence and 4,121 (28%) genes are supported by all 4 types of evidence.
Conservation of S. sclerotiorum and B. cinerea predicted genes relative to other ascomycetes
Orthologs between S. sclerotiorum, B. cinerea, and other ascomycete fungi were identified using OrthoMCL version 1.4 [147]. The Ascomycete genomes included in the analysis were B. graminis (22_02_11; blugen.org), P. nodorum (20110506 from Richard Oliver; Broad Institute), P. teres f. teres (PRJNA50389; Genbank), G. zeae (FG3; Broad Institute), M. oryzae (MG8; Broad Institute), N. crassa (NC10; Broad Institute), and A. niger (AspGD). Each set of proteins was blasted against itself and other proteomes with an e value of 1e-5. An inflation parameter of 1.5 was used for Markov Clustering with MCL. 12,120 B. cinerea (T4) proteins, 12,260 B. cinerea (B05.10) proteins, and 9,930 S. sclerotiorum proteins were identified as members of gene families; of these about 1,500 were conserved only in the two species (Table S8). OrthoMCL families enriched in S. sclerotiorum and B. cinerea were identified based on a hypergeometric distribution (p-value computed by phyper function in R; q-value computed by p.adjust in R), however significantly enriched families (q-value<0.05) included only repetitive elements or families specific to only these species. To identify functions specific to these lineage specific proteins, we mapped GO terms to the protein sets of S. sclerotiorum and B. cinerea (B05.10) using Blast2GO, and computed enrichment using Fisher's Test exact test.
To identify functions enriched in S. sclerotinia and B. cinerea proteins, we identified PFAM domains in each of the above genomes, and computed enrichment or depletion in subsets of species. Protein domains from PFAM release 25 (ftp://ftp.sanger.ac.uk/pub/databases/Pfam) were assigned to proteins in each genome using hmmsearch from hmmer3 (http://hmmer.janelia.org/software), requiring an Evalue cutoff of 1e-5. For each genome, the total number of proteins with each type of domain was computed; a protein with multiple domains of the same type was counted only once. To identify domains enriched in subsets of genomes, significant differences were identified by computing the p-value for each domain based on a hypergeometric distribution (phyper function in R), and computing q-values to correct for multiple testing (p.adjust, fdr). Domains significantly enriched in the S. sclerotiorum and B. cinerea genomes (Table S10) were filtered to remove those found in transposable elements (PF03221, Tc5 transposase DNA binding domain; PF00078, Reverse transcriptase; PF00665, Integrase core domain; PF03184, DDE superfamily endonuclease; PF03732, Retrotransposon gag protein; PF00075, RNase H; PF05225, helix-turn-helix, Psq domain). Domains significantly depleted in the S. sclerotiorum and B. cinerea genomes (Table S11) were filtered to list those that are conserved in at least 5 species.
EST libraries
For S. sclerotiorum, a total of 96,700 filtered EST sequenced were generated from eight cDNA libraries, prepared from mRNA from developing sclerotia, developing apothecia following 55 h light exposure, mycelia at pH 7, infected Brassica or infected tomato, two infection cushion samples, and mycelium exposed to oxidative stress (Table S30). ESTs were aligned to the S. sclerotiorum genome using BLAST and compared to predicted gene structures.
Fourteen cDNA libraries of various B. cinerea isolates (T4, B05.10, SAS56×SAS405, ATCC 58025) and stages of development have been prepared and sequenced in various laboratories (Table S31). Some of them were publicly available [148], [149] (library BcA1 and AL11), others were sequenced in the framework of the B. cinerea sequencing project by Genoscope (http://www.genoscope.cns.fr/, libraries PD0A*) while others are private (Bayer Crop Sciences/P. Tudzynski). From these 14 cDNA libraries (Table S31), 78,755 bacterial clones were obtained and sequenced once or twice (5′ end; 3′ end), leading to 83,117 ESTs (1 or 2 ESTs per clone).
Eighty six percent of ESTs, (71,238 ESTs, 67,625 clones, Figure S10) were successfully clustered on the B. cinerea T4 genome and assembled using Phrap [http://www.phrap.org/] to finally obtain 9,667 EST contigs. As some genes were lying in different contigs, the 9,667 contigs were assembled in 9,004 unisequences. In order to get an estimate of the expression of genes corresponding to the unisequences, we calculated the raw_clone_nr sum (clone number in all libraries), the raw_clone_nr (clone number in the current library), the percent_clone (100* raw_clone_nr/clone_nr in the current library), and the norm_percent (percent_clone normalized by the percent_clones in all libraries = 100 * (percent_clone)/sum(percent_clone) in all libraries). Eighteen percent of unisequences without any corresponding genes automatically predicted (mostly due to gap in the genome sequence) were used to design oligos for the Nimblegen microarrays.
Microarray experiments
A Nimblegen 1-plex array was designed using 21,200 B. cinerea gene models corresponding to 19,454 ORFs either identified in T4 or B05.10 genomes (12,071 T4 ORFs shared between T4 and B05.10; 93 B05.10 ORFs shared between T4 and B05.10; 4,072 T4 ORFs specific to T4; 3,218 B05.10 ORFs specific to B05.10), 12 experimental genes and 1,734 additional EST unisequences. Nine probes per sequence were defined, leading to 169,347 probes representing 20,889 genes and covering 20,916 provided gene models (19,222 ORFs, 12 experimental genes and 1,682 ESTs). In addition, 16,871 random probes (negative controls) were designed. Two copies of each probe were placed on the array.
A second Nimblegen 1-plex array was designed using 15,026 S. sclerotiorum gene models corresponding to 14,522 ORFs and 504 additional EST unisequences. Thirteen probes per sequence were defined, leading to 190,130 probes representing 14,801 genes and covering 14,858 provided gene models (14,360 ORFs and 498 ESTs). In addition, 9,047 random probes (negative controls) were designed. Two copies of each probe were placed on the array.
Expression of fungal genes was studied during infection on sunflower cotyledon, and compared with in vitro expression. The experimental conditions were: (i) Infection of sunflower cotyledons by mycelial plugs of B. cinerea (B05.10) and S. sclerotiorum at 2 days after inoculation (100% of the surface area was infected), (ii) mycelial cultures grown in vitro (malt agar) for each fungal strain, and (iii) non-infected sunflower cotyledons. RNAs were extracted from 3 biological replicates, labelled and hybridized to arrays. 2 or 3 biological replicates per experimental condition were exploitable. Data were analysed using ANAIS methods [150]. Probe hybridization signals were normalized using the quantile function, and summed for each gene. Genes were considered as expressed when the signal was above the defined background (1.5 fold the 95th percentile of random probes hybridization signals), in all the biological replicates of at least one experimental condition. The identification of differentially expressed genes was performed using an ANOVA test. To deal with multiple testings, the ANOVA p-values were further submitted to Bonferroni correction. Transcripts with a corrected p-value<0.05 and more than 2.0 fold change in transcript level were considered as significantly differentially expressed. Details of experiments, raw values and lists of differentially expressed genes with associated normalized values are available at http://urgi.versailles.inra.fr/Data/Transcriptome.
Database resources and interface
B. cinerea T4 resources (http://urgi.versailles.inra.fr/Species/Botrytis)
Databases and Genome Browser (Gbrowse, Apollo) system relies on the international open source project Generic Model Organism Database (GMOD: http://www.gmod.org). The database was populated with B. cinerea T4 genome sequences (supercontigs and contigs) and features predicted or mapped to these sequences: predicted genes, proteins from Uniprot and local fungal protein database, ESTs from 14 B. cinerea cDNA libraries (83,000 ESTs, 9667 unisequences), ESTs from S. sclerotiorum (70,000), genes from B. cinerea strain B05.10 and S. sclerotiorum, genome supercontigs of B. cinerea (B05.10) and S. sclerotiorum, Repeats (Transposable Elements and Tandem Repeats). Results from automated gene prediction are currently manually curated using an editing interface (Apollo), leading to an increase in quality and reliable annotation (http://urgi.versailles.inra.fr/Tools/Apollo). We have also developed and setup an integrated system relying on the Genome Report System (unpublished, http://urgi.versailles.inra.fr/grs/index.html) set up to display functional annotation data on proteins for both S. sclerotiorum and B. cinerea (T4, B05.10). Searches are processed through GnpIS QuickSearch (http://urgi.versailles.inra.fr/gnpis).
B. cinerea B05.10 and S. sclerotiorum resources
Sequence data from the Broad Insitute is available from http://www.broadinstitute.org/annotation/genome/sclerotinia_sclerotiorum/MultiHome.html and http://www.broadinstitute.org/annotation/genome/botrytis_cinerea/.
Peptidases
Complete proteome sequences were downloaded from NCBI or JGI and subjected to Merops Batch BLAST analysis [151]. Sequences from S. sclerotiorum and B. cinerea identified by Merops as putative peptidases were scrutinised based on the presence of active site and ligand residues as well as e values (cut off 1e-5). Additional BLAST analysis was performed at NCBI in order to confirm or reject suspicious hits. We excluded from the analysis the peptidases of which the activity is restricted to an autocatalytic activation of the precursor protein. We also excluded putative peptidases with problematic function inference such as the S9 and S33 proteases. The peptidases of S. sclerotiorum and B. cinerea were subjected to SignalP analysis [152]. Analyses of the other fungal peptidases were restricted to the families of which at least one sequence was predicted to correspond to a secreted peptidase and performed as described.
Methods for CAZy annotation
The best protein models of the S. sclerotiorum and B. cinerea genomes were subject to expert analysis using the CAZy database (www.cazy.org) annotation pipeline [153]. Each model was compared by BLAST [154] to libraries of known catalytic and carbohydrate-binding modules derived from the CAZy database and from previously analyzed genomes. Each identified protein model was subject to modular analysis compring BLAST [154] and HMMer [155] analysis against CAZy-derived libraries and HMM profiles, respectively, followed by human curation. Later, the quality of each identified model was manually evaluated and an expert functional annotation was proposed by comparison against characterized enzymes from CAZy. The approaches are described in more detail elsewhere [153]. Finally, comparative analysis was performed against other fungal genomes using the same principles as described before [156].
Genbank accession numbers
Assemblies and annotations were submitted to GenBank under the following accession numbers: AAGT01000000 (S. sclerotiorum), AAID00000000 (B. cinerea B05.10), FQ790245 to FQ790362 (B. cinerea T4).
Supporting Information
Zdroje
1. BoltonMDThommaBPNelsonBD 2006 Sclerotinia sclerotiorum (Lib.) de Bary: Biology and molecular traits of a cosmopolitan pathogen. Mol Plant Pathol 7 1 16
2. WilliamsonBTudzynskiBTudzynskiPvan KanJAL 2007 Botrytis cinerea: The cause of grey mould disease. Mol Plant Pathol 8 561 580
3. OliverRPSolomonPS 2010 New developments in pathogenicity and virulence of necrotrophs. Curr Opin Plant Biol 13 415 419
4. DickmanMBParkYKOltersdorfTLiWClementeT 2001 Abrogation of disease development in plants expressing animal antiapoptotic genes. Proc Natl Acad Sci U S A 98 6957 6962
5. KimKSMinJYDickmanMB 2008 Oxalic acid is an elicitor of plant programmed cell death during Sclerotinia sclerotiorum disease development. Mol Plant Microbe Interact 21 605 612
6. van BaarlenPWolteringEJStaatsMvan KanJAL 2007 Histochemical and genetic analysis of host and non-host interactions of Arabidopsis with three Botrytis species: An important role for cell death control. Mol Plant Pathol 8 41 54
7. ChoquerMFournierEKunzCLevisCPradierJM 2007 Botrytis cinerea virulence factors: New insights into a necrotrophic and polyphageous pathogen. FEMS Microbiol Lett 277 1 10
8. WilliamsBKabbageMKimHBrittRDickmanMB 2011 Tipping the balance: Sclerotinia sclerotiorum secreted oxalic acid suppresses host defenses by manipulating the host redox environment. PLoS Path 7 e1002107 doi:10.1371/journal.ppat.1002107
9. TudzynskiPKokkelinkL 2009 Botrytis cinerea: Molecular aspects of a necrotrophic life-style. DeisingH The Mycota. Vol. V. Plant Relationships Berlin, Heidelberg Springer-Verlag 29 50
10. SpanuPDAbbottJCAmselemJBurgisTASoanesDM 2010 Genome expansion and gene loss in powdery mildew fungi reveal tradeoffs in extreme parasitism. Science 330 1543 1546
11. HaneJKLoweRGSolomonPSTanKCSchochCL 2007 Dothideomycete plant interactions illuminated by genome sequencing and EST analysis of the wheat pathogen stagonospora nodorum. Plant Cell 19 3347 3368
12. EllwoodSRLiuZSymeRALaiZHaneJK 2010 A first genome assembly of the barley fungal pathogen Pyrenophora teres f. teres. Genome Biol 11 R109
13. WangZJohnstonPRTakamatsuSSpataforaJWHibbettDS 2006 Toward a phylogenetic classification of the leotiomycetes based on rDNA data. Mycologia 98 1065 1075
14. SpataforaJWSungGHJohnsonDHesseCO'RourkeB 2006 A five-gene phylogeny of pezizomycotina. Mycologia 98 1018 1028
15. AguiletaGMartheySChiapelloHLebrunMHRodolpheF 2008 Assessing the performance of single-copy genes for recovering robust phylogenies. Syst Biol 57 613 627
16. SchochCLSungGLópez-GiráldezFTownsendJPMiadlikowskaJ 2009 The ascomycota tree of life: A phylum-wide phylogeny clarifies the origin and evolution of fundamental reproductive and ecological traits. Syst Biol 58 224 239
17. WangHXuZGaoLHaoB 2009 A fungal phylogeny based on 82 complete genomes using the composition vector method. BMC Evol Biol 9 195
18. StaatsMvan BaarlenPvan KanJAL 2005 Molecular phylogeny of the plant pathogenic genus Botrytis and the evolution of host specificity. Mol Biol Evol 22 333 346
19. Holst-JensenAKohnLMJakobsenKSSchumacherT 1997 Molecular phylogeny and evolution of Monilinia (sclerotiniaceae) based on coding and noncoding rDNA sequences. Am J Bot 84 686 701
20. JaffeDBButlerJGnerreSMauceliELindblad-TohK 2003 Whole-genome sequence assembly for mammalian genomes: Arachne 2. Genome Res 13 91 96
21. Fraissinet-TachetLReymond-CottonPFevreM 1996 Molecular karyotype of the phytopathogenic fungus Sclerotinia sclerotiorum. Curr Genet 29 496 501
22. ShiraneNMasukoMHayashiY 1989 Light microscopic observation of nuclei and mitotic chromosomes of Botrytis species. Phytopathology 79 728 730
23. CambareriEBAisnerRCarbonJ 1998 Structure of the chromosome VII centromere region in Neurospora crassa: Degenerate transposons and simple repeats. Mol Cell Biol 18 5465 5477
24. SharpPMLloydAT 1993 Regional base composition variation along yeast chromosome III: Evolution of chormosome primary structure. Nucleic Acids Res 21 179 183
25. RouxelTGrandaubertJHaneJKHoedeCvan de WouwAP 2011 Effector diversification within compartments of the Leptosphaeria maculans genome affected by repeat-induced point mutations. Nat Commun 2 202
26. LerochMMernkeDKoppenhoeferDSchneiderPMosbachA 2011 Living colors in the Gray Mold pathogen Botrytis cinerea: Codon-optimized genes encoding green fluorescent protein and mCherry, which exhibit bright fluorescence. Appl Environ Microbiol 77 2887 2897
27. HaasBJDelcherALWortmanJRSalzbergSL 2004 DAGchainer: A tool for mining segmental genome duplications and synteny. Bioinformatics 20 3643 3646
28. PaolettiMSaupeSJ 2009 Fungal incompatibility: Evolutionary origin in pathogen defense? Bio Essays 31 1201 1210
29. JoSHKooDHKimJFHurCGLeeS 2009 Evolution of ribosomal DNA-derived satellite repeat in tomato genome. BMC Plant Biol 9 42
30. QuesnevilleHBergmanCMAndrieuOAutardDNouaudD 2005 Combined evidence annotation of transposable elements in genome sequences. PLoS Comput Biol 1 e22 doi:10.1371/journal.pcbi.0010022
31. FlutreTDupratEFeuilletCQuesnevilleH 2011 Considering transposable element diversification in de novo annotation approaches. PLoS ONE 6 e16526 doi:10.1371/journal.pone.0016526
32. GarfinkelDJNyswanerKMStefaniskoKMChangCMooreSP 2005 Ty1 copy number dynamics in Saccharomyces. Genetics 169 1845 1857
33. LavinJLOguizaJARamirezLPisabarroAG 2008 Comparative genomics of the oxidative phosphorylation system in fungi. Fungal Genet Biol 45 1248 1256
34. CarneiroPDuarteMVideiraA 2007 The external alternative NAD(P)H dehydrogenase NDE3 is localized both in the mitochondria and in the cytoplasm of Neurospora crassa. J Mol Biol 368 1114 1121
35. SchumacherJViaudMSimonATudzynskiB 2008 The Galpha subunit BCG1, the phospholipase C (BcPLC1) and the calcineurin phosphatase co-ordinately regulate gene expression in the grey mould fungus Botrytis cinerea. Mol Microbiol 67 1027 1050
36. CatlettNLYoderOCTurgeonBG 2003 Whole-genome analysis of two-component signal transduction genes in fungal pathogens. Eukaryot Cell 2 1151 1161
37. WilsonRATalbotNJ 2009 Under pressure: Investigating the biology of plant infection by Magnaporthe oryzae. Nat Rev Microbiol 7 185 195
38. JurickWM2ndRollinsJA 2007 Deletion of the adenylate cyclase (sac1) gene affects multiple developmental pathways and pathogenicity in Sclerotinia sclerotiorum. Fungal Genet Biol 44 521 530
39. KlimpelAGronoverCSWilliamsonBStewartJATudzynskiB 2002 The adenylate cyclase (BAC) in Botrytis cinerea is required for full pathogenicity. Mol Plant Pathol 3 439 450
40. SchumacherJKokkelinkLHuesmannCJimenez-TejaDColladoIG 2008 The cAMP-dependent signaling pathway and its role in conidial germination, growth, and virulence of the gray mold Botrytis cinerea. Mol Plant-Microbe Interact 21 1443 1459
41. ReapeTJMcCabePF 2010 Apoptotic-like regulation of programmed cell death in plants. Apoptosis 15 249 256
42. WilliamsBDickmanM 2008 Plant programmed cell death: Can't live with it; can't live without it. Mol Plant Pathol 9 531 544
43. NavarreDAWolpertTJ 1999 Victorin induction of an apoptotic/senescence-like response in oats. Plant Cell 11 237 249
44. SweatTWolpertT 2005 Characterization of victorin-induced cell death in Arabidopsis thaliana. Phytopathology 95 S101
45. Veneault-FourreyCBarooahMEganMWakleyGTalbotNJ 2006 Autophagic fungal cell death is necessary for infection by the rice blast fungus. Science 312 580 583
46. KershawMJTalbotNJ 2009 Genome-wide functional analysis reveals that infection-associated fungal autophagy is necessary for rice blast disease. Proc Natl Acad Sci U S A 106 15967 15972
47. FinkelshteinAShlezingerNBunisOSharonA 2011 Botrytis cinerea BcNma is involved in apoptotic cell death but not in stress adaptation. Fungal Genet Biol 48 621 630
48. SharonAFinkelshteinAShlezingerNHatamI 2009 Fungal apoptosis: Function, genes and gene function. FEMS Microbiol Rev 33 833 854
49. ShlezingerNMinzAGurYHatamIDagdasYF 2011 Anti-apoptotic machinery protects the necrotrophic fungus Botrytis cinerea from host-induced apoptotic-like cell death during plant infection. PLoS Pathog 7 e1002185 doi:10.1371/journal.ppat.1002185
50. PoulterRTGoodwinTJButlerMI 2007 The nuclear-encoded inteins of fungi. Fungal Genet Biol 44 153 179
51. BokorAAMvan KanJALPoulterRTM 2010 Sexual mating of Botrytis cinerea illustrates PRP8 intein HEG activity. Fungal Genet Biol 47 392 398
52. MalvarezGCarboneIGrunwaldNJSubbaraoKVSchaferM 2007 New populations of Sclerotinia sclerotiorum from lettuce in california and peas and lentils in Washington. Phytopathology 97 470 483
53. FaretraFAntonacciEPollastroS 1988 Sexual behaviour and mating system of Botryotinia fuckeliana, teleomorph of Botrytis cinerea. J Gen Microbiol 134 2543 2550
54. DebuchyRBerteaux-LecellierVSilarP 2010 Mating systems and sexual morphogenesis in Ascomycetes. BorkovichKAEbboleDJ Cellular and Molecular Biology of Filamentous Fungi Washington ASM Press 501 535
55. IdnurmAWaltonFJFloydAHeitmanJ 2008 Identification of the sex genes in an early diverged fungus. Nature 451 193 196
56. DyerPS 2008 Evolutionary biology: Genomic clues to original sex in fungi. Curr Biol 18 R207 R209
57. FraserJAStajichJETarchaEJColeGTInglisDO 2007 Evolution of the mating type locus: Insights gained from the dimorphic primary fungal pathogens Histoplasma capsulatum, Coccidioides immitis, and Coccidioides posadasii. Eukaryot Cell 6 622 629
58. MandelMABarkerBMKrokenSRounsleySDOrbachMJ 2007 Genomic and population analyses of the mating type loci in Coccidioides species reveal evidence for sexual reproduction and gene acquisition. Eukaryot Cell 6 1189 1199
59. FedorovaNDKhaldiNJoardarVSMaitiRAmedeoP 2008 Genomic islands in the pathogenic filamentous fungus Aspergillus fumigatus. PLoS Genet 4 e1000046 doi:10.1371/journal.pgen.1000046
60. MartinSHWingfieldBDWingfieldMJSteenkampET 2011 Structure and evolution of the Fusarium mating type locus: New insights from the Gibberella fujikuroi complex. Fungal Genet Biol In Press
61. SinghGAshbyAM 1998 Cloning of the mating type loci from Pyrenopeziza brassicae reveals the presence of a novel mating type gene within a discomycete MAT 1–2 locus encoding a putative metallothionein-like protein. Mol Microbiol 30 799 806
62. PaolettiMRydholmCSchwierEUAndersonMJSzakacsG 2005 Evidence for sexuality in the opportunistic fungal pathogen Aspergillus fumigatus. Curr Biol 15 1242 1248
63. YunSHBerbeeMLYoderOCTurgeonBG 1999 Evolution of the fungal self-fertile reproductive life style from self-sterile ancestors. Proc Natl Acad Sci U S A 96 5592 5597
64. InderbitzinPHarknessJTiurgeonBGBerbeeML 2005 Lateral transfer of mating system in Stemphylium. Proc Natl Acad Sci U S A 102 11390 11395
65. van der Vlugt-BergmansCJBBrandwagtBFWagemakersCAMvan't KloosterJWvan KanJAL 1993 Genetic variation and segregation of DNA polymorphisms in Botrytis cinerea. Mycol Res 97 1193 1200
66. DyerPSO'GormanCM 2011 Sexual development and cryptic sexuality in fungi: insights from Aspergillus species. FEMS Microbiol Rev in press
67. GalaganJECalvoSECuomoCMaLJWortmanJR 2005 Sequencing of Aspergillus nidulans and comparative analysis with A. fumigatus and A. oryzae. Nature 438 1105 1115
68. ErentalADickmanMBYardenO 2008 Sclerotial development in Sclerotinia sclerotiorum: Awakening molecular analysis of a “dormant” structure. Fung Biol Rev 22 6 16
69. RussoGMDahlbergKRVan EttenJL 1982 Identification of a development-specific protein in sclerotia of Sclerotinia sclerotiorum. Exp Mycol 6 259 267
70. LiMRollinsJA 2009 The development-specific protein (Ssp1) from Sclerotinia sclerotiorum is encoded by a novel gene expressed exclusively in sclerotium tissues. Mycologia 101 34 43
71. LiMRollinsJA 2010 The development-specific ssp1 and ssp2 genes of Sclerotinia sclerotiorum encode lectins with distinct yet compensatory regulation. Fungal Genet Biol 47 531 538
72. WallDPFraserHBHirshAE 2003 Detecting putative orthologs. Bioinformatics 19 1710 1711
73. BorkovichKAAlexLAYardenOFreitagMTurnerGE 2004 Lessons from the genome sequence of Neurospora crassa: Tracing the path from genomic blueprint to multicellular organism. Microbiol Mol Biol Rev 68 1 108
74. GourguesMBrunet-SimonALebrunMLevisC 2004 The tetraspanin BcPls1 is required for appressorium-mediated penetration of Botrytis cinerea into host plant leaves. Mol Microbiol 51 619 629
75. XueCParkGChoiWZhengLDeanRA 2002 Two novel fungal virulence genes specifically expressed in appressoria of the rice blast fungus. Plant Cell 14 2107 2119
76. SextonACCozijnsenAJKeniryAJewellELoveCG 2006 Comparison of transcription of multiple genes at three developmental stages of the plant pathogen Sclerotinia sclerotiorum. FEMS Microbiol Lett 258 150 160
77. SchamberALerochMDiwoJMendgenKHahnM 2010 The role of mitogen-activated protein (MAP) kinase signalling components and the Ste12 transcription factor in germination and pathogenicity of Botrytis cinerea. Mol Plant Pathol 11 105 119
78. RolkeYLiuSQuiddeTWilliamsonBSchoutenA 2004 Functional analysis of H2O2-generating systems in Botrytis cinerea: The major cu-zn-superoxide dismutase (BCSOD1) contributes to virulence on french bean, whereas a glucose oxidase (BCGOD1) is dispensable. Mol Plant Pathol 5 17 27
79. HansbergWAguirreJ 1990 Hyperoxidant states cause microbial cell differentiation by cell isolation from dioxygen. J Theor Biol 142 201 221
80. SegmüllerNKokkelinkLGiesbertSOdiniusDvan KanJ 2008 NADPH oxidases are involved in differentiation and pathogenicity in Botrytis cinerea. Mol Plant-Microbe Interact 21 808 819
81. AguirreJRíos-MombergMHewittDHansbergW 2005 Reactive oxygen species and development in microbial eukaryotes. Trends Microbiol 13 111 118
82. TakemotoDTanakaAScottB 2007 NADPH oxidases in fungi: Diverse roles of reactive oxygen species in fungal cellular differentiation. Fungal Genet Biol 44 1065 1076
83. Turrion-GomezJLBenitoEP 2011 Flux of nitric oxide between the necrotrophic pathogen Botrytis cinerea and the host plant. Mol Plant Pathol 606 616
84. TemmeNTudzynskiP 2009 Does Botrytis cinerea ignore H2O2-induced oxidative stress during infection? Characterization of Botrytis activator protein 1. Mol Plant-Microbe Interact 22 987 998
85. De BaryA 1884 Comparative morphology and biology of the fungi mycetozoa and bacteria Oxford Clarendon Press 525
86. MaxwellDPLumsdenRD 1970 Oxalic acid production by Sclerotinia sclerotiorum in infected bean and in culture. Phytopathology 60 1395 1398
87. GodoyGSteadmanJRDickmanMBDamR 1990 Use of mutants to demonstrate the role of oxalic acid in pathogenicity of Sclerotinia sclerotiorum on Phaseolus vulgaris. Physiol Mol Plant Pathol 37 179 191
88. RollinsJA 2003 The Sclerotinia sclerotiorum pac1 gene is required for sclerotial development and virulence. Mol Plant-Microbe Interact 16 785 795
89. BatemanDFBeerSV 1965 Simultaneous production and synergistic action of oxalic acid and polygalacturonase during pathogenesis by Sclerotium rolfsii. Phytopathology 55 204 211
90. MarcianoPDi LennaPMagroP 1983 Oxalic acid, cell wall-degrading enzymes and pH in pathogenesis and their significance in the virulence of two Ssclerotinia sclerotiorum isolates on sunflower. Physiol Plant Pathol 22 339 345
91. FavaronFSellaLD'OvidioR 2004 Relationships among endo-polygalacturonase, oxalate, pH, and plant polygalacturonase-inhibiting protein (PGIP) in the interaction between Sclerotinia sclerotiorum and soybean. Mol Plant Microbe Interact 17 1402 1409
92. CessnaSGSearsVEDickmanMBLowPS 2000 Oxalic acid, a pathogenicity factor for Sclerotinia sclerotiorum, suppresses the oxidative burst of the host plant. Plant Cell 12 2191 2200
93. GuimaraesRLStotzHU 2004 Oxalate production by Sclerotinia sclerotiorum deregulates guard cells during infection. Plant Physiol 136 3703 3711
94. RollinsJADickmanMB 2001 pH signaling in Sclerotinia sclerotiorum: Identification of a pacC/RIM1 homolog. Appl Environ Microbiol 67 75 81
95. DickmanMB 2007 Subversion or coersion? Pathogenic derminants in fungal phytopathogens. Fungal Biology Rev 21 125 129
96. MaxwellDP 1973 Oxalate formation in Whetzelinia sclerotiorum by oxaloacetate acetylhydrolase. Physiol Mol Plant Pathol 3 279 288
97. HanYJoostenHNiuWZhaoZMarianoPS 2007 Oxaloacetate hydrolase, the C–C bond lyase of oxalate secreting fungi. J Biol Chem 282 9581 9590
98. MagroPMarcianoPDi LennaP 1988 Enzymatic oxalate decarboxylation in isolates of Sclerotinia sclerotiorum. FEMS Microbiol Lett 49 49 52
99. DüsterhöftEPosthumusMAVoragenAGJ 1992 Non-starch polysaccharides from sunflower (Helianthus annuus) meal and palm-kernel (Elaeis guineensis) meal? Investigation of the structure of major polysaccharides. J Sci Food Agric 59 151 160
100. SiezenRJRenckensBBoekhorstJ 2007 Evolution of prokaryotic subtilases: Genome-wide analysis reveals novel subfamilies with different catalytic residues. Proteins: Struct Funct Bioinf 67 681 694
101. FujinagaMCherneyMMOyamaHOdaKJamesMNG 2004 The molecular structure and catalytic mechanism of a novel carboxyl peptidase from Scytalidium lignicolum. Proc Natl Acad Sci U S A 101 3364 3369
102. ten HaveAEspinoJJDekkersEVan SluyterSCBritoN 2010 The Botrytis cinerea aspartic proteinase family. Fungal Genet Biol 47 53 65
103. SchirawskiJMannhauptGMunchKBrefortTSchipperK 2010 Pathogenicity determinants in smut fungi revealed by genome comparison. Science 330 1546 1548
104. RavensdaleMNemriAThrallPHEllisJGDoddsPN 2011 Co-evolutionary interactions between host resistance and pathogen effector genes in flax rust disease. Mol Plant Pathol 12 93 102
105. KhangCHBerruyerRGiraldoMCKankanalaPParkSY 2010 Translocation of Magnaporthe oryzae effectors into rice cells and their subsequent cell-to-cell movement. Plant Cell 22 1388 1403
106. FarisJDZhangZLuHLuSReddyL 2010 A unique wheat disease resistance-like gene governs effector-triggered susceptibility to necrotrophic pathogens. Proc Natl Acad Sci U S A 107 13544 13549
107. CiuffettiLMManningVAPandelovaIBettsMFMartinezJP 2010 Host-selective toxins, ptr ToxA and ptr ToxB, as necrotrophic effectors in the Pyrenophora tritici-repentis-wheat interaction. New Phytol 187 911 919
108. NodaJBritoNGonzalezC 2010 The Botrytis cinerea xylanase Xyn11A contributes to virulence with its necrotizing activity, not with its catalytic activity. BMC Plant Biol 10 38
109. ColmenaresAJAleuJDuran-PatronRColladoIGHernandez-GalanR 2002 The putative role of botrydial and related metabolites in the infection mechanism of Botrytis cinerea. J Chem Ecol 28 997 1005
110. TaniHKoshinoHSakunoECutlerHGNakajimaH 2006 Botcinins E and F and botcinolide from Botrytis cinerea and structural revision of botcinolides. J Nat Prod 69 722 725
111. KellerNPTurnerGBennettJW 2005 Fungal secondary metabolism - from biochemistry to genomics. Nat Rev Microbiol 3 937 947
112. AggerSLopez-GallegoFSchmidt-DannertC 2009 Diversity of sesquiterpene synthases in the basidiomycete Coprinus cinereus. Mol Microbiol 72 1181 1195
113. FoxEMHowlettBJ 2008 Secondary metabolism: Regulation and role in fungal biology. Curr Opin Microbiol 11 481 487
114. OsbournA 2010 Secondary metabolic gene clusters: Evolutionary toolkits for chemical innovation. Trends Genet 26 449 457
115. CuomoCAGüldenerUXuJTrailFTurgeonBG 2007 The Fusarium graminearum genome reveals a link between localized polymorphism and pathogen specialization. Science 317 1400 1402
116. DalmaisBSchumacherJMoragaJLe PecheurPTudzynskiB 2011 The Botrytis cinerea phytotoxin botcinic acid requires two polyketide synthases for production and has a redundant role in virulence with botrydial. Mol Plant Pathol 564 579
117. ToyomasuTTsukaharaMKanekoANiidaRMitsuhashiW 2007 Fusicoccins are biosynthesized by an unusual chimera diterpene synthase in fungi. Proc Natl Acad Sci U S A 104 3084 3088
118. PinedoCWangCMPradierJMDalmaisBChoquerM 2008 Sesquiterpene synthase from the botrydial biosynthetic gene cluster of the phytopathogen Botrytis cinerea. ACS Chem Biol 3 791 801
119. SaikiaSNicholsonMJYoungCParkerEJScottB 2008 The genetic basis for indole-diterpene chemical diversity in filamentous fungi. Mycol Res 112 184 199
120. SiewersVKokkelinkLSmedsgaardJTudzynskiP 2006 Identification of an abscisic acid gene cluster in the grey mold Botrytis cinerea. Appl Environ Microbiol 72 4619 4626
121. StefanatoFLAbou-MansourEBuchalaAKretschmerMMosbachA 2009 The ABC transporter BcatrB from Botrytis cinerea exports camalexin and is a virulence factor on Arabidopsis thaliana. Plant J 58 499 510
122. KretschmerMLerochMMosbachAWalkerASFillingerS 2009 Fungicide-driven evolution and molecular basis of multidrug resistance in field populations of the grey mould fungus Botrytis cinerea. PLoS Pathog 5 e1000696 doi:10.1371/journal.ppat.1000696
123. SaierMHJrTranCVBaraboteRD 2006 TCDB: The transporter classification database for membrane transport protein analyses and information. Nucleic Acids Res 34 Database issue D181 D186
124. DulermoTRascleCChinniciGGoutEBlignyR 2009 Dynamic carbon transfer during pathogenesis of sunflower by the necrotrophic fungus Botrytis cinerea: From plant hexoses to mannitol. New Phytol 183 1149 1162
125. KovalchukADriessenAJ 2010 Phylogenetic analysis of fungal ABC transporters. BMC Genomics 11 177
126. ColemanJJMylonakisE 2009 Efflux in fungi: La piece de resistance. PLoS Pathog 5 e1000486 doi:10.1371/journal.ppat.1000486
127. ShelestE 2008 Transcription factors in fungi. FEMS Microbiol Lett 286 145 151
128. ThompsonJDGibsonTJPlewniakFJeanmouginFHigginsDG 1997 The CLUSTAL_X windows interface: Flexible strategies for multiple sequence alignment aided by quality analysis tools. Nucleic Acids Res 25 4876 4882
129. SwoffordDL 2003 PAUP*. phylogenetic analysis using parsimony (*and other methods). Version 4
130. PosadaDCrandallKA 1998 MODELTEST: Testing the model of DNA substitution. Bioinformatics 14 817 818
131. PosadaDBuckleyTR 2004 Model selection and model averaging in phylogenetics: Advantages of akaike information criterion and bayesian approaches over likelihood ratio tests. Syst Biol 53 793 808
132. HuelsenbeckJPRonquistF 2001 MRBAYES: Bayesian inference of phylogenetic trees. Bioinformatics 17 754 755
133. TemnykhSDeClerckGLukashovaALipovichLCartinhourS 2001 Computational and experimental analysis of microsatellites in rice (Oryza sativa L.): Frequency, length variation, transposon associations, and genetic marker potential. Genome Res 11 1441 1452
134. LanderESGreenPAbrahamsonJBarlowADalyMJ 1987 MAPMAKER: An interactive computer package for constructing primary genetic linkage maps of experimental and natural populations. Genomics 1 174 181
135. FoissacSGouzyJRombautsSMathéCAmselemJ 2008 Genome annotation in plants and fungi : Eugene as a model platform. Curr Bioinform 3 87 97
136. SchiexTMoisanARouzéP 2001 EuGène: An eucaryotic gene finder that combines several sources of evidence. GascuelOSagotM - Computational biology, LNCS 2066 Heidelberg, Germany Springer 111 125
137. DegroeveSSaeysYDe BaetsBRouzePVan de PeerY 2005 SpliceMachine: Predicting splice sites from high-dimensional local context representations. Bioinformatics 21 1332 1338
138. LoweTMEddySR 1997 tRNAscan-SE: A program for improved detection of transfer RNA genes in genomic sequence. Nucleic Acids Res 25 955 964
139. KurtzSPhillippyADelcherALSmootMShumwayM 2004 Versatile and open software for comparing large genomes. Genome Biol 5 R12
140. LevisCFortiniDBrygooY 1997 Flipper, a mobile Fot1-like transposable element in Botrytis cinerea. Mol Gen Genet 254 674 680
141. DiolezAMarchesFFortiniDBrygooY 1995 Boty, a long-terminal-repeat retroelement in the phytopathogenic fungus Botrytis cinerea. Appl Environ Microbiol 61 103 108
142. QuevillonESilventoinenVPillaiSHarteNMulderN 2005 InterProScan: Protein domains identifier. Nucleic Acids Res 33 Web Server issue W116 W120
143. Marchler-BauerAAndersonJBChitsazFDerbyshireMKDeWeese-ScottC 2009 CDD: Specific functional annotation with the conserved domain database. Nucleic Acids Research 37 suppl 1 D205 D210
144. KanehisaMGotoSFurumichiMTanabeMHirakawaM 2010 KEGG for representation and analysis of molecular networks involving diseases and drugs. Nucleic Acids Res 38 Database issue D355 D360
145. TatusovRLFedorovaNDJacksonJDJacobsARKiryutinB 2003 The COG database: An updated version includes eukaryotes. BMC Bioinformatics 4 41
146. KroghALarssonBvon HeijneGSonnhammerELL 2001 Predicting transmembrane protein topology with a hidden markov model: Application to complete genomes. J Mol Biol 305 567 580
147. LiLStoeckertCJJrRoosDS 2003 OrthoMCL: Identification of ortholog groups for eukaryotic genomes. Genome Res 13 2178 2189
148. ViaudMLegeaiFPradierJBrygooYBittonF 2005 Expressed sequence tags from the phytopathogenic fungus Botrytis cinerea. Eur J Plant Pathol 111 139 146
149. SilvaEValdesJHolmesDShmaryahuAValenzuelaPD 2006 Generation and analysis of expressed sequence tags from Botrytis cinerea. Biol Res 39 367 376
150. SimonABiotE 2010 ANAIS: Analysis of NimbleGen arrays interface. Bioinformatics 26 2468 2469
151. RawlingsNDMortonFR 2008 The MEROPS batch BLAST: A tool to detect peptidases and their non-peptidase homologues in a genome. Biochimie 90 243 259
152. NielsenHEngelbrechtJBrunakSvon HeijneG 1997 Identification of prokaryotic and eukaryotic signal peptides and prediction of their cleavage sites. Protein Eng 10 1 6
153. CantarelBLCoutinhoPMRancurelCBernardTLombardV 2009 The carbohydrate-active EnZymes database (CAZy): An expert resource for glycogenomics. Nucleic Acids Res 37 Database issue D233 238
154. AltschulSFMaddenTLSchafferAAZhangJZhangZ 1997 Gapped BLAST and PSI-BLAST: A new generation of protein database search programs. Nucleic Acids Res 25 3389 3402
155. EddySR 1998 Profile hidden markov models. Bioinformatics 14 755 763
156. MartinFKohlerAMuratCBalestriniRCoutinhoPM 2010 Perigord black truffle genome uncovers evolutionary origins and mechanisms of symbiosis. Nature 464 1033 1038
157. CollemareJBillardABöhnertHULebrunM 2008 Biosynthesis of secondary metabolites in the rice blast fungus Magnaporthe grisea: The role of hybrid PKS-NRPS in pathogenicity. Mycol Res 112 207 215
158. BushleyKETurgeonBG 2010 Phylogenomics reveals subfamilies of fungal nonribosomal peptide synthetases and their evolutionary relationships. BMC Evol Biol 10 26
Štítky
Genetika Reprodukční medicínaČlánek vyšel v časopise
PLOS Genetics
2011 Číslo 8
Nejčtenější v tomto čísle
- An EMT–Driven Alternative Splicing Program Occurs in Human Breast Cancer and Modulates Cellular Phenotype
- Chromosome Painting Reveals Asynaptic Full Alignment of Homologs and HIM-8–Dependent Remodeling of Chromosome Territories during Meiosis
- A Pre-mRNA–Associating Factor Links Endogenous siRNAs to Chromatin Regulation
- Discovery of Sexual Dimorphisms in Metabolic and Genetic Biomarkers