
Checkpoints in a Yeast Differentiation Pathway Coordinate Signaling during Hyperosmotic Stress
All eukaryotes have the ability to detect and respond to environmental and hormonal signals. In many cases these signals evoke cellular changes that are incompatible and must therefore be orchestrated by the responding cell. In the yeast Saccharomyces cerevisiae, hyperosmotic stress and mating pheromones initiate signaling cascades that each terminate with a MAP kinase, Hog1 and Fus3, respectively. Despite sharing components, these pathways are initiated by distinct inputs and produce distinct cellular behaviors. To understand how these responses are coordinated, we monitored the pheromone response during hyperosmotic conditions. We show that hyperosmotic stress limits pheromone signaling in at least three ways. First, stress delays the expression of pheromone-induced genes. Second, stress promotes the phosphorylation of a protein kinase, Rck2, and thereby inhibits pheromone-induced protein translation. Third, stress promotes the phosphorylation of a shared pathway component, Ste50, and thereby dampens pheromone-induced MAPK activation. Whereas all three mechanisms are dependent on an increase in osmolarity, only the phosphorylation events require Hog1. These findings reveal how an environmental stress signal is able to postpone responsiveness to a competing differentiation signal, by acting on multiple pathway components, in a coordinated manner.
Published in the journal:
. PLoS Genet 8(1): e32767. doi:10.1371/journal.pgen.1002437
Category:
Research Article
doi:
https://doi.org/10.1371/journal.pgen.1002437
Summary
All eukaryotes have the ability to detect and respond to environmental and hormonal signals. In many cases these signals evoke cellular changes that are incompatible and must therefore be orchestrated by the responding cell. In the yeast Saccharomyces cerevisiae, hyperosmotic stress and mating pheromones initiate signaling cascades that each terminate with a MAP kinase, Hog1 and Fus3, respectively. Despite sharing components, these pathways are initiated by distinct inputs and produce distinct cellular behaviors. To understand how these responses are coordinated, we monitored the pheromone response during hyperosmotic conditions. We show that hyperosmotic stress limits pheromone signaling in at least three ways. First, stress delays the expression of pheromone-induced genes. Second, stress promotes the phosphorylation of a protein kinase, Rck2, and thereby inhibits pheromone-induced protein translation. Third, stress promotes the phosphorylation of a shared pathway component, Ste50, and thereby dampens pheromone-induced MAPK activation. Whereas all three mechanisms are dependent on an increase in osmolarity, only the phosphorylation events require Hog1. These findings reveal how an environmental stress signal is able to postpone responsiveness to a competing differentiation signal, by acting on multiple pathway components, in a coordinated manner.
Introduction
Eukaryotic cells commonly employ mitogen activated protein kinases (MAPKs) to transduce extracellular signals and evoke intracellular responses [1]. MAPKs are a part of an evolutionarily-conserved three-tiered signaling cascade comprised of the MAPK, a MAPK kinase (MAPKK), and a MAPKK kinase (MAPKKK). In mammalian cells MAPKs respond to diverse stimuli including hormones, stresses, and cytokines. These different stimuli will in many cases activate a common MAPK. Conversely a single stimulus will often activate multiple MAPKs. Understanding how each stimulus and each response is coordinated is often obscured by the large number of components and the functional complexity of signaling networks [2].
MAPK pathways are also present in the unicellular eukaryote Saccharomyces cerevisiae (hereafter, yeast). As in higher eukaryotes, yeast use multiple MAPK pathways to respond to a variety of environmental signals [3]. The two best-characterized examples are the mating pathway and the high osmolarity glycerol (HOG) response pathway (detailed in Figure 1A) [4], [5]. The mating pathway operates through a cell-surface receptor that activates a canonical G protein heterotrimer. The activated G protein recruits Ste5, a scaffold protein that assembles and activates three component kinases: Ste11, Ste7 and the MAPK Fus3 [6], [7]. Active Fus3 promotes events leading to cell fusion including new gene transcription, cell cycle arrest and cytoskeletal rearrangements [8]–[10]. High osmotic stress activates Ste11 as well as Pbs2 and the MAPK Hog1 [11]. Active Hog1 promotes events leading to stress adaptation including increased glycerol production, cell cycle arrest and a pause in protein translation [12]–[17]. Individually, the two pathways have well-defined components, known points of regulation, and established measures of pathway output. Together, the pathways form a signaling network that is a model for the study of signal coordination.

The mating and HOG pathways share several components, yet exhibit remarkable signal fidelity when stimulated individually [3], [18] (Figure 1A, shared components highlighted in green). Hyperosmotic stress does not activate Fus3 or promote mating, and mating pheromones do not activate Hog1 or the HOG pathway. Such pathway fidelity may be maintained by two mechanisms: (i) pathway insulation and (ii) pathway cross-inhibition [19]. The pathway insulation model proposes that physical sequestration of components maintains specificity. For example, Ste11 exists in two scaffolded pools, one that selectively activates Fus3 and another that selectively activates Hog1 [20]. The pathway cross-inhibition model proposes that one pathway inhibits signaling by the competing pathway. For example, Hog1 is required to prevent the inadvertent activation of the mating response by hyperosmotic stress. When Hog1 is absent, or rendered catalytically inactive, hyperosmotic stress promotes mating. Thus it appears that Hog1 targets a component of the mating pathway to maintain fidelity [21]–[24]. However, previous studies were unsuccessful in identifying the substrate(s) of Hog1 in the mating pathway.
Thus the mechanisms that prevent cross-talk remain unresolved. A related and potentially more tractable question is how cells coordinate responses when the mating and HOG pathways are activated simultaneously. To address this question investigators have treated cells simultaneously with mating pheromone and hyperosmotic stress and used pathway-specific transcription reporters to monitor signaling in individual cells [24], [25]. One group reported that the responses to these inputs are mutually exclusive [25]. However a subsequent analysis identified a potential artifact, wherein cell death can produce a spurious signal in reporter assays that employ the red fluorescent protein [24]. In surviving cells reporters of both pathways are activated in proportion to their respective stimuli. Thus a single cell can respond to both hyperosmotic stress and pheromone, but how these responses are prioritized or coordinated remains to be determined.
In this study we establish that the hyperosmotic stress and mating pheromone signals are coordinated. Using a broad array of activity assays, conducted over various time scales, we show that Hog1 delays and dampens the response to pheromone and does so by two distinct mechanisms: (i) negative feedback phosphorylation of a shared component (Ste50) and (ii) feed-forward phosphorylation of a negative regulator of translation (Rck2). Thus, activated Hog1 invokes pathway cross-inhibition to delay the mating differentiation response. Mating differentiation resumes once cellular osmotic balance is restored and cross-inhibition is relieved. These studies provide a model of how a cell integrates competing signals to control cell fate.
Results
Hyperosmotic stress delays the mating response
A hallmark of the mating response is the appearance of a mating projection (shmoo formation), which functions as the eventual site of cell-cell fusion [26]. A hallmark of the osmotic stress response is a rapid but transient reduction in cell volume. This reduction occurs as water leaves the cell in order to equalize internal and external osmolarity. The cell then ramps up glycerol production to restore osmotic balance and cell volume [27]. These signaling pathways are likely to be coordinated as it was reported previously that a decrease in extracellular osmolarity disrupts efficient cell-cell fusion [28].
Here we investigated how an increase in extracellular osmolarity impinges on processes leading to fusion. Recent publications have examined the cell response following co-stimulation with pheromone and hyperosmotic stress, but these papers reached opposing conclusions [24], [25]. Moreover, the authors of the second paper conclude that the pathway insulation model is operative, but base their conclusion on the absence of evidence for the pathway cross-inhibition model. Both reports relied primarily on transcription-reporter assays conducted over a limited time scale. However, as detailed herein, hyperosmotic stress conditions can have confounding effects on transcription-reporter activity, particularly at early time points.
Both the mating and HOG pathways can be activated in a single cell [24]. Because both pathways can be activated simultaneously, it is evident that cross-inhibition does not operate between these pathways. However, several key questions remain unanswered. Most importantly, do cells mate normally under osmotic stress, or is the mating program delayed by the osmotic stress response? If so, how is the mating program delayed when both pathways can be activated simultaneously at the transcriptional level as shown previously [24]? Accordingly, we determined the effect of co-stimulation on multiple events and over a period of several hours; these events include MAPK activation, transcription induction, protein expression, cell differentiation and cell fusion.
We first examined if hyperosmotic stress interferes with mating. To this end we performed quantitative mating assays in the absence and presence of an osmolyte (0.5 M KCl). As shown in Table 1, hyperosmotic conditions decrease mating efficiency by about 64% after a 4-hour mating period. The observed decrease may be caused by events during stress adaptation that postpone mating. To allow stress adaptation we extended the mating period to 24-hours. In this case we observed a more modest 8% decrease in mating efficiency. These results suggest that cells are capable of efficient mating during hyperosmotic conditions, but only after a period of adaptation.

Mating requires that cells undergo G1 arrest and the formation of a mating projection. Thus we next investigated how hyperosmotic stress affects pheromone-induced shmoo formation. We stimulated MATa cells with a saturating concentration of mating pheromone (α factor), or co-stimulated cells with pheromone and KCl. We then visualized and quantified the appearance of shmoos over time by microscopy (Figure 1B and Videos S1, S2, S3). As shown in Figure 1B, the addition of mating pheromone resulted in detectable shmoo formation by 60 minutes, with 60% of cells forming shmoos by 180 minutes. The simultaneous addition of osmolyte resulted in detectable shmoo formation only after 120 minutes, with just 20% of cells forming shmoos by 180 minutes. Addition of higher concentrations of osmolyte, 0.75 M (Figure 1B) or 1 M KCl (data not shown), further delayed shmoo formation. The duration of delay is likely a function of the time needed for cells to adapt, and could also account for the delay in mating noted above.
The data presented above reveal that salt stress delays shmoo formation and diminishes mating efficiency. We then considered whether there was a delay in other aspects of the pheromone response. To this end we monitored Far1. Far1 is induced by pheromone only during the G1 phase of the cell cycle, is required for cell polarization during mating, and is quickly degraded as cells exit G1 [29]–[32]. Thus, Far1 is a broad indicator of cellular events leading up to mating. Addition of mating pheromone alone resulted in detectable Far1 by 60 minutes, while co-stimulation with 0.75 M KCl delayed the appearance of Far1 to 120 minutes (Figure 1C). These findings indicate that the delay in shmoo formation corresponds with a delay in Far1 induction. Thus osmotic stress triggers a delay in the mating response, and this delay is evident at the molecular level as well as at the level of cellular morphogenesis and mating.
Co-stimulation of cells has previously been associated with cytotoxicity [24]. Under our experimental conditions however, nearly all cells survived co-stimulation and were able to resume cell division, as shown in Figure 1B, Videos S2 and S3. We also quantified cell viability using methylene blue staining. By this approach we observed cytotoxicity in ∼6% of the population after 2 hours of co-stimulation with KCl and pheromone (n = 2,632). These results indicate that the delay in Far1 induction, and the corresponding delay in morphogenesis and mating, is not the result of cell death. In contrast about one-third of cells co-stimulated with sorbitol and pheromone did not survive, as reported previously [24].
Hyperosmotic stress dampens and delays transcriptional reporter activity
Hyperosmotic stress activates Hog1 and induces genes required for adaptation [33]. During the immediate response to stress however, there is transient repression (<5 min) of overall gene transcription [34]. Moreover the duration of the delay correlates with the concentration of osmolyte and is prolonged in cells that lack Hog1 [34], [35]. Thus, transcription is regulated by Hog1-dependent and Hog1-independent mechanisms. We postulated that hyperosmotic stress might delay mating in part through a transient repression of transcription. Indeed, we have already shown that Far1 expression is delayed by salt stress; however Far1 abundance is also subject to stimulus-dependent ubiquitination and degradation [30]. To focus specifically on mating gene induction we used a reporter comprised of the β-galactosidase gene fused to the FUS1 promoter (FUS1-lacZ). The FUS1 gene is among the most strongly induced genes during the mating response [9]. As shown in Figure 2, cells stimulated with mating pheromone reached half maximum (t½ max) β-galactosidase activity at roughly 50 minutes (Figure 2A and Table S1). The addition of 0.75 M KCl increased the t½ max by ∼67% and dampened the maximum response by ∼17%. The effects of salt were dose-dependent; with increasing concentrations the delay and dampening became progressively more pronounced.

To distinguish Hog1-dependent and Hog1-independent effects on the transcription response, we measured FUS1 induction in cells lacking HOG1 (hog1Δ) as well as in cells expressing a catalytically deficient mutant, Hog1K52R. These cells were then stimulated with pheromone, or co-stimulated with pheromone and KCl. Similar to wild-type cells, co-stimulation of hog1Δ cells increased the t½ max for FUS1 induction (Figure 2B and Table S2). However, unlike wild-type cells, co-stimulation of hog1Δ cells did not dampen the maximum response. Thus Hog1 contributes to the reduction in transcription response. Also, the change in t½ max was less pronounced in hog1Δ cells compared to wild-type cells, suggesting that Hog1 is at least partly responsible for the delay in mating transcription (Table S2). Hog1K52R cells showed an intermediate t½ max and increased maximum response (Figure 2C and Table S3). This result was anticipated given that Hog1K52R cells exhibit an intermediate level of cross-inhibition and sensitivity to osmotic stress [22], [23], [36]. The non-ionic osmolyte sorbitol was 5-fold more likely to cause cell death but otherwise acted much like KCl (Figure S1 and Table S1). Taken together these results support the view that osmotic stress attenuates mating transcription, and does so by Hog1-dependent and Hog1-independent mechanisms. Moreover, no additional effects associated with hyperosmotic stress were observed on the mating response (Text S1, Figure S2, Table S4, and Figure S3).
The transcriptional reporter FUS1-lacZ measures average differences in a population of cells. However this approach could mask larger differences within a subpopulation of cells, such as those in G1 phase where mating occurs [37]. To determine whether salt diminishes the mating response in a cell cycle dependent manner, we monitored transcription activity in single cells using a green fluorescent protein-based reporter (FUS1-GFP). To avoid any confounding effects of cell cycle-arresting agents, we specifically examined unbudded (G1 phase) cells in an otherwise asynchronous population. As shown in Figure 2D salt delays both GFP production and shmoo formation. Measurements of average pixel intensity among single-cells showed that the distribution of responding cells was uniform whether stimulated with pheromone or co-stimulated with pheromone and KCl (Figure 2E). Moreover, the salt mediated delay observed for cells in G1 phase (∼18 min) was similar to that of an asynchronous cell population (∼12 min) (Figure 2A, 2E and Tables S1, S5). Taken together, single-cell measurements corroborate the observations made using the population-based reporter for mating pathway output.
Hyperosmotic stress dampens mating MAPK activation
Mating pheromones activate Fus3 and induce the transcription of genes required for haploid cell fusion. We have observed that Hog1 dampens and delays the mating transcription response. To determine how Hog1 limits the activation of Fus3 we monitored its activity directly, by immunoblotting with an antibody that recognizes the dually-phosphorylated, fully-active form of the kinase (phospho-Fus3) [38]. As shown in Figure 3, co-stimulation with KCl reduced phospho-Fus3 by one-third compared to cells treated with pheromone alone. Pheromone also induces the expression of the FUS3 gene [9], [39]. To determine the effect of KCl on Fus3 production we quantified Fus3 protein levels with a Fus3-specific antibody. As with phospho-Fus3, total Fus3 was reduced by one third in co-stimulated cells. Thus hyperosmotic stress leads to dampened induction of Fus3 and a concomitant reduction in phospho-Fus3. We then conducted the same experiment in cells lacking Hog1 (Figure 3B). In this case, we found no effect of salt co-stimulation on phospho-Fus3 or Fus3. These data indicate that Hog1 regulates mating by dampening Fus3 production and, consequently, Fus3 activity. Thus Hog1 has a role in limiting gene induction and mating, and may do so by targeting a component downstream of Fus3.

Fus3 is part of a positive feedback loop: the activation of Fus3 by mating pheromone leads to induction of more Fus3, which is subsequently activated by pheromone. We have shown above that Hog1 acts downstream of Fus3, by limiting induction of the protein. We then considered whether Hog1 acts upstream of Fus3, by limiting activation of the kinase. To exclude effects of hyperosmotic stress on Fus3 induction we replaced the native (pheromone-inducible) promoter with the galactose-regulated GAL1 promoter. As expected, we found that cells grown in galactose stably express Fus3, with no induction in the presence of pheromone. However, co-stimulation with salt reduced phospho-Fus3 to nearly one-half of that in cells treated with pheromone alone, even as Fus3 abundance remained unchanged (Figure 4A). In contrast, co-stimulation did not alter phospho-Fus3 in the absence of Hog1 (Figure 4B), except for a small reduction at the earliest (5 min) time point. The effect of salt at 5 minutes was reported by others to be independent of Hog1. Specifically, cells lacking Hog1 require more time to reach ionic equilibrium [34]. Therefore the reduction seen at 5 minutes in hog1Δ cells is likely associated with the extended time required for adaptation to the mechanical and ionic stress caused by cell shrinking. Thus hyperosmotic stress dampens Fus3 activation. The reduction at early time points is evident with or without Hog1, while the reduction at later time points (30 and 60 min) is Hog1-dependent (Figure 2 and Figure 4).

Hog1 is activated rapidly following salt stress and then becomes inactive once the cells have adapted [14]. Fus3 is activated by pheromone, but activation in this case is delayed as long as Hog1 is active. Thus it appears that Fus3 cannot fully respond to pheromone until the cells have adapted to osmotic stress conditions. To investigate this behavior further we treated cells with KCl for various times, followed by treatment with pheromone for 15 minutes. Once again we observed that Fus3 activity is restricted as long as Hog1 is active (Figure 4C). Taken together, our findings indicate that Hog1 regulates mating at two points in the pathway, one downstream of Fus3 that limits protein induction and another upstream of Fus3 that limits kinase activation.
Constitutively active Hog1 dampens mating MAPK activation
Cells utilize Hog1-dependent and Hog1-independent mechanisms to adapt to hyperosmotic stress. To focus exclusively on Hog1-dependent mechanisms we activated the kinase directly, without an osmolyte. To this end we introduced a constitutively active MAPKKK, Ssk2ΔN [40], [41]. Ssk2 is a component of the SLN1-branch of the HOG pathway and is not shared with the mating pathway. Thus expression of Ssk2ΔN activates Hog1 but does not affect Fus3 directly. First, we measured the effect of constitutively-activated Hog1 on pheromone-activated Fus3 over time (Figure 5A). Under these conditions Fus3 activation was reduced by up to 50%, comparable to the reduction observed with KCl (Figure 3A). Hog1 also limited expression of total Fus3 protein. As an additional control we tested mutants lacking Hog1 expression or Hog1 catalytic activity. In this case we observed no change in phospho-Fus3 or Fus3 abundance (Figure 5B). Thus Fus3 can be regulated by Hog1 even in the absence of hyperosmotic stress. Together these results reveal that Hog1 activation is necessary and sufficient to dampen Fus3 activation.
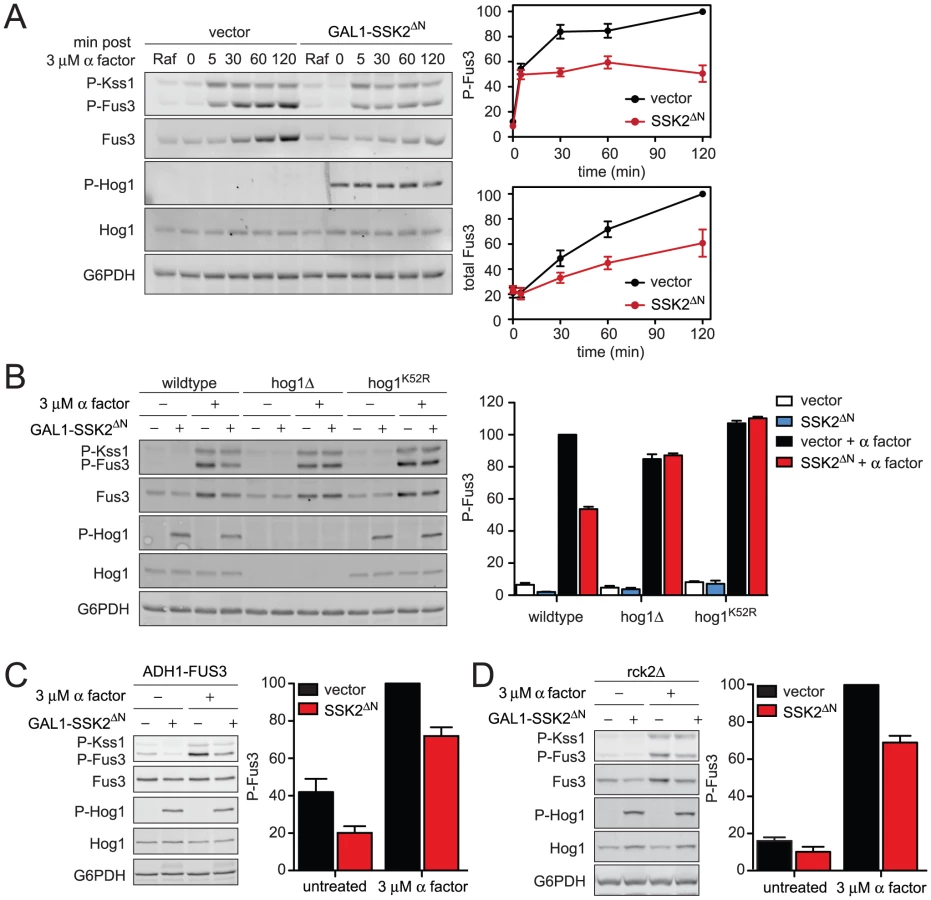
As noted above, induction of Fus3 can confound any analysis of Fus3 activation. To distinguish the effects of Hog1 on Fus3 induction and Fus3 phosphorylation, again we replaced the native FUS3 promoter. In this case we used the strong constitutive promoter from ADH1 (ADH1-FUS3) instead of the GAL1 promoter used above, so as to prevent promoter competition and to ensure consistent levels of Hog1 activation. Under these conditions, constitutively active Hog1 reduced phospho-Fus3 by about one-third, somewhat less than the one-half reduction obtained in cells with the native FUS3 promoter (Figure 5C). We obtained similar results using GAL1-FUS3 (Figure S4) instead of ADH1-FUS3 (Figure 5C). Thus Hog1 dampens Fus3 activation, even when expression is permanently elevated. When Fus3 is expressed from the native promoter, activation is dampened even further. These findings confirm that Fus3 induction and Fus3 phosphorylation are diminished by at least two distinct mechanisms that require Hog1. Each of these mechanisms is considered below.
Rck2 is phosphorylated by Hog1 to limit mating signal during co-stimulation
To establish the mechanisms of pathway cross-inhibition we began with the target of Hog1 that limits Fus3 production. The induction of Fus3 requires transcription of the FUS3 gene and translation of the corresponding mRNA. Hog1 phosphorylates and activates the protein kinase, Rck2 [42]. Activated Rck2 phosphorylates the yeast elongation factor, EF2, and thereby transiently represses translation [43], [44]. Thus we considered whether Rck2 regulates the production of Fus3 under osmotic stress conditions. To test the hypothesis, we constitutively activated Hog1 in the absence of RCK2, and in the presence or absence of pheromone (Figure 5D). Under these conditions, constitutively active Hog1 reduced phospho-Fus3 by about one-third, somewhat less than the one-half reduction obtained in cells that express Rck2 (compare Figure 5B and Figure 5D). Thus Rck2 is partially responsible for the diminished Fus3 response. Taken together these results suggest that Rck2 generally represses translation in response to Hog1, which results in diminished production of Fus3. More broadly these results provide evidence that the consequent repression of Fus3 translation contributes to decreased pheromone responsiveness following hyperosmotic stress.
Ste50 is phosphorylated by Hog1 to limit mating signal during co-stimulation
The data presented above indicate that Hog1 limits Fus3 activity in two ways. First, Hog1 phosphorylates Rck2 and suspends translation of mating pathway components. We have also presented evidence that Hog1 inhibits an upstream activator of the mating MAPK. To identify the second target of Hog1 we employed a genetic epistasis approach. First we determined if constitutively active Hog1 dampens the mating pathway at the level of the three-tiered MAPK cascade. Under normal circumstances the mating signal is initiated by the recruitment of the MAPK scaffold Ste5 to the plasma membrane [45]. Ste5 can be tethered permanently to the plasma membrane via fusion to a carboxy-terminal transmembrane domain (CTM), thus bypassing the need for pheromone, receptor, and G protein in pathway activation (Figure 6A) [7]. In cells that co-express GAL1-STE5CTM and GAL1-SSK2ΔN, phospho-Fus3 was dampened, similar to that seen with pheromone and GAL1-SSK2ΔN (Figure 6B). These data indicate that Hog1 acts on a component downstream of the G protein. We likewise observed dampening of phospho-Kss1, which is also activated by pheromone. These data suggest that the putative Hog1 target is upstream of both Fus3 and Kss1. Taken together these results narrowed the likely target to a handful of components associated with Ste5: the MAPKKK Ste11, its adaptor protein Ste50, its activators Cdc42 and Ste20, and its substrate Ste7 (Figure 1A).

Ste50 is required for full activation of Hog1, Fus3, and Kss1. We and others have demonstrated that Hog1 phosphorylates Ste50 during hyperosmotic conditions. Moreover, the phosphorylation of Ste50 leads to functional downregulation of Hog1 [46], [47]. Given this precedent, we hypothesized that phosphorylation of Ste50 leads to the downregulation of Fus3 and Kss1. To test the role of Ste50, we activated the mating pathway using a truncated form of Ste11; Ste11ΔN lacks the kinase auto-inhibitory domain [48], and also lacks the Ste50 binding domain (Figure 6C) [49]. Thus Ste11ΔN is both constitutively active and refractory to Ste50. As shown in Figure S5, Ste50 is not required for pathway activation by Ste11ΔN even while it is required for full activation by Ste5CTM. We had postulated that Fus3 activity is dampened when Ste50 is phosphorylated. Accordingly, Fus3 should not be affected by Hog1 or Ste50 when the pathway is activated through Ste11ΔN (Figure 6D). Under these conditions, Fus3 is fully activated, consistent with our prediction. Presumably Ste7 is also activated under these conditions, although currently we are not able to monitor its activity directly. Taken together these data suggest that Hog1 limits the mating signal at the level of Ste50. The mating and hyperosmotic stress signals are integrated by Ste50, which in turn regulates the shared MAPKKK, Ste11.
Next we sought to establish whether phosphorylation of Ste50 by Hog1 was responsible for pathway cross-inhibition. To this end we used a mutant of Ste50 (Ste505A) where five MAPK sites have been changed to alanine, thereby abrogating phosphorylation by Hog1 [46], [47]. Consistent with our prediction Ste505A restored the ability of pheromone to activate Fus3, even under conditions of constitutive Hog1 activation (Figure 6E). Fus3 was not fully activated however, presumably because Hog1 could still target Rck2. When we deleted RCK2 from the ste505A strain we were able to attain full activation of Fus3 (Figure 6F and Figure S6). Thus Hog1 limits mating through the phosphorylation of at least two proteins, Ste50 and Rck2. More generally, these results reveal that cross-inhibition occurs through a combination of feedback and feedforward phosphorylation events.
Finally we aimed to determine the biological significance of Fus3 cross-inhibition by Hog1. As shown in Table 1, mating efficiency of wild-type cells is reduced by hyperosmotic conditions, presumably by Hog1-dependent and Hog1-independent mechanisms. To determine the contribution of Hog1 we performed quantitative mating assays in the presence or absence of the two cross-inhibition targets, either alone or in combination. Whereas mating efficiency is diminished in the presence of salt, mating was partially restored in the ste505A rck2Δ mutant strain (Figure 6G and Table S6). The partial rescue suggests that other mechanisms may be operative, or perhaps mating fails because the cells are still responding to stress. Fus3 activation was likewise restored in these mutant cells (Figure S7). Together, our results show that Hog1 inhibits Fus3 induction and activation, and these processes serve to delay mating until the cells have fully adapted to osmotic stress conditions.
Discussion
All cells have the ability to detect changes in their environment and to produce responses appropriate to that stimulus. Our focus here was on two signals that may produce incompatible responses; one that triggers mating differentiation and a second that promotes adaptation to hyperosmotic stress. More specifically, we investigated the ability of yeast cells to coordinate responses to mating pheromones and high salt. We found that in co-stimulated cells, adaptation to hyperosmotic stress takes precedence.
Stress adaptation suspends mating
Prior to our investigations, it was established that Hog1 activation is proportional to the severity of the hyperosmotic stress [50]. Furthermore, the duration of Hog1 activation is tightly correlated with glycerol production and a return to osmotic equilibrium [14]. Thus, hyperosmotic stress and cell adaptation dictate the level and duration of Hog1 activity. Our results support a model where Hog1 suspends the mating response until cells are fully adapted. In particular, we found that Hog1 dampens and delays Fus3 activation, and that the duration of delay is proportional to the severity of the hyperosmotic stress. Just as transient activation of Hog1 leads to transient inhibition of Fus3, persistent activation of Hog1 leads to persistent inhibition of Fus3.
Hog1 regulates Fus3 activation and induction
It was established previously that osmotic stress results in a general inhibition of gene transcription. In cells that lack Hog1, transcription initiation is delayed further [34]. These results show the broad negative effects of salt on gene transcription and point to Hog1 as the primary mediator of the stress response. Paradoxically, cells that lack Hog1 exhibit a stress-mediated increase in the transcription of mating genes. These findings point to a special function for Hog1 in limiting the mating pathway. A major challenge has been to understand how Hog1 regulates Fus3, in addition to any Hog1-independent processes that might affect Fus3 induction. This was achieved by (i) constitutive expression of Fus3 (via promoter replacement) and (ii) direct activation of Hog1 (via Ssk2ΔN). Ultimately these approaches allowed us to identify Ste50 and Rck2 as important targets of Hog1. Phosphorylation of these proteins accounts for delayed mating responses during co-stimulation. However, other targets of Hog1 are likely. In the absence of Hog1, high osmolarity activates the transcriptional outputs of both the filamentous growth pathway and mating pathway. As yet the relevant substrates of Hog1 in cross-talk suppression have not been identified.
Hog1 phosphorylates Ste50 to limit Fus3 activation
Ste50 is a shared component, required for activation of Ste11, that acts early in the mating and osmotic stress pathways. Thus Ste50 is well positioned to coordinate the activity of both Fus3 and Hog1. Moreover, Ste50 is phosphorylated by Hog1 and as a consequence of this phosphorylation there is an attenuated response to hyperosmotic stress [46], [47]. Here we show that as an additional consequence of Ste50 phosphorylation there is an attenuated response to pheromone. On that account, Ste50 is a target of both negative feedback during stress adaptation and cross-inhibition during co-stimulation.
The effects of co-stimulation are most evident at the level of the mating MAPKs. Salt-dependent phosphorylation of Ste50 attenuates pheromone-dependent activation of both Fus3 and Kss1. Whereas the phosphorylation of Ste50 fully accounts for cross-inhibition of Kss1, it is only partially responsible for cross-inhibition of Fus3. Consequently we searched for additional mechanisms of signal integration that act on Fus3 but not Kss1. Given that Fus3 is induced by pheromone - whereas Kss1 is not - we considered whether salt stress inhibits Fus3 transcription or translation.
Hog1 phosphorylates Rck2 to limit Fus3 production
It was established previously that Hog1 directly phosphorylates and activates a repressor of translation elongation, Rck2 [42]. When Rck2 is absent, translation repression is abrogated [43]. Accordingly, we found that Rck2 is needed to inhibit Fus3 accumulation. As with Ste505A, the effect of the rck2Δ mutation was incomplete. However combining both mutations (rck2Δ ste505A) eliminated the ability of Hog1 to inhibit Fus3 (Figure S6). Thus Hog1 phosphorylates components necessary for the activation and induction of Fus3. Together these phosphorylation events act to limit mating responses as long as Hog1 is active. Once the cells are fully adapted, mating can proceed.
While it is clear that Rck2 confers a global inhibition of protein translation [43], it is important to note that Rck2 also contributes to the induction of distinct gene transcripts necessary for stress adaptation [51]. Thus Rck2 may represent a more general mechanism that ensures competing cellular processes do not interfere with the early translation of stress adaptive genes. It is also possible that Rck2 regulates other components of the pheromone pathway, in addition to Fus3. However, many of the core components that make up the MAPK cascade are stably expressed, including the scaffold (Ste5), the MAPKK (Ste7), the MAPKKK (Ste11) and its adaptor (Ste50) [9]. Therefore Hog1 and Rck2 are not expected to interfere with the ability to sense pheromone; rather Hog1 is likely to arrest signal transduction by those proteins that are induced by pheromone, most of which function downstream in the pathway (including Fus3). Thus we postulate that early components of the pheromone pathway are unaffected by hyperosmotic stress conditions.
Ste5 sustains the mating response during stress adaptation
We propose that the earliest events in pheromone signaling, those not subject to pheromone mediated transcriptional induction, are unaffected by hyperosmotic stress conditions. These early events include G protein activation and recruitment of Ste5 [45]. Consistent with this view, our epistasis studies indicate that Hog1 acts downstream of the G protein. Moreover recruitment of Ste5 to the plasma membrane occurs even in the face of hyperosmotic stress [24]. This behavior suggests that the mating pathway remains quiescent only as long as conditions are unfavorable to launch a full mating response. Once cells adapt to stress, Hog1 is deactivated and mating can proceed immediately.
Taken together, available data support a model where mating and HOG pathways are both initiated in response to pheromones and hyperosmotic stress. However, the activation of Hog1 imparts a “checkpoint” midway in the pheromone signaling pathway, and does so to ensure quiescence of the mating response while cells adapt to stress (Figure 7). This design ensures that the mating pathway is primed to resume full signaling once Hog1 is no longer activated. Accordingly, Ste50 and Rck2 are both rapidly dephosphorylated upon adaptation [43], [46]. From these behaviors we can infer that scaffold proteins and shared adaptor proteins have distinct but complementary roles in signaling; scaffold proteins, epitomized by Ste5, behave as insulators, while shared components, such as Ste50, behave as dynamic integrators of multiple signals.

Conclusions
As genomics and proteomics have defined signal pathway components, attention will turn increasingly to understanding how cells coordinate competing signals. In this regard, our findings reveal that pathway cross-inhibition is not a single process, but rather a network of events that work together to postpone cell differentiation until the cell adapts to stress conditions. More broadly, it is increasingly evident that a complete analysis of signal transduction networks will need to consider multiple inputs, multiple regulatory targets, and multiple mechanisms of action.
Materials and Methods
Strains, plasmids, and growth conditions
Standard procedures for growth, maintenance, and transformation of yeast and bacteria and for the manipulation of DNA were used throughout. Plasmids and strains were constructed as previously described [46], [52]–[55]. Yeast strains and plasmids used are listed in supplemental Table S7 and supplemental Table S8, respectively. All mutations were constructed with the QuikChange site-directed mutagenesis kit (Stratagene) according to the manufacturer's directions. Cells were grown in synthetic complete medium containing 2% (w/v) dextrose (SCD) or raffinose followed by the addition of 2% galactose to induce gene expression. Plasmid-transformed cells were grown in synthetic complete medium lacking the appropriate nutrient.
Quantitative mating assay
Yeast mating efficiency was determined by a quantitative method, as described previously [56]. Cells were grown to OD600∼0.6 and counted using a hemocytometer. 5×10⁶ BY4741 (MATa his3Δ1 leu2Δ0 met15Δ0 ura3Δ0) cells were mixed with 5×10⁶ BY4742 (MATα his3Δ1 leu2Δ0 lys2Δ0 ura3Δ0) cells in a volume of 10 ml and passed over a nitrocellulose filter (Millipore). Filter disks were incubated for 4 h or 24 h on YPD agar or YPD agar containing 0.5 M KCl. Mating efficiency was calculated by dividing the number of diploid cells by the number of total cells after 4 h or 24 h mating period.
Microscopy
Cells were grown to A600 nm∼0.8, dispersed by sonication with 10 pulses (1 sec, 50% output), and collected by centrifugation at 14,000× g for 15 seconds. 3 µl of cells were placed on glass slides coated with SCD medium 2% agar (w/v) and either α factor pheromone, or α factor and KCl. Cells were visualized every 15 min by differential interference contrast (DIC) and fluorescence microscopy using an Olympus Fluoview FV1000 confocal microscope with a 60× objective. GFP fluorescence was imaged using a 488-nm argon laser and 500–550 nm emission filter. Videos were constructed and images were analyzed using ImageJ (National Institutes of Health).
Cell viability
Logarithmically growing cells (A600 nm∼0.6) were stimulated with 10 µM α factor and 0.75 M KCl or 1 M sorbitol. Viability was assessed by methylene blue staining (0.01% solution w/v) before and after 2 h of treatment. Prior to counting cells were dispersed by sonication with 5 pulses (1 sec, 50% output) and diluted 1∶10 in SCD with methylene blue and counted using a hemocytometer.
Cell extracts and immunoblotting
Protein extracts were produced by glass bead lysis in TCA as previously described [55]. Protein concentration was determined by Dc protein assay (Bio-Rad Laboratories). Protein extracts were resolved by 7.5% or 12.5% SDS-PAGE and immunoblotting with HA antibodies (clone 3F10, Roche Applied Science) at 1∶2000, Phospho-p44/42 MAPK antibodies (9101, Cell Signaling Technology) at 1∶500, Fus3 antibodies (sc-6773, Santa Cruz Biotechnology, Inc.) at 1∶500, phospho-p38 MAPK antibodies (9216, Cell Signaling Technology) at 1∶500, Hog1 antibodies (sc-6815, Santa Cruz Biotechnology) at 1∶500, and glucose-6-phosphate dehydrogenase (G6PDH) antibodies (A9521, Sigma-Aldrich) at 1∶50,000. Far1-HA immunoreactive species were visualized by chemiluminescent detection (PerkinElmer Life Sciences LAS) of horseradish peroxidase-conjugated antibodies (sc-2006, Santa Cruz Biotechnology, Inc.) at 1∶10,000. All remaining immunoreactive species were visualized by fluorescent detection (Typhoon Trio+Imager, GE Healthcare) of AlexaFluor conjugated antibodies (A21245, A21424, A21431, Invitrogen) at 1∶2,000. Band intensity was quantified by scanning densitometry using Image J (National Institutes of Health). P-Fus3 and P-Kss1 values were normalized to G6PDH loading control.
Transcriptional reporter assay
FUS1-LacZ levels were measured every 30 min after treatment with mating pheromone α factor, or α factor and KCl or sorbitol using a β-galactosidase assay as described previously [54]. Cells were split and diluted 30% with fresh medium containing pheromone alone or pheromone and an indicated concentration of KCl or sorbitol. Aliquots of cells were removed every 30 min, lysed, and β-galactosidase activity was measured.
Supporting Information
Zdroje
1. JohnsonGLLapadatR 2002 Mitogen-activated protein kinase pathways mediated by ERK, JNK, and p38 protein kinases. Science 298 1911 1912
2. QiMElionEA 2005 MAP kinase pathways. J Cell Sci 118 3569 3572
3. ChenREThornerJ 2007 Function and regulation in MAPK signaling pathways: lessons learned from the yeast Saccharomyces cerevisiae. Biochim Biophys Acta 1773 1311 1340
4. DohlmanHGThornerJW 2001 Regulation of G protein-initiated signal transduction in yeast: paradigms and principles. Annu Rev Biochem 70 703 754
5. HohmannS 2002 Osmotic stress signaling and osmoadaptation in yeasts. Microbiol Mol Biol Rev 66 300 372
6. ElionEA 2001 The Ste5p scaffold. J Cell Sci 114 3967 3978
7. PryciakPMHuntressFA 1998 Membrane recruitment of the kinase cascade scaffold protein Ste5 by the Gbetagamma complex underlies activation of the yeast pheromone response pathway. Genes Dev 12 2684 2697
8. ChangFHerskowitzI 1990 Identification of a gene necessary for cell cycle arrest by a negative growth factor of yeast: FAR1 is an inhibitor of a G1 cyclin, CLN2. Cell 63 999 1011
9. RobertsCJNelsonBMartonMJStoughtonRMeyerMR 2000 Signaling and circuitry of multiple MAPK pathways revealed by a matrix of global gene expression profiles. Science 287 873 880
10. YuLQiMSheffMAElionEA 2008 Counteractive control of polarized morphogenesis during mating by mitogen-activated protein kinase Fus3 and G1 cyclin-dependent kinase. Mol Biol Cell 19 1739 1752
11. TatebayashiKYamamotoKTanakaKTomidaTMaruokaT 2006 Adaptor functions of Cdc42, Ste50, and Sho1 in the yeast osmoregulatory HOG MAPK pathway. EMBO J 25 3033 3044
12. ClotetJEscoteXAdroverMAYaakovGGariE 2006 Phosphorylation of Hsl1 by Hog1 leads to a G2 arrest essential for cell survival at high osmolarity. EMBO J 25 2338 2346
13. EscoteXZapaterMClotetJPosasF 2004 Hog1 mediates cell-cycle arrest in G1 phase by the dual targeting of Sic1. Nat Cell Biol 6 997 1002
14. MuzzeyDGomez-UribeCAMettetalJTvan OudenaardenA 2009 A systems-level analysis of perfect adaptation in yeast osmoregulation. Cell 138 160 171
15. UesonoYToh-eA 2002 Transient inhibition of translation initiation by osmotic stress. J Biol Chem 277 13848 13855
16. BelliGGariEAldeaMHerreroE 2001 Osmotic stress causes a G1 cell cycle delay and downregulation of Cln3/Cdc28 activity in Saccharomyces cerevisiae. Mol Microbiol 39 1022 1035
17. EscoteXMirandaMRodriguez-PorrataBMasACorderoR 2011 The stress-activated protein kinase Hog1 develops a critical role after resting state. Mol Microbiol
18. SaitoH 2010 Regulation of cross-talk in yeast MAPK signaling pathways. Curr Opin Microbiol 13 677 683
19. SchwartzMAMadhaniHD 2004 Principles of MAP kinase signaling specificity in Saccharomyces cerevisiae. Annu Rev Genet 38 725 748
20. HarrisKLamsonRENelsonBHughesTRMartonMJ 2001 Role of scaffolds in MAP kinase pathway specificity revealed by custom design of pathway-dedicated signaling proteins. Curr Biol 11 1815 1824
21. HallJPCherkasovaVElionEGustinMCWinterE 1996 The osmoregulatory pathway represses mating pathway activity in Saccharomyces cerevisiae: isolation of a FUS3 mutant that is insensitive to the repression mechanism. Mol Cell Biol 16 6715 6723
22. O'RourkeSMHerskowitzI 1998 The Hog1 MAPK prevents cross talk between the HOG and pheromone response MAPK pathways in Saccharomyces cerevisiae. Genes Dev 12 2874 2886
23. WestfallPJThornerJ 2006 Analysis of mitogen-activated protein kinase signaling specificity in response to hyperosmotic stress: use of an analog-sensitive HOG1 allele. Eukaryot Cell 5 1215 1228
24. PattersonJCKlimenkoESThornerJ 2010 Single-cell analysis reveals that insulation maintains signaling specificity between two yeast MAPK pathways with common components. Sci Signal 3 ra75
25. McCleanMNModyABroachJRRamanathanS 2007 Cross-talk and decision making in MAP kinase pathways. Nat Genet 39 409 414
26. YdenbergCARoseMD 2008 Yeast mating: a model system for studying cell and nuclear fusion. Methods Mol Biol 475 3 20
27. ReedRHChudekJAFosterRGaddGM 1987 Osmotic significance of glycerol accumulation in exponentially growing yeasts. Appl Environ Microbiol 53 2119 2123
28. PhilipsJHerskowitzI 1997 Osmotic balance regulates cell fusion during mating in Saccharomyces cerevisiae. J Cell Biol 138 961 974
29. ValtzNPeterMHerskowitzI 1995 FAR1 is required for oriented polarization of yeast cells in response to mating pheromones. J Cell Biol 131 863 873
30. HenchozSChiYCatarinBHerskowitzIDeshaiesRJ 1997 Phosphorylation - and ubiquitin-dependent degradation of the cyclin-dependent kinase inhibitor Far1p in budding yeast. Genes Dev 11 3046 3060
31. McKinneyJDChangFHeintzNCrossFR 1993 Negative regulation of FAR1 at the Start of the yeast cell cycle. Genes Dev 7 833 843
32. OehlenLJMcKinneyJDCrossFR 1996 Ste12 and Mcm1 regulate cell cycle-dependent transcription of FAR1. Mol Cell Biol 16 2830 2837
33. RepMKrantzMTheveleinJMHohmannS 2000 The transcriptional response of Saccharomyces cerevisiae to osmotic shock. Hot1p and Msn2p/Msn4p are required for the induction of subsets of high osmolarity glycerol pathway-dependent genes. J Biol Chem 275 8290 8300
34. ProftMStruhlK 2004 MAP kinase-mediated stress relief that precedes and regulates the timing of transcriptional induction. Cell 118 351 361
35. RepMAlbertynJTheveleinJMPriorBAHohmannS 1999 Different signalling pathways contribute to the control of GPD1 gene expression by osmotic stress in Saccharomyces cerevisiae. Microbiology 145 Pt 3 715 727
36. SchullerCBrewsterJLAlexanderMRGustinMCRuisH 1994 The HOG pathway controls osmotic regulation of transcription via the stress response element (STRE) of the Saccharomyces cerevisiae CTT1 gene. EMBO J 13 4382 4389
37. HartwellLHCulottiJPringleJRReidBJ 1974 Genetic control of the cell division cycle in yeast. Science 183 46 51
38. SabbaghWJrFlatauerLJBardwellAJBardwellL 2001 Specificity of MAP kinase signaling in yeast differentiation involves transient versus sustained MAPK activation. Mol Cell 8 683 691
39. HiliotiZSabbaghWJrPaliwalSBergmannAGoncalvesMD 2008 Oscillatory phosphorylation of yeast Fus3 MAP kinase controls periodic gene expression and morphogenesis. Curr Biol 18 1700 1706
40. MaedaTTakekawaMSaitoH 1995 Activation of yeast PBS2 MAPKK by MAPKKKs or by binding of an SH3-containing osmosensor. Science 269 554 558
41. Wurgler-MurphySMMaedaTWittenEASaitoH 1997 Regulation of the Saccharomyces cerevisiae HOG1 mitogen-activated protein kinase by the PTP2 and PTP3 protein tyrosine phosphatases. Mol Cell Biol 17 1289 1297
42. Bilsland-MarchesanEArinoJSaitoHSunnerhagenPPosasF 2000 Rck2 kinase is a substrate for the osmotic stress-activated mitogen-activated protein kinase Hog1. Mol Cell Biol 20 3887 3895
43. TeigeMScheiklEReiserVRuisHAmmererG 2001 Rck2, a member of the calmodulin-protein kinase family, links protein synthesis to high osmolarity MAP kinase signaling in budding yeast. Proc Natl Acad Sci U S A 98 5625 5630
44. MelcherMLThornerJ 1996 Identification and characterization of the CLK1 gene product, a novel CaM kinase-like protein kinase from the yeast Saccharomyces cerevisiae. J Biol Chem 271 29958 29968
45. WintersMJLamsonRENakanishiHNeimanAMPryciakPM 2005 A membrane binding domain in the ste5 scaffold synergizes with gbetagamma binding to control localization and signaling in pheromone response. Mol Cell 20 21 32
46. HaoNZengYElstonTCDohlmanHG 2008 Control of MAPK specificity by feedback phosphorylation of shared adaptor protein Ste50. J Biol Chem 283 33798 33802
47. YamamotoKTatebayashiKTanakaKSaitoH 2010 Dynamic control of yeast MAP kinase network by induced association and dissociation between the Ste50 scaffold and the Opy2 membrane anchor. Mol Cell 40 87 98
48. CairnsBRRamerSWKornbergRD 1992 Order of action of components in the yeast pheromone response pathway revealed with a dominant allele of the STE11 kinase and the multiple phosphorylation of the STE7 kinase. Genes Dev 6 1305 1318
49. XuGJansenGThomasDYHollenbergCPRamezani RadM 1996 Ste50p sustains mating pheromone-induced signal transduction in the yeast Saccharomyces cerevisiae. Mol Microbiol 20 773 783
50. MaciaJRegotSPeetersTCondeNSoleR 2009 Dynamic signaling in the Hog1 MAPK pathway relies on high basal signal transduction. Sci Signal 2 ra13
51. WarringerJHultMRegotSPosasFSunnerhagenP 2010 The HOG pathway dictates the short-term translational response after hyperosmotic shock. Mol Biol Cell 21 3080 3092
52. BrachmannCBDaviesACostGJCaputoELiJ 1998 Designer deletion strains derived from Saccharomyces cerevisiae S288C: a useful set of strains and plasmids for PCR-mediated gene disruption and other applications. Yeast 14 115 132
53. CappellSDDohlmanHG 2011 Selective regulation of MAP kinase signaling by an endomembrane phosphatidylinositol 4-kinase. J Biol Chem
54. HoffmanGAGarrisonTRDohlmanHG 2002 Analysis of RGS proteins in Saccharomyces cerevisiae. Methods Enzymol 344 617 631
55. HaoNBeharMParnellSCTorresMPBorchersCH 2007 A systems-biology analysis of feedback inhibition in the Sho1 osmotic-stress-response pathway. Curr Biol 17 659 667
56. SpragueGFJr 1991 Assay of yeast mating reaction. Methods Enzymol 194 77 93
57. BardwellL 2005 A walk-through of the yeast mating pheromone response pathway. Peptides 26 339 350
58. LamsonRETakahashiSWintersMJPryciakPM 2006 Dual role for membrane localization in yeast MAP kinase cascade activation and its contribution to signaling fidelity. Curr Biol 16 618 623
59. HohmannSKrantzMNordlanderB 2007 Yeast osmoregulation. Methods Enzymol 428 29 45
60. TatebayashiKTanakaKYangHYYamamotoKMatsushitaY 2007 Transmembrane mucins Hkr1 and Msb2 are putative osmosensors in the SHO1 branch of yeast HOG pathway. EMBO J 26 3521 3533
61. MaedaTWurgler-MurphySMSaitoH 1994 A two-component system that regulates an osmosensing MAP kinase cascade in yeast. Nature 369 242 245
62. PosasFSaitoH 1998 Activation of the yeast SSK2 MAP kinase kinase kinase by the SSK1 two-component response regulator. EMBO J 17 1385 1394
63. DihaziHKesslerREschrichK 2004 High osmolarity glycerol (HOG) pathway-induced phosphorylation and activation of 6-phosphofructo-2-kinase are essential for glycerol accumulation and yeast cell proliferation under hyperosmotic stress. J Biol Chem 279 23961 23968
64. O'RourkeSMHerskowitzI 2004 Unique and redundant roles for HOG MAPK pathway components as revealed by whole-genome expression analysis. Mol Biol Cell 15 532 542
Štítky
Genetika Reprodukční medicínaČlánek vyšel v časopise
PLOS Genetics
2012 Číslo 1
Nejčtenější v tomto čísle
- Poly(ADP-Ribose) Polymerase 1 (PARP-1) Regulates Ribosomal Biogenesis in Nucleoli
- Microenvironmental Regulation by Fibrillin-1
- Parallel Mapping and Simultaneous Sequencing Reveals Deletions in and Associated with Discrete Inherited Disorders in a Domestic Dog Breed
- Two-Component Elements Mediate Interactions between Cytokinin and Salicylic Acid in Plant Immunity