
CELF4 Regulates Translation and Local Abundance of a Vast Set of mRNAs, Including Genes Associated with Regulation of Synaptic Function
RNA–binding proteins have emerged as causal agents of complex neurological diseases. Mice deficient for neuronal RNA–binding protein CELF4 have a complex neurological disorder with epilepsy as a prominent feature. Human CELF4 has recently been associated with clinical features similar to those seen in mutant mice. CELF4 is expressed primarily in excitatory neurons, including large pyramidal cells of the cerebral cortex and hippocampus, and it regulates excitatory but not inhibitory neurotransmission. We examined mechanisms underlying neuronal hyperexcitability in Celf4 mutants by identifying CELF4 target mRNAs and assessing their fate in the absence of CELF4 in view of their known functions. CELF4 binds to at least 15%–20% of the transcriptome, with striking specificity for the mRNA 3′ untranslated region. CELF4 mRNA targets encode a variety of proteins, many of which are well established in neuron development and function. While the overall abundance of these mRNA targets is often dysregulated in Celf4 deficient mice, the actual expression changes are modest at the steady-state level. In contrast, by examining the transcriptome of polysome fractions and the mRNA distribution along the neuronal cell body-neuropil axis, we found that CELF4 is critical for maintaining mRNA stability and availability for translation. Among biological processes associated with CELF4 targets that accumulate in neuropil of mutants, regulation of synaptic plasticity and transmission are the most prominent. Together with a related study of the impact of CELF4 loss on sodium channel Nav1.6 function, we suggest that CELF4 deficiency leads to abnormal neuronal function by combining a specific effect on neuronal excitation with a general impairment of synaptic transmission. These results also expand our understanding of the vital roles RNA–binding proteins play in regulating and shaping the activity of neural circuits.
Published in the journal:
. PLoS Genet 8(11): e32767. doi:10.1371/journal.pgen.1003067
Category:
Research Article
doi:
https://doi.org/10.1371/journal.pgen.1003067
Summary
RNA–binding proteins have emerged as causal agents of complex neurological diseases. Mice deficient for neuronal RNA–binding protein CELF4 have a complex neurological disorder with epilepsy as a prominent feature. Human CELF4 has recently been associated with clinical features similar to those seen in mutant mice. CELF4 is expressed primarily in excitatory neurons, including large pyramidal cells of the cerebral cortex and hippocampus, and it regulates excitatory but not inhibitory neurotransmission. We examined mechanisms underlying neuronal hyperexcitability in Celf4 mutants by identifying CELF4 target mRNAs and assessing their fate in the absence of CELF4 in view of their known functions. CELF4 binds to at least 15%–20% of the transcriptome, with striking specificity for the mRNA 3′ untranslated region. CELF4 mRNA targets encode a variety of proteins, many of which are well established in neuron development and function. While the overall abundance of these mRNA targets is often dysregulated in Celf4 deficient mice, the actual expression changes are modest at the steady-state level. In contrast, by examining the transcriptome of polysome fractions and the mRNA distribution along the neuronal cell body-neuropil axis, we found that CELF4 is critical for maintaining mRNA stability and availability for translation. Among biological processes associated with CELF4 targets that accumulate in neuropil of mutants, regulation of synaptic plasticity and transmission are the most prominent. Together with a related study of the impact of CELF4 loss on sodium channel Nav1.6 function, we suggest that CELF4 deficiency leads to abnormal neuronal function by combining a specific effect on neuronal excitation with a general impairment of synaptic transmission. These results also expand our understanding of the vital roles RNA–binding proteins play in regulating and shaping the activity of neural circuits.
Introduction
Idiopathic epilepsies (IE) have an unknown etiology, but are generally accepted to be genetic in origin. Although ion channel defects have been identified as primary causal agents in some rare monogenic forms of IE, the genetic underpinnings of the vast majority of more common IE cases, which are likely to be genetically complex, remain unknown. Increasingly, molecular genetic studies have identified defects in non-ion channel genes in common IE, such as the calcium sensors EFHC1 in juvenile myoclonic epilepsy (JME) and CASR in idiopathic generalized epilepsy (IGE) [1], [2], [3], [4]. Regulators of transcription, such as BRD2 and ELP4, have been linked with JME and Rolandic epilepsy (RE), respectively [5], [6]. LGI1, a neuronal secreted protein, has been associated with epilepsy and schizophrenia [7], [8], [9]. Importantly for our study, epilepsy has a high rate of comorbidity with other complex neurodevelopmental disorders, such as autism spectrum disorders (ASD), intellectual disability (ID) and schizophrenia, suggesting that these disorders may indeed share many susceptibility genes [10], [11], [12], [13].
RNA-binding proteins (RBPs) are increasingly being associated with complex genetic diseases, as they can regulate the expression of many genes co-transcriptionally or post-transcriptionally via interactions with mRNA [14], [15], [16]. One such RBP is fragile X mental retardation protein (FMRP). Loss of FMRP causes fragile X syndrome (FXS), a disorder with symptoms including intellectual disability, features of autism, attention deficit and hyperactivity, and altered neuronal excitability that leads to seizures [17]. Additional mammalian RBPs associated with epilepsy in humans and/or mice include JRK/JH8, RBFOX1, PUMILIO-2, and CELF4 [18], [19], [20], [21], [22], [23], [24], [25]. CELF4 deficiency causes a range of neurological abnormalities in mice, including seizures, due to increased neuronal excitation [24], [25]. In human patients, CELF4 is implicated in del(18q) syndrome phenotypes (discussed in [26]) including at least one patient with seizures, hyperactivity, and signs of autistic behaviors, carrying a translocation within CELF4 itself [26].
CELF4 (CUGBP, ELAV-like family member 4) is one of six mammalian CELF proteins that function in mRNA metabolism. CELF1 and CELF2 are broadly expressed, while CELF3 and CELF5 are expressed primarily in the nervous system and CELF6 is expressed in brain, kidney, and testis [27], [28], [29]. Previously, CELF4 was reported to be expressed in many tissues [28], [29] however many studies including our initial description of CELF4 (then BRUNOL4) deficient mice indicate that CELF4 expression is restricted to the central nervous system across species, including mouse [25], [30], nematode (Caenorhabditis elegans) [31], chicken [32], and frog (Xenopus laevis) [33]. CELF proteins play various roles in co-transcriptional and post-transcriptional RNA processing [34]. All CELF proteins can affect pre-mRNA splicing, at least in cell-free assays, but individual CELFs have shown divergent roles in regulating mRNA stability and translation. CELF1 regulates mRNA stability by promoting deadenylation and degradation [35], [36], [37]. In contrast, CELF2 has been shown to bind the 3′ UTR of Cyclooxygenase-2 and Mcl-1 transcripts, stabilizing them and repressing their translation [38], [39]. The Xenopus orthologue of CELF3, however, binds the 3′ UTR of Cyclin A transcripts but enhances their translation [40].
The in vivo roles of the brain-specific CELFs, including CELF4, in mRNA metabolism in the nervous system remain unclear. The neuron-specific CELF3–6 nematode orthologue, UNC-75, is required for proper neurotransmission. Neurotransmission defects in unc-75 mutants can be rescued by expression of human CELF4, suggesting that both may be involved in fine-tuning neural activity through regulation of mRNA in the nervous system [31]. Consistent with neurotransmission defects seen in unc-75 mutants, Celf4 deficient mice with a gene-targeted null allele have aberrant excitatory neurotransmission that leads to a complex seizure disorder [24], [25]. Adult Celf4 null homozygotes and heterozygotes have a low seizure threshold and recurrent handling-associated convulsive seizures with severity and penetrance dependent on mouse strain background. On some strain backgrounds, homozygotes also experience non-convulsive (absence-like) seizures, showing that Celf4 is involved in different types of seizure circuits [24], [25]. Deletion of Celf4 from adult mice is sufficient for convulsive seizure phenotypes, whereas the absence seizure phenotype requires deletion before the end of the first postnatal week [24]. Celf4-deficient mice have additional neurological abnormalities including hyperactivity and hyperphagia-associated obesity [25]. Recently, a human CELF4 mutation was described with clinical neurological and behavioral features closely resembling those of Celf4 deficient mice, indicating that mammalian CELF4 is indeed an important regulator of neurological function [26].
CELF4 is expressed predominantly in excitatory neurons, with highest expression in pyramidal neurons of the hippocampus and the cerebral cortex. Celf4 deletion enhances excitatory but does not alter inhibitory neurotransmission, thereby leading to increased cortical excitability and seizures in Celf4 deficient mice [24]. An essential step in understanding the molecular mechanisms of CELF4 function in disease and in the normal state is to identify the mRNAs that CELF4 binds and regulates. Here, we used individual nucleotide resolution UV-crosslinking and immunoprecipitation (iCLIP) to identify an array of mRNAs directly bound by CELF4. We find that among the multitude of mRNAs bound by CELF4, a specific set of mRNAs encodes proteins highly enriched for function in synaptic neurotransmission, both postsynaptic and presynaptic. We also find that CELF4 preferentially binds these mRNAs in the 3′ untranslated region (3′ UTR) at a (U)GU motif that is generally known for CELF RBPs, and that CELF4 associates with large RNA granules, suggesting that it regulates neurotransmission by modulating stability, translation, and/or localization of these mRNAs. Although global changes of RNA transcripts were modest, significant shifts in RNA abundance between cell body and neuropil seen in Celf4 null mutants combined with immunostaining localizing CELF4 to neuronal projections further supports a role for CELF4 in mRNA regulation outside of the cell body, well into axons and dendrites of CELF4-expressing cells. Immunostaining also revealed significant changes in CELF4 targets in a subset of cell types (pyramidal excitatory cells) and cellular compartments (neuropil, this study; axon initial segment, W. Sun, J. Wagnon, C.L. Mahaffey, W. N. Frankel, unpublished results) that were consistent with elevated excitability in Celf4 mutants. Many CELF4 targets that are dysregulated are associated functionally with regulation of synaptic plasticity and of neurotransmission. Together, our results suggest that CELF4 has a central role in coordinating synaptic function in excitatory neurons.
Results
CELF4 binds mRNAs specifically in the 3′ untranslated region
We used iCLIP followed by high-throughput sequencing to isolate and identify RNAs bound by CELF4 in adult 129S1 mouse strain cerebral cortex and hippocampus [41] (Figure 1; File S1). Importantly, 129S1-Celf4 null mutant brain extracts were used as a negative control. Radiolabeling of the RNA co-immunoprecipitated with an anti-CELF4 antibody shows the generally high stringency and specificity of the reaction (Figure 1A). From wildtype brain we obtained a total of 20,124,340 CELF4 iCLIP sequencing reads that could be assigned to the individual experiments (File S1). Of these, 15,625,204 could be mapped as single hits to the genome corresponding to 12,250,800 unique protein-RNA crosslinking events (iCLIP tags) that cluster into 239,218 binding sites (Table 1, File S1). In comparison, from Celf4 null brain we obtained a total of 7,484,671 sequencing reads of which 5,328,472 had a single hit in the genome corresponding to 3,408,168 unique crosslinking events that cluster into 68,233 binding sites (File S1; Table 1). Crosslink events and clusters were strongly enriched in 3′ UTRs when CELF4 was purified from wildtype brain (Figure 1B; Table 1). Overall the binding results were reproducible, as indicated by stronger gene-by-gene correlation within each of four genotype replicates than between genotypes (File S1). To determine the occupancy of CELF4 at each binding site, we normalized crosslink counts at each site using an independent brain RNAseq dataset from the same mouse strain [ENA:ERP000614]. By using DREME software [42], comparing the clusters identified in wildtype with those identified in Celf4 null, we identified (A/U)UGU as the favored binding motif (Figure 1C). These results provide in vivo support for past structural and CLIP studies of CELF1, indicating that different CELF family members recognize a very similar sequence element in vivo [43], [44], [45]. Interestingly, despite the very high enrichment in wildtype, in the Celf4 null samples there was a small amount of enrichment for 3′ UTR binding (Figure 1B) and a slight preference for similar UG-rich motifs as evidenced by pentamer analysis (File S1), raising the possibility that the CELF4 antibody used for immunoprecipitation has a small amount of cross-reactivity with another CELF orthologue, as suggested previously [24].


CELF4 target mRNAs comprise 15%–20% of the transcriptome and are highly enriched for synaptic functions
We first defined a maximum dataset (from RNAseq data to be used later) comprised of 14,288 genes that had 10 or more normalized reads in wildtype samples (File S2). To assess the potential of each gene as a CELF4-binding target, we ranked the genes by the CELF4 occupancy at the crosslink cluster with highest cDNA count in the wildtype dataset, after subtracting from it the highest cluster occupancy in the same gene in the Celf4 null datasets. To initially assess any evidence for common functions in this rank-ordered list, we compared the gene ontology (GO) clustering of the top-ranking 500 genes (i.e. most likely CELF4 mRNA targets) with the bottom-ranked genes (least likely targets). The difference between these two groups was striking. For example, in the GO class “biological process”, the seven most significant GO categories for the top-ranked 500 targets showed high enrichment, with p-values of between 2×10⁻¹⁰ and 2×10⁻¹³. All but one GO category was neuron specific or related to ion transport. We noted that the next 500 highest ranked genes in the list also showed significant and specific clustering (data not shown). For the bottom-ranking CELF4 targets, no GO category had a p value lower than 2×10⁻⁹, and the lowest for any neurological-specific process was 1×10⁻² (Figure 2A, File S3).

Because of the very strong GO category clustering of the top-ranking genes, we could use functional annotation clustering to infer a threshold for functionally relevant binding from the ranked list of CELF4 targets. This was accomplished using the DAVID analysis tool [46], [47] by “walking” down the target ranking in groups of approximately 350 genes using identical clustering criteria in each step. For this, we examined two quantitative measures: the total number of annotated clusters, and the minimum p-value for any category in each query group. Cumulative values were plotted against the CELF4 iCLIP ranking, and inflection points (i.e. where each line starts to “flatten”) were noted, indicating a putative threshold (Figure 2B-left, solid lines). As a control, the ranked list was permuted randomly 50 times, each replicate re-grouped, and average values plotted (Figure 2B-top, stippled lines). There were clear differences in the Y-intercepts and slope in the experimental sample compared with random – best illustrated by an approximate 300-cluster increase in Y-intercept, and a precipitous flattening of the minimum p value. Together, these two indicators suggested that the threshold for CELF4 target is nominally 2,000 genes (arrow), or almost 15% of 14,288 transcripts in the dataset.
CELF4 is expressed predominantly in excitatory neurons [24], but the entire cerebral cortex and hippocampus tissue extracts used for iCLIP are comprised of a heterogeneous mixture of cells. Recently a transcriptome study was done for rat hippocampus, whereby a series of filters was applied in silico to the experimental data to obtain a putative transcriptome for the synaptic region of a typical rodent hippocampal CA1 pyramidal neuron [48]. Although this list lacks CELF4 targets that are expressed extrasynaptically, and the CA3 region has higher CELF4 expression [24], [49], we applied this transcriptome as a filter to our iCLIP list and performed a similar analysis as above. The results were very similar to those obtained from the larger, unfiltered group (Figure 2B-bottom). A notable downward inflection in cumulative annotation clusters coinciding with a very sharp flattening in the p-value (arrows) together suggest that CELF4 binds around 650 of the putative CA1-specific transcripts, or about 20% of the CA1 transcriptome, which is slightly more than predicted by the unfiltered set.
Because of the potential importance of estimating a binding threshold and thus a set of genes for further analysis, we sought an independent approach. Previously it was noted that several transcripts had reduced abundance in the brain of Celf4 null mutant mice [25]. Three of these are highly-ranked CELF4 targets: Htr2c (rank #64), Snca (#122) and Nsf (#374). Reasoning that altered gene expression of some or many of its targets may be a common feature of CELF4 deficiency, we then compared genotype-dependent changes in transcript expression against the CELF4 iCLIP ranking. A custom microarray of Celf4 null and wildtype whole brain mRNA was done and differential expression was plotted against the CELF4 iCLIP ranked groups (Figure 2C). Similar to the results from functional annotation clustering, the experimental curves for differential gene expression had a steeper rise followed by more rapid diminution when compared to randomly permuted data - this was evident for all 12,016 positively expressed genes in this array, and was particularly notable in the putative CA1 transcriptome subset (Figure 2C-right). The apparent threshold was remarkably similar to that obtained from functional annotation clustering.
In summary, although there is no a priori way to directly define the threshold for significant in vivo binding in iCLIP experiments, two independent measures—functional annotation clustering, and altered transcript abundance—suggest that CELF4 directly regulates at least 2,000 mRNA targets, corresponding to a large fraction of the excitatory neuron transcriptome.
CELF4 co-sediments with very large RNA granules and is present in neuronal soma and dendrites
The enrichment of CELF4 binding in the 3′ UTR suggests a role in control of translation, stability, and/or localization. Cytoplasmic ribonucleotide-protein complexes (RNPs), including translating polyribosomes and very large neuronal RNA granules (processing bodies, stress granules, and transport granules harboring translationally silenced particles) control the fate of mRNAs in response to a cell's needs [14], [50], [51], [52]. These very large granules can be distinguished from polyribosomes by using sucrose density gradient fractionation, referred to henceforth as polysome fractionation [52], [53], [54]. To assess the fate of CELF4-bound mRNAs upon CELF4 loss, we performed polysome fractionation on cortical brain lysates from 4-week old wildtype and Celf4 null mice to separate translating polyribosomes from large RNA granules and examined CELF4 distribution in individual fractions by immunoblotting. Even though CELF4 was found in all fractions, it was particularly prominent in the very high density RNA granule fraction pool (Figure 3A). This presence was independent of ribosomes, as indicated by the inability of EDTA to release CELF4 from the granular fractions (Figure 3B). This result stands in contrast to other RBPs, such as FMRP, that interact directly with ribosomes and shift upon EDTA treatment [55], [56]. Treatment of polysomes with RNase A, however, destabilized RNA granules, causing a corresponding loss of CELF4 from the very high density fractions (Figure 3C).

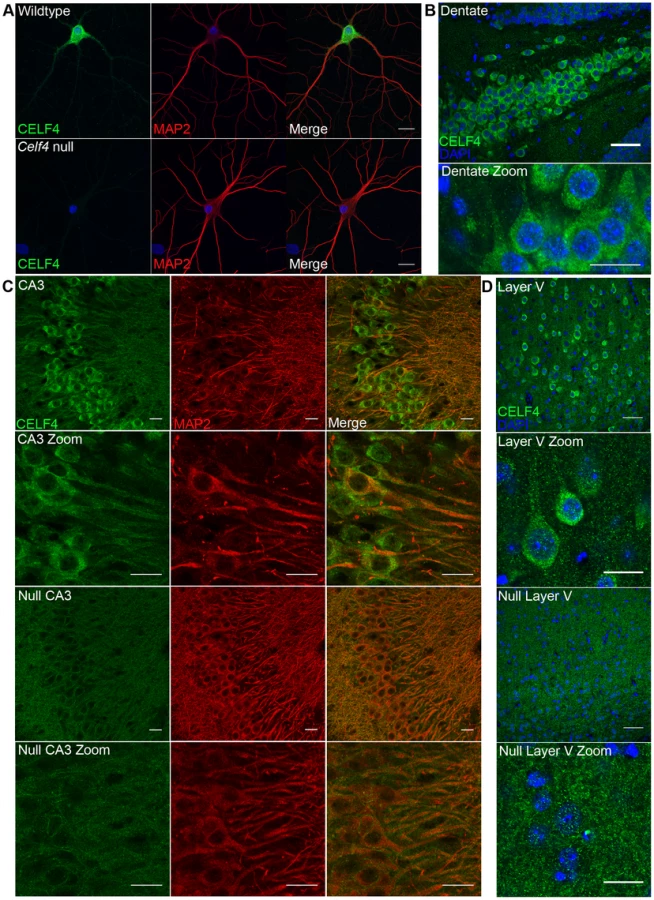
In addition to the cytoplasm of the soma, RNA granules might exert their activity in neuronal projections, where large RNA granules have been shown to fulfill roles in mRNA transport and localized translation [14]. CELF4 expression was previously found strongest in the soma of excitatory neurons [24], but those studies lacked resolution to determine whether it was also in dendrites or axons of individual neurons. By immunostaining we detected CELF4 in the soma, with a predominant cytoplasmic pattern, as well as in proximal processes of dissociated hippocampal neurons (Figure 4A). In the projections, punctate immunostaining for CELF4 was visible (Figure 4A). Similarly, in mouse brain, where the antibody reacted specifically with CELF4 as evidenced by immunostaining of cerebral cortex and hippocampal CA3 in wildtype but not Celf4 null mutants (Figure 4B–4D), CELF4 was present in the cell bodies and proximal processes of the dentate gyrus (Figure 4B), hippocampal region CA3 (Figure 4C), and cortical layer V pyramidal cells (Figure 4D). In the hippocampus, CELF4-immunopositive projections extended visibly into the neuropil (Figure 4C). However, CELF4 is probably not present at the nerve terminal itself, as evidenced by its absence from synaptosome fractions (Figure S1). Together with previously published data, these new findings suggest that CELF4 exerts its role in posttranscriptional regulation of RNAs at multiple sites throughout the excitatory neuron
CELF4 deficiency affects the abundance and distribution of its target RNAs
Next, we studied the fate of CELF4 target transcripts in CELF4 deficient mice. First, a custom microarray was used to simultaneously examine alterations in steady-state mRNA abundance and alternative splicing in Celf4 null compared to wildtype adult brain. Investigating the alternative splicing defects is of interest since both CELF1 and CELF2 are involved in splicing and at least one prior study suggested that CELF4 might be as well [28]. However, consistent with the strong enrichment of CELF4 binding in 3′ UTR regions, we found very little evidence for a significant role of CELF4 in splicing, since we were able to validate small splicing changes in only five genes: Ank2, Cacna2d2, Cadps, Grm5 and Ppp3ca (data not shown). In contrast, at the full transcript level, 628 (5.2%) of 12,016 genes did show a highly significant difference in expression, using an experiment-wise significance threshold of p<0.05 (File S4). 144 (23%) of these were among the top 2,000 CELF4 targets identified by iCLIP (File S4). The expression changes, however, were of a modest nature with the maximum difference corresponding to a 40% change, consistent with results reported previously for genes now known to be CELF4 targets [25]. Although more than half of these CELF4 targets showed evidence for increased expression in Celf4 null brain (84 vs. 60 with decreased expression, respectively), the average fold change was significantly greater for targets with decreased expression (p<0.001, t-test). It is likely, however, that many more than these 144 CELF4 targets actually show “real” expression differences, when compared with the rest of the transcriptome. For example, there was still a significant difference in the average differential expression between the remaining top priority CELF4 targets and the remaining 9739 genes on the microarray (p = 0.0008, t-test), with again, a tendency for them to be expressed at lower levels in Celf4 null mutant (p<0.001, t-test).
Validation of CELF4 target gene expression changes in Celf4 null mice
We next sampled steady-state expression of 25 CELF4 targets each in cerebral cortex and hippocampus by quantitative real-time RT-PCR (qPCR) in biological triplicate, including representative targets that either were increased or decreased in the Celf4 null brain microarray, were high ranking iCLIP targets, whose expression was examined previously in Celf4 mutants [25] or that are associated with synaptic regulatory functions based on findings described below. The qPCR results generally correlated with the microarray (Figure 5A-cortex; Figure 5B-hippocampus), and with one exception (Scamp1), for 9 targets that were examined in both tissues the relative trend was the same. Previously, steady-state, whole cell protein expression was examined by immunoblot and it correlated well with RNA for four genes that we know now are targets (Htr2c, Nsf, Syn2, Snca [25]). Because we know now from the comprehensive iCLIP screen that many CELF4 targets encode proteins that function in neuronal projections, for a few targets we compared whole cell protein expression (by western blot) with subcellular expression in hippocampus where it is relatively easy to distinguish soma from neuronal projections by immunostaining. Whole cell expression changes were modest, but trended towards downregulation consistent with the mRNA levels (Figure 6A and 6B). Subcellularly, some targets such as NNAT and STXBP1 followed this trend and were lower in cell body and neuropil, respectively (Figure 6C–6E). Interestingly, however, for two CELF4 targets, SYNJ1 and CAMK2A, that could be evaluated in both cell body and neuropil, protein levels were significantly increased specifically in neuropil (Figure 6E). Altogether while these and previous mRNA and protein studies confirm that CELF4 loss does result in altered abundance of many targets with a general trend towards downregulation at the whole cell level, some targets appear to exhibit pronounced differences in relative abundance between cell body and neuronal projections.


Celf4 genotype-dependent shifts of CELF4 targets in polysome fractions and in the cell body-neuropil axis
To more systematically study the fate of CELF4 targets at the subcellular level, we examined their distribution a) between hippocampal cell body and neuropil and b) among polysome fractions by using RNAseq, comparing Celf4 null mice to wildtype for each experimental treatment. First, we prepared polysomes from cerebral cortex and hippocampus and pooled individual fractions into three groups: monosomes (low density), polysomes (moderate-heavy density), and very large RNP and RNA granules (very high density). This was done to allow for two comparisons of transcript content potentially relevant to CELF4 function: monosomes vs. polysomes, and RNA granules vs. monosomes/polysomes. Second, to examine whether there was evidence for a genotype-dependent shift in the subcellular distribution of CELF4 targets we chose the CA1 region of the hippocampus because of the relative ease with which its cell bodies and neuropil can be dissected. The polysome-fractionated and the CA1-derived mRNA were subjected to high-throughput sequencing followed by reference genome alignment and data normalization. For the analysis of the dependence of mRNA levels on Celf4 genotype, we first obtained F-statistics for genotype-by-treatment interaction in linear models by analyzing an ANOVA of ranked, normal quantile-transformed data (File S5 for the whole dataset; File S6 for the putative CA1 transcriptome subset). In a follow-up analysis, we examined the relationship between expression and CELF4 iCLIP ranking (Table 2). Although genotype-dependent transcript abundance between RNA granule vs. monosome plus polysome together had no apparent correlation with CELF4 target status (F, 2.18; ns), a highly significant correlation was seen for monosomes vs. polysomes (F, 24.29; p<0.0001), and for CA1 cell body vs. neuropil (F, 12.46; p<0.001). Similar results were obtained regardless of whether we used the entire dataset, or after filtering for the putative CA1 transcriptome (Table 2). The relationships between CELF4 target ranking and Celf4-dependent transcript abundance for each model are visualized in Figure 7, where the entire interaction space is depicted by a square containing individual genes (dots), density contouring emphasizes where CELF4 target ranking is associated with differential abundance, and the highest ranking (top 2,000) CELF4 targets are unmasked, with high and low abundance changes separated by a dashed line. These results show that in the dissection experiment especially, much of the signal comes from the highest-ranked CELF4 targets.


Functional annotation clustering reveals a selective shift of CELF4 targets in the neuropil of CELF4-deficient neurons
To explore how CELF4 targets drive these highly significant genotype-dependent interactions, we examined functional clustering of “GO biological process” categories, by comparing CELF4 targets that had the most significant differential abundance scores (as Δ log p) to those with the lowest, as divided along the interaction F-statistic median (i.e. dashed line in Figure 7). For monosomes vs. polysomes, there was an overwhelmingly higher degree of clustering among CELF4 targets with the most differential abundance (Figure 8-left; all results may be found in File S7). “GO biological process” terms were dominated by only highly significant neurological clusters including “synaptic transmission”, “neurogenesis” and other broad aspects of neuronal or synaptic function (Figure 8-top left). Similarly, monosomes vs. polysomes by “GO cell compartment” terms also revealed very significant differential scores, led by “neuron projection” and “synapse part” but covering all parts of the neuron (Figure 8-bottom left). In stark contrast, however, the CA1 cell body vs. neuropil experiment gave a different set of results. Most of the functional clustering was associated with CELF4 targets that had the least amount of differential abundance between cell body and neuropil (Figure 8-right). Thus, while generally the same GO categories showed the most significant clustering, all but two “GO biological process” terms (“regulation of synaptic plasticity” and “cell adhesion”) and only one of the top “GO cell compartment” terms (“synapse part”) exhibited more clustering among differentially abundant CELF4 targets.

Together these results reveal a model whereby CELF4 regulates a large number of genes involved in neuronal function across the cell, by limiting the degree to which transcripts are available for translation. Furthermore, a subset of CELF4 targets that are differentially abundant between cell body and neuropil are implicated in synapse-specific processes, led by the GO category “regulation of synaptic plasticity” and including “regulation of synaptic transmission.”
We then extracted the 142 gene annotations from the three proxy GO categories most enriched for differentially abundant CELF4 targets (“regulation of synaptic plasticity” and “synapse part” —82 genes total; “cell adhesion” —60 genes), in order to examine the direction of their effects and to begin to draw inferences about mechanisms that CELF4 regulates at the synapse (Figure 9, Table 3). For this, we reclassified the 142 genes as being associated with a variety of subcellular localization and molecular function GO categories. For each category we examined the relative abundance and the direction of effect between Celf4 null and wildtype genotypes in the two experiments (monosomes vs. polysomes, and cell body vs. neuropil) by using contingency table analysis (Fisher Exact test p). We also compared effects between experiments (by comparing Δ log p). For categories that changed the most in Celf4 null mice, the tendency was toward higher abundance in polysomes compared with monosomes, and in neuropil compared to cell body (all data from all categories can be found in File S8). Figure 9 summarizes the results, showing the three proxy categories (stippled bars), and the most significant subcategories (solid bars) by molecular function (top panel) and subcellular localization (bottom panel). All but one category showed a more negative log p ratio, indicating that in Celf4 null mice these transcripts were more abundant in neuropil than in the cell body. For the most significantly altered CELF4 targets, directions of effect were visualized in Table 3.

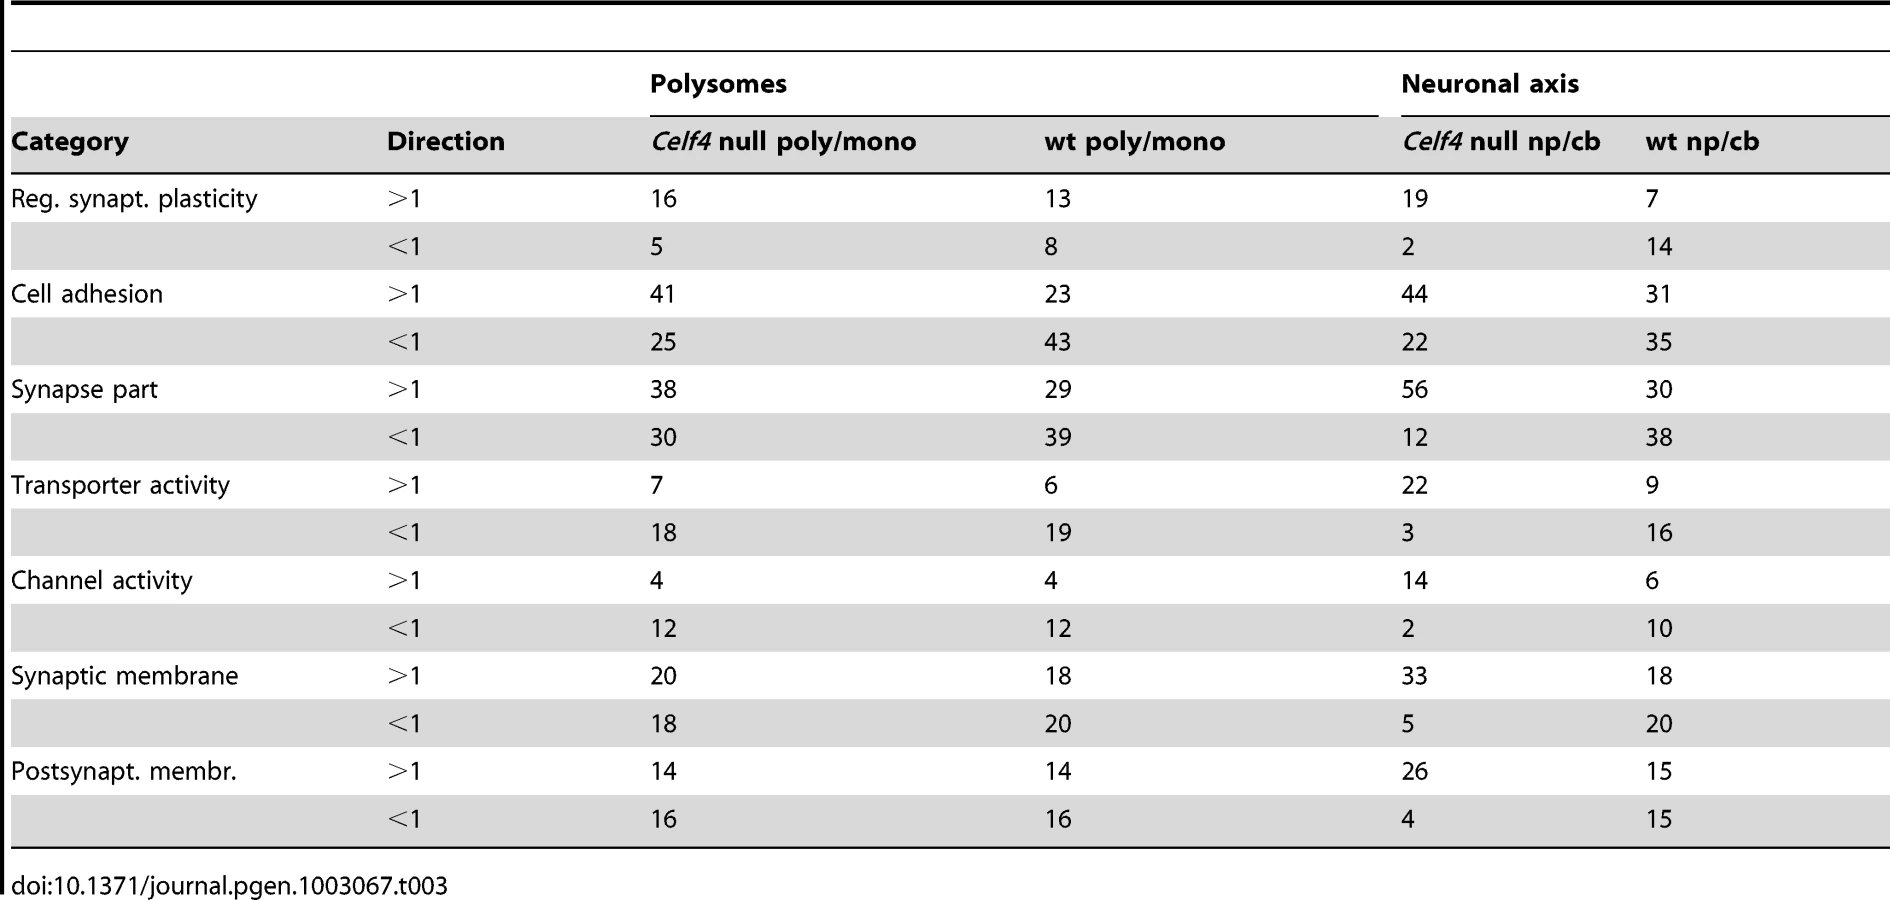
Molecular function categories reveal that most CELF4-regulated activity at the synapse is in membrane-associated proteins, including transporters and ion channels (Figure 9A). Assessment of subcellular localization categories (Figure 9B) suggests that most CELF4-regulated activity is at the synapse itself, although a fairly even trailing of other categories belies the possibility that CELF4 regulates a wide variety of molecules in many aspects of synaptic transmission. Indeed, while other, more specific categories may be revealing (e.g. “glutamate receptor activity”) the sample sizes for these were often too small to draw strong inference. However, the power of this type of analysis will only be enhanced as more experimental evidence accumulates for the functions of these genes.
In summary, while CELF4 deficiency results in widespread but modest differential steady state expression of its targets, with a significant shift towards polysomes, a subset implicated in regulation of synaptic plasticity and transmission increases in abundance and shifts towards polysomes in the neuropil.
Discussion
In either the null or haploinsufficient genetic state, CELF4 deficiency in mice causes a complex neurological syndrome with epileptic seizures as a prominent feature but which also includes hyperactivity and obesity in aging males [24], [25]. It is known that CELF4 is at the center of human del(18q) syndrome interval (discussed in [26]), where it is one of several genes that could be the cause of neurological symptoms of these patients, including seizures. Consistent with the murine phenotypes, a patient was described very recently with many of these features (seizures, borderline intelligence, behavioral disabilities and obesity) carrying a translocation that specifically disrupts the CELF4 gene, thus directly implicating CELF4 in several key features of del(18q) disease. It is not yet known whether more subtle CELF4 variants are associated with more common synaptic diseases, such as idiopathic epilepsy, ASD and various other non-degenerative neurological conditions, but with the increasingly popular applications of high throughput DNA sequencing it seems likely that this question will be answered before too long.
To understand the functions of CELF4 in vivo, we used iCLIP to identify CELF4-bound mRNAs. The main finding of this aspect of the study is that CELF4 regulates translation and local abundance of a vast set of mRNAs, and its primary role is not in regulation of alternative splicing as was proposed from earlier in vitro studies [28]. Several lines of evidence strongly support this claim: (i) CELF4 binds specifically within the 3′ UTR known to harbor elements for translational control and localization, and via a binding motif that is similar to that of other CELFs, (ii) using a splicing microarray only very minor splicing defects in a small number of genes were detected, (iii) CELF4 co-sediments with very high density RNP particles, (iv) CELF4 is located in the cytoplasm of the soma as well as in neuronal projections, and (v) compared to the splicing annotation differences between genotypes which were minimal, considerably more alterations were detected in Celf4 null mutants when assessing the distribution of mRNAs between mono - and polysomes, and between cell bodies and neuropil.
We took a novel approach towards estimating the number of true CELF4 binding targets from iCLIP. First, we established a baseline of background binding by using extracts from both wildtype and Celf4 null mice, and observed the very strong specificity for the 3′ UTR. After deriving a ranked list of targets by considering site occupancy and background, we observed both striking functional annotation clustering as well as a broad effect of Celf4 genotype on steady-state expression among the highest ranking targets when compared with the lowest ranking targets. We then exploited these two external measures of function—gene ontology annotation clustering and expression change—as indices to infer biological “meaning” from the ranking, by walking-down the list from highest to lowest ranked targets, and determining the inflections where the rate of clustering (or gene expression change) began to diminish. Data permutation assured that these inflections were not random. From a set of over 12,000 transcripts corresponding to many cell types (e.g. from whole brain extracts), including many excitatory neurons most of which express CELF4, or over 3,000 genes for a less heterogeneous source (by applying a recently proposed CA1 neuron transcriptome as a filter [48]), this threshold corresponds to somewhere between 15% and 20% of the transcriptome. For most of our analysis, we took the top 2,000 ranked targets as a nominal threshold for defining the CELF4 regulome, although this may be conservative as many lower ranking genes are also likely to be targets. We do not know enough yet about the relationship between the number of binding sites or affinity, and biological outcome to be any surer.
In our study, the identification of these numerous mRNA targets combined with the detection of changes in expression, translation and localization of mRNAs in Celf4 null mutants all serve to underscore the notion that alterations of many different molecular pathways contribute to complex neurological diseases. Merely considering seizures as a phenotype, from our current and previous studies we can now infer that normal CELF4 regulation of its mRNA targets is important for early postnatal development, else absence seizures may arise, and also during adulthood, whence somatic CELF4 deletion is sufficient to cause seizures even after normal development [24]. Thus, although for this study we focused on the role of CELF4 in regulating molecules associated with function at the synapse, by extension the myriad of other properties of CELF4 targets (as suggested by functional annotation clustering) implies that CELF4 very likely is involved in coordinating a wide spectrum of neuronal functions.
With a set of targets that cover many different aspects of synaptic function, together with seizures as the major phenotype of Celf4 deficient mice, we suspected that a general function of CELF4 might be as a regulator of the synaptic response in excitatory neurons, i.e. where it is predominantly expressed. Regulation of homeostatic plasticity and synaptic scaling is emerging as a theme for neurological disorders, including synaptic excitation [57], and it is a plausible major component for genetically complex neurological diseases like epilepsy or autism, as disruptions in regulating homeostasis would be expected to lower the threshold for other insults—genetic or environmental—leading to wider dysregulation at the circuit level. It will be very interesting in future experiments to examine whether CELF4 is involved in homeostasis or in other forms of synaptic plasticity, such as LTP.
In a single genetic model, Celf4 mutants provide a means to evaluate both an instigating insult and a general inability to respond to it. Thus, in a companion study (W. Sun, J. Wagnon, C.L. Mahaffey, W. N. Frankel, unpublished results), using primarily an electrophysiological approach supported by genetics, we determined that a relatively modest increase in the amount of the sodium channel Nav1.6 (encoded by Scn8a) observed in the axon initial segment where Nav1.6 initiates action potentials in excitatory neurons [58], [59], [60], leads to a marked upregulation of persistent sodium current and intrinsic excitability of cortical layer V pyramidal neurons. Merely reducing the dosage of wildtype Scn8a by half completely blocks the effect of Celf4 deficiency on seizure threshold, betraying the very dominant role that Nav1.6 has in the excitatory response. Importantly, since CELF4 is expressed only in a few inhibitory neurons [24], its effect on Nav1.6 would be mainly in excitatory neurons without increasing the excitability of inhibitory circuits. Even in this condition, it is possible that a modest increase in Nav1.6 might normally be tolerated, but combined with an impaired regulatory response as implied by our genomic studies, Celf4 mutant excitatory activity would be out of control – hence recurrent seizures.
In accord with our finding that CELF4 is involved in localization and translational regulation of mRNAs, we found it to co-sediment with large RNA granules. Thus, our observations are consistent with a molecular mechanism for CELF4 that is analogous to that described for the CELF orthologue Bruno in the regulation of its target transcript oskar, which requires spatially restricted expression in the Drosophila ovary epithelium. Bruno mediates translational repression of oskar mRNA by binding in the 3′ UTR and either interacting with eukaryotic initiation factor 4E (eIF4E) and the 4E-binding protein Cup (eIF4ENIF1) to inhibit cap-dependent translation [61], [62] or by forming a very large RNP, or “silencing particle”, containing oskar mRNA oligomers that is inaccessible to translation machinery [61]. Spatially restricted gene expression is also a critical process in neurons as lasting activity-dependent synaptic plasticity requires rapid, local protein synthesis in neuronal projections in response to synaptic stimuli [14]. In neuronal projections, mRNAs populate different types of RNA granules, large RNPs that include transport granules, translating polysomes, stress granules, and processing bodies [14], [50], [51], [63]. Our results indicate that CELF4 is part of a novel large RNP particle of as yet unknown composition. Going forward, it will be important to dissect its components and investigate whether CELF4 participates in mRNA oligomerization into silencing particles similar to those formed by Bruno. It is not, however, a straightforward leap from Drosophila ovary to the mammalian nervous system. For example, expression of eIF4ENIF1, the orthologue of the Bruno-interacting protein Cup, is low in the mammalian brain. It is also likely that CELF4 and its bound mRNAs will dynamically interact with other types of RNPs in response to synaptic signaling. Given that CELF4 binds a subset of mRNAs highly enriched for synaptic function, insights into the CELF4 RNP should expand our current understanding of neuronal RNA granules and local regulation of RNA translation in excitatory neurons.
The RNA-binding proteins (RBPs) that form RNA granules are emerging as causal agents of disease in complex neurological and neuropsychiatric disorders, such as epilepsy, ASD, schizophrenia and ID. The high incidence of comorbidity between these conditions suggests that common pathological mechanisms underlie these disorders, and many recent studies indicate synaptic dysfunction, including abnormal synaptic protein levels, defects in synapse formation, and impaired synaptic homeostasis, as a unifying component [14], [64], [65], [66]. For example, FMRP regulates activity-dependent translation in dendrites by stabilizing mRNAs at synapses for local protein synthesis [67], [68]. FMRP loss leads to dysregulation of local RNA translation, aberrations in dendritic spine morphology, and altered neuronal excitability that increases seizure susceptibility [69], [70]. Recently, the subset of RNAs bound by FMRP was identified, and it included many molecules related to synaptic function and linked to autism [55], [71]. When cross-referenced to the curated list of potential ASD candidate genes in AutDB [72], 17% of the candidate autism genes are represented in the FMRP-bound set. Although CELF4 shares approximately 30% of its RNA targets with FMRP, a much higher percentage of autism candidate genes, over 30%, are represented in the CELF4-bound set. For the 142 CELF4 targets that show the most differential expression between cell body and neuropil, approximately 13% are found in AutDB (representing ∼5.6% of candidate genes). Therefore, it is reasonable to suspect that variants in human CELF4 could contribute not only to epilepsy, but also—and maybe more so—to ASD and ID, which is corroborated by the spectrum of symptoms seen in del(18q) syndrome and specifically in the recent patient with the CELF4 translocation [26].
Methods
Animal care, procedures, and genotyping
All animals were fed standard National Institutes of Health diet containing 6% fat and acidified water ad libitum. All animal procedures followed Association for Assessment and Accreditation of Laboratory Animal Care guidelines and were approved by institutional Animal Care and Use Committee. For all experiments described in this paper, wildtype and Celf4 mutant mice were analyzed on an isogenic 129/SvImJ (129S1) strain background. Celf4 genotyping was performed as previously described [24].
Splice-junction microarray
Three biological replicates of wildtype and Celf4 null brain were collected from postnatal day 6 mice. The high-resolution AltSplice microarrays were produced by Affymetrix (Santa Clara, CA, SA), the cDNA samples were prepared using the GeneChip WT cDNA Synthesis and Amplification kit (Affymetrix 900673), followed by GeneChip Hybridization, Wash, and Stain Kit (Affymetrix 900720) using Affymetrix GeneChip Fluidics Station 450 and scanned on Affymetrix GeneChip Scanner 3000 7G. The resulting cel files were analysed with the version 3 of ASPIRE [73]. For examination of splicing, the fold change in gene expression was determined by comparing the average transcript abundance in the three biological replicates of wildtype and Celf4 null brain, and the p-value was determined using Student's t-test (paired, unequal variance). For examination of transcript-level expression, we fit and tested analysis of variance models using J/Maanova (http://churchill.jax.org/software/jmaanova.shtml).
iCLIP
Whole brain dissected from two Celf4 null and three wildtype mice aged 6 weeks was split into left and right hemispheres and then dissociated in PBS, UV-crosslinked and collected by centrifugation. The iCLIP method was done as previously described [41]. Briefly, crosslinked brain tissue was dissociated in lysis buffer, sonicated and subjected to partial RNase I digestion (final dilution 1∶100,000). CELF4 complexes were immunopurified with 0.9 µg anti-CELF4 polyclonal antibody (Sigma HPA037986, St. Louis, MO) conjugated to 100 µl protein A Dynabeads (Invitrogen, Carlsbad, CA, USA). While being immobilized on the beads, RNAs bound to CELF4 were dephosphorylated at their 3′ end followed by ligation of the DNA linker 5′-rAppAGATCGGAAGAGCGGTTCAG/ddC/-3′. After 5′ end radiolabeling, crosslinked CELF4-RNA complexes were size-separated by SDS-PAGE and transferred onto nitrocellulose membrane. The regions corresponding to 60–200 kDa on the autoradiogram were excised from the nitrocellulose and bound RNAs were released by proteinase K treatment. RNAs were reverse-transcribed (File S1) and cDNAs were size-selected from a 6% TBE-urea gel (Invitrogen). Purified cDNAs were circularized, linearized by restriction digestion and PCR amplified.
High-throughput sequencing and analysis of iCLIP data
High-throughput sequencing of iCLIP cDNA libraries was performed on an Illumina GA-IIx (run length 54 nt). The iCLIP libraries contained a 4-nt experimental barcodes plus a 5-nt random barcode, which allowed multiplexing and the removal of PCR duplicates, respectively (File S1). All genomic analyses were performed using the mouse genome version mm9/NCBI37 with annotations taken from Ensembl (version 60). The iCLIP data were mapped using Bowtie [74] and randomers were evaluated as described previously [73]. For assessing the genomic distribution of iCLIP crosslink nucleotides, we used the following hierarchy: ncRNA>3′ UTR>5′ UTR>exon>intron>antisense>intergenic, as defined by Ensembl 59 (Figure 1C). Identification of significantly clustered crosslink sites was described earlier [75]. After defining the clusters, we used the cDNA count at each crosslink site in the cluster to identify the position that represents the centre of mass. We then extended this position by 15 nts on each side to generate 31 nucleotide windows, which were used to determine the occupancy at each crosslink cluster. Sum of cDNA counts in each window was divided by the total DNA count of the iCLIP library. Occupancy in windows was then determined by further dividing by the RNAseq FPKM value of the gene containing the window. FPKM was calculated by mapping ERR033018 and ERR033019 datasets [ENA:ERP000614] using TopHat in a way where each read from the paired-end sequencing was mapped separately, and the FPKM was then calculated from pooled data using Cufflinks. iCLIP binding motif analysis was done as described previously [75], except that the range of binding positions was extended to 10 nt and 30 nt in each direction. The z-score was calculated for each pentamer as: (occurrence in iCLIP sequences – average occurrence in randomized control sequences)/standard deviation of occurrence in randomized control sequences. DREME software [42] was then used identify the motif that was most highly enriched in wildtype brain compared with Celf4 null brain.
Analysis of polysome distribution and mRNA localization
For material from polysome fractions and dissected hippocampus, The Jackson Laboratory Gene Expression Service prepared mRNA sequencing libraries using the Illumina TruSeq methodology. RNA was extracted using TRIzol (Invitrogen, CA). For mRNA-Seq, mRNA was purified from total RNA using biotin tagged poly dT oligonucleotides and streptavidin coated magnetic beads followed by QC using an Agilent Technologies 2100 Bioanalyzer (Agilent Technologies, Santa Clara, CA, USA). The mRNA was then fragmented and double stranded cDNA was generated by random priming. The ends of the fragmented DNA were converted into phosphorylated blunt ends. An ‘A’ base was added to the 3′ ends. Illumina-specific adaptors were ligated to the DNA fragments. Using magnetic bead technology, the ligated fragments were size selected and then a final PCR was performed to enrich the adapter-modified DNA fragments since only the DNA fragments with adaptors at both ends will amplify. The sequencing library was first validated using an Agilent Technologies 2100 Bioanalyzer to characterize DNA fragment sizes and concentration. The concentration of DNA fragments with the correct adapters on both sides was then determined using a quantitative PCR strategy, following the kit manufacturer's protocol (Kapa Biosystem, Cambridge, MA). Following library quantitation, libraries were diluted and pooled as necessary. Using the Illumina cBot, libraries were added to the flow cells and clusters were generated prior to 100 bp paired end sequencing on the Illumina HiSeq 2000 (Illumina, San Diego, CA, USA). During and after the sequencing run, sequence quality was monitored using the real time analysis (RTA) and sequence analysis viewer (SAV) softwares available by Illumina. Following sequencing, demultiplexed fastQ files were generated using the Illumina CASAVA software.
FastQ files were aligned to the C57BL/6J reference genome on a high performance computing cluster using Tophat (http://tophat.cbcb.umd.edu/) for the alignment and Cufflinks (http://cufflinks.cbcb.umd.edu/) for isoform assembly and quantitation, except that frequency of reads per kilobase was normalized based on quartile instead of the total number of mapped reads. Differential expression analysis for microarray data was done using J/Maanova (http://churchill.jax.org/software/jmaanova.shtml) and for RNAseq using the R stats package (www.R-project.org), including linear models, ANOVA and permutation shuffling. Further analysis was done using JMP (SAS Institute, Inc.) or Microsoft Excel (Microsoft Corp). The analysis workflows for RNAseq differential expression analyses and sample R-scripts are summarized in File S10.
Hippocampal CA1 dissection
Four-week old mice were euthanized by cervical dislocation. Brains were quickly removed and transferred into ice-cold solution containing: 210 mM sucrose, 3 mM KCl, 1 mM CaCl2, 3 mM MgSO4, 1 mM NaH2PO4, 26 mM NaHCO3, 10 mM glucose, saturated with 95% O2 and 5% CO2. Coronal slices were cut at 300 µm on a vibrating microtome (VT 1200, Leica Microsystems, Germany). A patch pipette was used to dissect either cell bodies from CA1 stratum pyramidale or neuropil from CA1 stratum radiatum under a dissecting microscope (illustrated in Figure S2). Tissue was placed directly in TRIzol reagent (Invitrogen) and RNA was prepared as directed.
Polysome preparations
Four-week old mice were euthanized by cervical dislocation, the brain was rapidly removed from the skull and placed in 1.5 ml of ice-cold lysis buffer (20 mM Tris-HCl, pH 7.4, 3 mM MgCl2, 10 mM NaCl, 2% sucrose, 0.3% Triton X-100, 2 mM vanadyl ribonucleoside complexes [VRC] supplemented with protease inhibitors (complete mini, EDTA-free, Roche, Indianapolis, IN). From this point forward the material was kept on ice. The brains were homogenized in lysis buffer with 10 strokes of a mechanical dounce homogenizer. The homogenate was then centrifuged at 10,000 g for 10 minutes at 4°C, and the supernatant was removed to a fresh tube. The salt concentration of the supernatant was adjusted to 170 mM NaCl and 13 mM MgCl2. Where indicated, the lysate was treated with either 30 mM EDTA or 0.1 mg/ml RNase A for 30 minutes on ice. For EDTA treatment, VRC was not included in the lysis buffer. Lysates were then carefully layered onto 15–55% linear density gradients of sucrose in 25 mM Tris-HCl, pH 7.4, 25 mM NaCl, 5 mM MgCl2 and 30 mM EDTA where indicated. Gradients were ultracentrifuged in a Beckman Instruments (Fullerton, CA) SW40Ti rotor (Beckman Instruments, Fullerton, CA, USA) at 36,000 rpm for 2 hours and 25 minutes at 4°C. Fractions were collected in 1 ml increments with continuous monitoring at 254 nm using an ISCO detector. For RNA extraction, fractions were collected into 3 ml of 7.7 M guanidine-HCl, 4 ml of absolute ethanol was added, and samples were incubated overnight at −20°C. Samples were centrifuged at 4000 rpm in an Avanti JS5.3 rotor (Beckman Instruments, Fullerton, CA, USA) for 50 minutes at 4°C. The supernatant was removed and 400 µL DEPC-treated H2O was added to the pellet. The pellet was resuspended and moved to a microcentrifuge tube. To precipitate the RNA, 1 ml of absolute ethanol, 40 µL of 3 M sodium acetate, pH 5.2, and 20 µg glycogen were added, and the samples were incubated overnight at −20°C. The samples were then centrifuged at 14,000 g for 30 minutes at 4°C. Pellets were washed with ice-cold 75% ethanol and air dried for 15 minutes at room temperature. RNA was resuspended in 30 µL DEPC-treated H2O. For western blot analysis, the protein in each fraction was TCA-precipitated.
Antibodies
The following antibodies were used for immunoblotting and immunostaining, anti-Actin (1∶1,000, Abcam ab3280), anti-Camk2a (1∶400; Millipore NB12), anti-Celf4 (1∶200 for immunoblot, 1∶400 for immunostaining; Santa Cruz sc-84712), anti-Map2 (1∶10,000, Abcam ab5392), anti-Stxbp1 (1∶100; Abcam ab3451), anti-Nnat (1∶100; Abcam ab27266), anti-Synj1 (1∶100; Abcam ab19904).
Immunoblotting
For immunoblots of proteins isolated from polysome fractionation, proteins were separated by SDS-PAGE and transferred to nitrocellulose. Blots were blocked with 5% nonfat milk in TBST (TBS, 0.1% Tween-20), probed with anti-CELF4 antibody in 3% BSA/TBST overnight at 4°C, washed, and incubated with goat anti-rabbit peroxidase-conjugated secondary antibody (1∶15,000, Bio-Rad,; Hercules, CA, USA). Signal was detected by chemiluminescence with the ECL-prime kit (GE Healthcare). The blot was stripped with Restore stripping buffer (Thermo Scientific, Rockford, IL, USA) and reprobed with anti-S6 antibody in 5% milk/TBST overnight at 4°C, washed, incubated with goat anti-mouse peroxidase-conjugated secondary antibody (1∶15,000, Thermo Scientific, Rockford, IL, USA), and signal was detected with the ECL-prime kit (GE Healthcare).
For quantitative immunoblotting, cortical tissue or hippocampal tissue from wildtype and Celf4 null homozygous mice was homogenized in RIPA lysis buffer (150 mM NaCl, 50 mM Tris-HCl [pH 8], 1% NP-40, 0.5% sodium deoxycholate, 0.1% SDS) supplemented with protease inhibitors (complete mini, Roche) and phosphatase inhibitors (PhosSTOP, Roche) and incubated for 30 minutes at 4°C. The lysate was centrifuged at 4,500 g for 5 minutes at 4°C. Protein in the supernatant was quantified using the Direct Detect system (EMD Millipore). Proteins were separated by SDS-PAGE and transferred to nitrocellulose membranes. Membranes were blocked in 5% milk/TBST for one hour at room temperature then probed with primary antibodies diluted in 3% BSA/TBST for two hours at room temperature or overnight at 4°C. Membranes were then washed three times for five minutes each in TBST followed by incubation with horseradish peroxidase-conjugated secondary antibodies (goat anti-mouse or goat anti-rabbit, Bio-Rad) diluted in 5% milk/TBST for one hour at room temperature. Signal was detected with the ECL prime kit (GE Healthcare, Piscataway, NJ, USA) using the G:BOX Chemi XT4 system equipped with a Synoptics 4.2 MP cooled CCD camera (Syngene, Frederick, MD, USA). Accurate band sizes were ascertained by also visualizing ProSieve Color protein markers that had been present in the gel and transferred with the sample proteins (Lonza, Basel, Switzerland). Before reprobing, the blot was incubated in stripping buffer (62.5 mM Tris-HCl, 100 mM β-mercaptoethanol, 2% SDS, pH 6.7) at 50°C for 30 minutes, followed by two washes for ten minutes each in TBST. As a loading control, blots were probed with anti-actin antibody. For quantitation, images collected from the G:BOX were imported into ImageJ and optical densities (ODs) of the bands were measured. The OD of each sample was normalized to the OD of the corresponding actin band.
Immunostaining
Cryosections: Adult mice were anesthetized with a lethal dose of tribromoethanol and perfused with phosphate-buffered saline (PBS pH 7.4). Brains were removed from the skull, cut coronally, and frozen in O.C.T. (Tissue-–Tek, Torrance, CA). Then, 15 µm thick sections from the cortex were collected onto lysine-coated Colorfrost Plus slides (Fisher Scientific, Pittsburgh, PA, USA) and stored at −80°C. Slides were thawed and dried for 30 minutes at room temperature. Tissue sections were re-hydrated in PBS, fixed 10 minutes in 1% paraformaldehyde in PBS, rinsed three times in PBS, blocked in 0.3% Triton-X-100, 1% bovine serum albumin (BSA) and 10% normal goat serum (NGS) in PBS for 2 hours at room temperature, and incubated in primary antibodies diluted in 0.3% Triton-X-100, 1% BSA and 3% NGS in PBS for 2 days at 4°C. Sections were washed three times for 5 minutes each in PBST (PBS, 0.05% Tween-20) and incubated for 2 hours at room temperature in secondary antibody. The sections were washed as before, followed by a wash in PBS and incubated in DAPI diluted in PBS for 5 minutes. The sections were mounted in Prolong Gold antifade reagent (P36930; Invitrogen). The following secondary antibodies were used to visualize the immunoreactions: AlexaFluor 488-conjugated goat anti-mouse (1∶1000; Invitrogen A11017) and AlexaFluor 555-conjugated goat anti-rabbit (1∶1000; Invitrogen A21430).
Free-floating sections: Adult mice were deeply anesthetized and perfused with PBS, followed by 4% paraformaldehyde in PBS. Brains were removed from the skull, post-fixed overnight in the same fixative (4°C), rinsed in PBS, cut sagitally and sectioned at 50 µm on a vibrating blade microtome. When antigen retrieval was necessary the tissue sections were first treated with 0.2 mg/ml pepsin (Sigma P6887) in 0.2 M HCl at 37°C for 10 minutes and washed 3 times in PBS at room temperature. Then sections were incubated in a blocking buffer of 0.3% Triton-X-100, 1% BSA and 10% NGS in PBS for 2 hours at room temperature and transferred into primary antibody diluted in blocking buffer with 3% NGS. After incubating for 2 days at 4°C, sections were washed three times for 10 minutes each in PBST (PBS, 0.05% Tween 20) and incubated for 2 hours at room temperature in secondary antibody diluted in blocking buffer with 3% NGS. The sections were washed as before, followed by a wash in PBS and incubated in DAPI diluted in PBS for 5 minutes. The sections were mounted onto lysine-coated Colorfrost Plus slides (Fisher Scientific) in Prolong Gold antifade reagent (Invitrogen).
Images were collected using a Leica SP5 confocal microscope equipped with a 63x PlanApo objective (N.A. 1.4; Leica Microsystems, Germany). The same laser and detection parameters were used for wild type and mutant sections. To quantify immunostaining of CELF4 targets, images were imported into ImageJ. Z-stacks comprising the immunostaining signal were summed into a single projection (the same number of z-stacks were summed for wildtype and mutant). Cell bodies or neuropil (N = 10–20) were manually selected and fluorescence intensity was measured. For each image, background selections (N = 10) were measured, and the average background for the image was subtracted from the cell measurements. Images were not processed in any way prior to quantification. For figure presentation, brightness and contrast were minimally adjusted and equivalent adjustments were made to both wildtype and mutant images.
Quantitative RT–PCR (qPCR)
Total RNA was prepared from the cortex and hippocampus of adult mice between 8–9 weeks of age using TRIzol reagent (Invitrogen) and treated with DNase I (Promega) according to the manufacturers' suggested conditions. Two micrograms of RNA was transcribed with avian myeloblastosis virus reverse transcriptase. The cDNA from three homozygous mutants and three wildtype littermates was diluted 20-fold and 1.5 µl was added to 13.5 µl of Sybr Green PCR mix (Finnzymes DyNAmo HS SYBR Green qPCR Kit, New England Biolabs) with primers (File S9). The PCR amplifications were run in triplicate and monitored by an ABI Prism 7000 sequence detector (Applied Biosystems, Foster City, CA). The correct PCR amplification was confirmed by the dissociation curve function of the ABI machine and by agarose gel electrophoresis. Relative expression was calculated as fold change, or 2ΔΔCt, where ΔΔCt is the difference in cycle number to threshold (Ct, averaged from triplicates) between experimental and reference (actin) amplicons.
Primary neuronal culture
Hippocampi from embryonic day 16 (E16) mice were dissected under a dissecting microscope in cold artificial cerebrospinal fluid (ACSF, 119 mM NaCl, 5 mM KCl, 1 mM MgCl2, 30 mM dextrose, 25 mM HEPES, pH 7.4, without calcium). Following dissociation with papain in ACSF at 37°C for 15 min, 2×10⁵ hippocampal neurons were seeded on 12 mm poly-lysine treated coverslips (size #1.5). The plating medium was Neurobasal medium containing containing 50 U/ml penicillin, 50 g/ml streptomycin, and 2 mM GlutaMAX, supplemented with 2% SM1 (Stemcell Technologies) and 5% heat-inactivated horse serum (Invitrogen). Twenty-four hours after initial plating, the original plating medium was replaced with fresh plating medium. Neurons were then fed twice weekly with Neurobasal media (see above) supplemented with 2% SM1 starting at 4 days in vitro (DIV4).
Immunocytochemistry
Neurons at DIV14 were washed in warm ACSF and fixed in ice-cold 4% paraformaldehyde with 4% sucrose in PBS for 15 minutes at 4°C. Fixation was quenched in 0.1 M glycine in PBS for 5 minutes at room temperature, and cells were washed two times for 5 minutes in PBS at room temperature. Neurons were permeabilized in 0.25% Triton X-100 in PBS for 5 minutes at room temperature, blocked (10% normal goat serum, 0.1% Triton X-100, in PBS), then incubated with anti-CELF4 and anti-MAP2 primary antibodies overnight at 4°C. After three washes in PBS for five minutes each at room temperature, secondary antibodies (AlexaFluor 488-conjugated goat anti-rabbit and AlexaFluor 555-conjugated goat anti-chicken, Invitrogen) diluted 1∶500 in PBS were added for one hour at room temperature. Neurons were then washed and stained with DAPI (1∶1500, Sigma) and mounted in ProLong Gold (Invitrogen). Images were collected using a Leica SP5 confocal microscope equipped with a 63x PlanApo oil immersion objective (N.A. 1.4, Leica Microsystems, Germany).
Data access
Accession number for the CELF4 iCLIP data in ArrayExpress: (E-MTAB-1162). Accession number for the microarray data in ArrayExpress: (E-MTAB-1163). Accession number for the polysome data in NCBI Bioproject: PRJNA168524. Accession number for the hippocampal dissection data in NCBI Bioproject: PRJNA168525.
Supporting Information
Zdroje
1. KapoorA, SatishchandraP, RatnapriyaR, ReddyR, KadandaleJ, et al. (2008) An idiopathic epilepsy syndrome linked to 3q13.3–q21 and missense mutations in the extracellular calcium sensing receptor gene. Ann Neurol 64 : 158–167.
2. StogmannE, LichtnerP, BaumgartnerC, BonelliS, Assem-HilgerE, et al. (2006) Idiopathic generalized epilepsy phenotypes associated with different EFHC1 mutations. Neurology 67 : 2029–2031.
3. SuzukiT, Delgado-EscuetaAV, AguanK, AlonsoME, ShiJ, et al. (2004) Mutations in EFHC1 cause juvenile myoclonic epilepsy. Nat Genet 36 : 842–849.
4. SuzukiT, MiyamotoH, NakahariT, InoueI, SuemotoT, et al. (2009) Efhc1 deficiency causes spontaneous myoclonus and increased seizure susceptibility. Hum Mol Genet 18 : 1099–1109.
5. PalDK, EvgrafovOV, TabaresP, ZhangF, DurnerM, et al. (2003) BRD2 (RING3) is a probable major susceptibility gene for common juvenile myoclonic epilepsy. Am J Hum Genet 73 : 261–270.
6. StrugLJ, ClarkeT, ChiangT, ChienM, BaskurtZ, et al. (2009) Centrotemporal sharp wave EEG trait in rolandic epilepsy maps to Elongator Protein Complex 4 (ELP4). Eur J Hum Genet 17 : 1171–1181.
7. CascellaNG, SchretlenDJ, SawaA (2009) Schizophrenia and epilepsy: is there a shared susceptibility? Neurosci Res 63 : 227–235.
8. KalachikovS, EvgrafovO, RossB, WinawerM, Barker-CummingsC, et al. (2002) Mutations in LGI1 cause autosomal-dominant partial epilepsy with auditory features. Nat Genet 30 : 335–341.
9. Morante-RedolatJM, Gorostidi-PagolaA, Piquer-SirerolS, SaenzA, PozaJJ, et al. (2002) Mutations in the LGI1/Epitempin gene on 10q24 cause autosomal dominant lateral temporal epilepsy. Hum Mol Genet 11 : 1119–1128.
10. ChangYT, ChenPC, TsaiIJ, SungFC, ChinZN, et al. (2011) Bidirectional relation between schizophrenia and epilepsy: a population-based retrospective cohort study. Epilepsia 52 : 2036–2042.
11. KarouniM, ArulthasS, LarssonPG, RytterE, JohannessenSI, et al. (2010) Psychiatric comorbidity in patients with epilepsy: a population-based study. Eur J Clin Pharmacol 66 : 1151–1160.
12. MorganCL, BaxterH, KerrMP (2003) Prevalence of epilepsy and associated health service utilization and mortality among patients with intellectual disability. Am J Ment Retard 108 : 293–300.
13. SpenceSJ, SchneiderMT (2009) The role of epilepsy and epileptiform EEGs in autism spectrum disorders. Pediatr Res 65 : 599–606.
14. Liu-YesucevitzL, BassellGJ, GitlerAD, HartAC, KlannE, et al. (2011) Local RNA translation at the synapse and in disease. J Neurosci 31 : 16086–16093.
15. LukongKE, ChangKW, KhandjianEW, RichardS (2008) RNA-binding proteins in human genetic disease. Trends Genet 24 : 416–425.
16. UleJ (2008) Ribonucleoprotein complexes in neurologic diseases. Curr Opin Neurobiol 18 : 516–523.
17. BhakarAL, DolenG, BearMF (2012) The Pathophysiology of Fragile X (and What It Teaches Us about Synapses). Annu Rev Neurosci doi: 10.1146/annurev-neuro-060909-153138.
18. GehmanLT, StoilovP, MaguireJ, DamianovA, LinCH, et al. (2011) The splicing regulator Rbfox1 (A2BP1) controls neuronal excitation in the mammalian brain. Nat Genet 43 : 706–711.
19. LiuW, SetoJ, DonovanG, TothM (2002) Jerky, a protein deficient in a mouse epilepsy model, is associated with translationally inactive mRNA in neurons. J Neurosci 22 : 176–182.
20. MartinCL, DuvallJA, IlkinY, SimonJS, ArreazaMG, et al. (2007) Cytogenetic and molecular characterization of A2BP1/FOX1 as a candidate gene for autism. Am J Med Genet B Neuropsychiatr Genet 144B: 869–876.
21. MooreT, HecquetS, McLellannA, VilleD, GridD, et al. (2001) Polymorphism analysis of JRK/JH8, the human homologue of mouse jerky, and description of a rare mutation in a case of CAE evolving to JME. Epilepsy Res 46 : 157–167.
22. SiemenH, ColasD, HellerHC, BrustleO, PeraRA (2011) Pumilio-2 function in the mouse nervous system. PLoS ONE 6: e25932 doi:10.1371/journal.pone.0025932.
23. TothM, GrimsbyJ, BuzsakiG, DonovanGP (1995) Epileptic seizures caused by inactivation of a novel gene, jerky, related to centromere binding protein-B in transgenic mice. Nat Genet 11 : 71–75.
24. WagnonJL, MahaffeyCL, SunW, YangY, ChaoHT, et al. (2011) Etiology of a genetically complex seizure disorder in Celf4 mutant mice. Genes Brain Behav 10 : 765–777.
25. YangY, MahaffeyCL, BerubeN, MaddatuTP, CoxGA, et al. (2007) Complex seizure disorder caused by Brunol4 deficiency in mice. PLoS Genet 3: e124 doi:10.1371/journal.pgen.0030124.
26. HalgrenC, BacheI, BakM, MyattMW, AndersonCM, et al. (2012) Haploinsufficiency of CELF4 at 18q12.2 is associated with developmental and behavioral disorders, seizures, eye manifestations, and obesity. Eur J Hum Genet doi: 10.1038/ejhg.2012.1092.
27. GoodPJ, ChenQ, WarnerSJ, HerringDC (2000) A family of human RNA-binding proteins related to the Drosophila Bruno translational regulator. J Biol Chem 275 : 28583–28592.
28. LaddAN, CharletN, CooperTA (2001) The CELF family of RNA binding proteins is implicated in cell-specific and developmentally regulated alternative splicing. Mol Cell Biol 21 : 1285–1296.
29. LaddAN, NguyenNH, MalhotraK, CooperTA (2004) CELF6, a member of the CELF family of RNA-binding proteins, regulates muscle-specific splicing enhancer-dependent alternative splicing. J Biol Chem 279 : 17756–17764.
30. MeinsM, SchlickumS, WilhelmC, MissbachJ, YadavS, et al. (2002) Identification and characterization of murine Brunol4, a new member of the elav/bruno family. Cytogenet Genome Res 97 : 254–260.
31. LoriaPM, DukeA, RandJB, HobertO (2003) Two neuronal, nuclear-localized RNA binding proteins involved in synaptic transmission. Curr Biol 13 : 1317–1323.
32. BrimacombeKR, LaddAN (2007) Cloning and embryonic expression patterns of the chicken CELF family. Developmental dynamics : an official publication of the American Association of Anatomists 236 : 2216–2224.
33. WuJ, LiC, ZhaoS, MaoB (2010) Differential expression of the Brunol/CELF family genes during Xenopus laevis early development. Int J Dev Biol 54 : 209–214.
34. DasguptaT, LaddAN (2012) The importance of CELF control: molecular and biological roles of the CUG-BP, Elav-like family of RNA-binding proteins. Wiley Interdiscip Rev RNA 3 : 104–121.
35. LeeJE, LeeJY, WiluszJ, TianB, WiluszCJ (2010) Systematic analysis of cis-elements in unstable mRNAs demonstrates that CUGBP1 is a key regulator of mRNA decay in muscle cells. PLoS ONE 5: e11201 doi:10.1371/journal.pone.0011201.
36. RattenbacherB, BeisangD, WiesnerDL, JeschkeJC, von HohenbergM, et al. (2010) Analysis of CUGBP1 targets identifies GU-repeat sequences that mediate rapid mRNA decay. Mol Cell Biol 30 : 3970–3980.
37. VlasovaIA, TahoeNM, FanD, LarssonO, RattenbacherB, et al. (2008) Conserved GU-rich elements mediate mRNA decay by binding to CUG-binding protein 1. Mol Cell 29 : 263–270.
38. MukhopadhyayD, HouchenCW, KennedyS, DieckgraefeBK, AnantS (2003) Coupled mRNA stabilization and translational silencing of cyclooxygenase-2 by a novel RNA binding protein, CUGBP2. Mol Cell 11 : 113–126.
39. SubramaniamD, NatarajanG, RamalingamS, RamachandranI, MayR, et al. (2008) Translation inhibition during cell cycle arrest and apoptosis: Mcl-1 is a novel target for RNA binding protein CUGBP2. Am J Physiol Gastrointest Liver Physiol 294: G1025–1032.
40. HorbLD, HorbME (2010) BrunoL1 regulates endoderm proliferation through translational enhancement of cyclin A2 mRNA. Dev Biol 345 : 156–169.
41. KonigJ, ZarnackK, RotG, CurkT, KayikciM, et al. (2011) iCLIP–transcriptome-wide mapping of protein-RNA interactions with individual nucleotide resolution. J Vis Exp
42. BaileyTL (2011) DREME: motif discovery in transcription factor ChIP-seq data. Bioinformatics 27 : 1653–1659.
43. TsudaK, KuwasakoK, TakahashiM, SomeyaT, InoueM, et al. (2009) Structural basis for the sequence-specific RNA-recognition mechanism of human CUG-BP1 RRM3. Nucleic Acids Res 37 : 5151–5166.
44. MasudaA, AndersenHS, DoktorTK, OkamotoT, ItoM, et al. (2012) CUGBP1 and MBNL1 preferentially bind to 3′ UTRs and facilitate mRNA decay. Sci Rep 2 : 209.
45. MarquisJ, PaillardL, AudicY, CossonB, DanosO, et al. (2006) CUG-BP1/CELF1 requires UGU-rich sequences for high-affinity binding. Biochem J 400 : 291–301.
46. Huang daW, ShermanBT, LempickiRA (2009) Systematic and integrative analysis of large gene lists using DAVID bioinformatics resources. Nat Protoc 4 : 44–57.
47. Huang daW, ShermanBT, LempickiRA (2009) Bioinformatics enrichment tools: paths toward the comprehensive functional analysis of large gene lists. Nucleic Acids Res 37 : 1–13.
48. CajigasIJ, TushevG, WillTJ, Tom DieckS, FuerstN, et al. (2012) The local transcriptome in the synaptic neuropil revealed by deep sequencing and high-resolution imaging. Neuron 74 : 453–466.
49. LorinczA, NusserZ (2010) Molecular identity of dendritic voltage-gated sodium channels. Science 328 : 906–909.
50. SossinWS, DesGroseillersL (2006) Intracellular trafficking of RNA in neurons. Traffic 7 : 1581–1589.
51. KieblerMA, BassellGJ (2006) Neuronal RNA granules: movers and makers. Neuron 51 : 685–690.
52. KrichevskyAM, KosikKS (2001) Neuronal RNA granules: a link between RNA localization and stimulation-dependent translation. Neuron 32 : 683–696.
53. ShiinaN, ShinkuraK, TokunagaM (2005) A novel RNA-binding protein in neuronal RNA granules: regulatory machinery for local translation. J Neurosci 25 : 4420–4434.
54. AschrafiA, CunninghamBA, EdelmanGM, VanderklishPW (2005) The fragile X mental retardation protein and group I metabotropic glutamate receptors regulate levels of mRNA granules in brain. Proceedings of the National Academy of Sciences of the United States of America 102 : 2180–2185.
55. DarnellJC, Van DriescheSJ, ZhangC, HungKY, MeleA, et al. (2011) FMRP Stalls Ribosomal Translocation on mRNAs Linked to Synaptic Function and Autism. Cell 146 : 247–261.
56. StefaniG, FraserCE, DarnellJC, DarnellRB (2004) Fragile X mental retardation protein is associated with translating polyribosomes in neuronal cells. J Neurosci 24 : 7272–7276.
57. TurrigianoGG (2008) The self-tuning neuron: synaptic scaling of excitatory synapses. Cell 135 : 422–435.
58. MainenZF, JoergesJ, HuguenardJR, SejnowskiTJ (1995) A model of spike initiation in neocortical pyramidal neurons. Neuron 15 : 1427–1439.
59. MooreJW, StockbridgeN, WesterfieldM (1983) On the site of impulse initiation in a neurone. J Physiol 336 : 301–311.
60. RappM, YaromY, SegevI (1996) Modeling back propagating action potential in weakly excitable dendrites of neocortical pyramidal cells. Proc Natl Acad Sci U S A 93 : 11985–11990.
61. ChekulaevaM, HentzeMW, EphrussiA (2006) Bruno acts as a dual repressor of oskar translation, promoting mRNA oligomerization and formation of silencing particles. Cell 124 : 521–533.
62. NakamuraA, SatoK, Hanyu-NakamuraK (2004) Drosophila cup is an eIF4E binding protein that associates with Bruno and regulates oskar mRNA translation in oogenesis. Dev Cell 6 : 69–78.
63. StewardO, LevyWB (1982) Preferential localization of polyribosomes under the base of dendritic spines in granule cells of the dentate gyrus. J Neurosci 2 : 284–291.
64. CasanovaJR, NishimuraM, OwensJW, SwannJW (2012) Impact of seizures on developing dendrites: Implications for intellectual developmental disabilities. Epilepsia 53 Suppl 1 : 116–124.
65. PenzesP, CahillME, JonesKA, VanLeeuwenJE, WoolfreyKM (2011) Dendritic spine pathology in neuropsychiatric disorders. Nat Neurosci 14 : 285–293.
66. ToroR, KonyukhM, DelormeR, LeblondC, ChasteP, et al. (2010) Key role for gene dosage and synaptic homeostasis in autism spectrum disorders. Trends Genet 26 : 363–372.
67. LiZ, ZhangY, KuL, WilkinsonKD, WarrenST, et al. (2001) The fragile X mental retardation protein inhibits translation via interacting with mRNA. Nucleic Acids Res 29 : 2276–2283.
68. NapoliI, MercaldoV, BoylPP, EleuteriB, ZalfaF, et al. (2008) The fragile X syndrome protein represses activity-dependent translation through CYFIP1, a new 4E-BP. Cell 134 : 1042–1054.
69. BassellGJ, WarrenST (2008) Fragile X syndrome: loss of local mRNA regulation alters synaptic development and function. Neuron 60 : 201–214.
70. GibsonJR, BartleyAF, HaysSA, HuberKM (2008) Imbalance of neocortical excitation and inhibition and altered UP states reflect network hyperexcitability in the mouse model of fragile X syndrome. J Neurophysiol 100 : 2615–2626.
71. IossifovI, RonemusM, LevyD, WangZ, HakkerI, et al. (2012) De novo gene disruptions in children on the autistic spectrum. Neuron 74 : 285–299.
72. BasuSN, KolluR, Banerjee-BasuS (2009) AutDB: a gene reference resource for autism research. Nucleic Acids Res 37: D832–836.
73. KonigJ, ZarnackK, RotG, CurkT, KayikciM, et al. (2010) iCLIP reveals the function of hnRNP particles in splicing at individual nucleotide resolution. Nat Struct Mol Biol 17 : 909–915.
74. LangmeadB (2010) Aligning short sequencing reads with Bowtie. Curr Protoc Bioinformatics Chapter 11: Unit 11 17.
75. WangZ, KayikciM, BrieseM, ZarnackK, LuscombeNM, et al. (2010) iCLIP predicts the dual splicing effects of TIA-RNA interactions. PLoS Biol 8: e1000530 doi:10.1371/journal.pbio.1000530.
Štítky
Genetika Reprodukční medicínaČlánek vyšel v časopise
PLOS Genetics
2012 Číslo 11
Nejčtenější v tomto čísle
- Mechanisms Employed by to Prevent Ribonucleotide Incorporation into Genomic DNA by Pol V
- Inference of Population Splits and Mixtures from Genome-Wide Allele Frequency Data
- Zcchc11 Uridylates Mature miRNAs to Enhance Neonatal IGF-1 Expression, Growth, and Survival
- Histone Methyltransferases MES-4 and MET-1 Promote Meiotic Checkpoint Activation in