
Notch-Mediated Suppression of TSC2 Expression Regulates Cell Differentiation in the Intestinal Stem Cell Lineage
Epithelial homeostasis in the posterior midgut of Drosophila is maintained by multipotent intestinal stem cells (ISCs). ISCs self-renew and produce enteroblasts (EBs) that differentiate into either enterocytes (ECs) or enteroendocrine cells (EEs) in response to differential Notch (N) activation. Various environmental and growth signals dynamically regulate ISC activity, but their integration with differentiation cues in the ISC lineage remains unclear. Here we identify Notch-mediated repression of Tuberous Sclerosis Complex 2 (TSC2) in EBs as a required step in the commitment of EBs into the EC fate. The TSC1/2 complex inhibits TOR signaling, acting as a tumor suppressor in vertebrates and regulating cell growth. We find that TSC2 is expressed highly in ISCs, where it maintains stem cell identity, and that N-mediated repression of TSC2 in EBs is required and sufficient to promote EC differentiation. Regulation of TSC/TOR activity by N signaling thus emerges as critical for maintenance and differentiation in somatic stem cell lineages.
Published in the journal:
. PLoS Genet 8(11): e32767. doi:10.1371/journal.pgen.1003045
Category:
Research Article
doi:
https://doi.org/10.1371/journal.pgen.1003045
Summary
Epithelial homeostasis in the posterior midgut of Drosophila is maintained by multipotent intestinal stem cells (ISCs). ISCs self-renew and produce enteroblasts (EBs) that differentiate into either enterocytes (ECs) or enteroendocrine cells (EEs) in response to differential Notch (N) activation. Various environmental and growth signals dynamically regulate ISC activity, but their integration with differentiation cues in the ISC lineage remains unclear. Here we identify Notch-mediated repression of Tuberous Sclerosis Complex 2 (TSC2) in EBs as a required step in the commitment of EBs into the EC fate. The TSC1/2 complex inhibits TOR signaling, acting as a tumor suppressor in vertebrates and regulating cell growth. We find that TSC2 is expressed highly in ISCs, where it maintains stem cell identity, and that N-mediated repression of TSC2 in EBs is required and sufficient to promote EC differentiation. Regulation of TSC/TOR activity by N signaling thus emerges as critical for maintenance and differentiation in somatic stem cell lineages.
Introduction
Regenerative processes in somatic tissues require coordinated regulation of stem cell proliferation and daughter cell differentiation to ensure long-term tissue homeostasis [1]–[3]. The Drosophila posterior midgut epithelium has emerged as an excellent model system to study this regulation [4]–[7]. It is maintained by Intestinal stem cells (ISCs) that divide to self-renew and produce enteroblasts (EB), which undergo differentiation to become either enterocytes (ECs) or enteroendocrine cells (EEs) [8]–[10].
Differentiation in the ISC lineage is controlled by Delta/Notch (Dl/N) signaling. ISCs express Dl and activate N in EBs, thus promoting differentiation into either EEs or ECs. The cell fate decision between ECs and EEs seems to be regulated by the intensity of the Dl signal, i.e. high levels of N activity in EBs result in EC differentiation, while moderate activation of N promotes EE differentiation [10], [11]. Dl-mediated N activation in EBs increases the activity of the Suppressor of Hairless (Su(H)) transcription factor, presumably by replacing the Hairless transcriptional repressor from Enhancer of Split (E(spl)) complex promoters with the Notch intracellular domain (NICD) [12]. How this pathway coordinates cell specification with cell growth and proliferation in the ISC lineage remains unclear.
ISC proliferation is regulated by growth factor and stress signaling pathways [13]–[32]. These pro-mitotic signals include the Insulin/IGF signaling pathway (IIS), which is sufficient and required for ISC proliferation [18], [23], [33], [34]. Activation of the Insulin Receptor (InR) in flies initiates an evolutionarily conserved signaling cascade composed of insulin receptor substrate (IRS, Chico), PI3Kinase (DP110) and Akt, inducing cell proliferation and/or growth and endoreplication [35]–[39]. Interestingly, IIS induces ISC proliferation through both cell-autonomous mechanisms involving the Akt-regulated transcription factor Foxo, as well as through a non-autonomous process in which IIS – induced EB differentiation is critical to allow further ISC divisions [7], [34]. In EBs, InR is sufficient and required for differentiation into ECs [34].
In most Drosophila tissues, cell growth is regulated downstream of Akt by the evolutionarily conserved TSC/Rheb/TOR pathway [37], [40], [41]. As supported by genetic and biochemical studies, this pathway can be activated in response to Akt-mediated phosphorylation of Tuberous Sclerosis Complex 2 (TSC2; encoded by the gene gigas in Drosophila) and subsequent inhibition of the TSC1/2 complex [37], [40]. TSC1 promotes the stability of TSC2, which is a GTPase activating protein for the small GTPase Rheb, inhibiting Rheb-mediated TOR Kinase activation. TOR, in turn, phosphorylates translational regulators, including ribosomal protein S6 Kinase (S6K) and eIF4E Binding Protein (4EBP), resulting in a net increase of protein production in cells.
In addition to Akt-mediated phosphorylation, other signals are likely to play an important role in regulating TSC1/2 activity in vivo [42], [43]. Accordingly, various other regulatory events, including phosphorylation in response to several growth factors and morphogens, ubiquitination, and degradation, have been reported to influence TSC1/2 activity [37], [40], [44]. The TSC1/2 complex thus represents a critical node in signaling networks that arbitrate between cell proliferation and growth in response to increased insulin signaling. Supporting this view, mutations in TSC1/2 result in Tuberous Sclerosis Complex, a rare autosomal dominant disease that is characterized by widespread benign tumor formation [45].
Recent studies suggest that TSC/TOR signaling has an important regulatory role in both vertebrate and invertebrate stem cell lineages. In human embryonic stem cells, activation of S6K by mTOR has been reported to induce differentiation [46], while a recent study in the mouse has identified an interesting non-autonomous function for mTOR activity in ISC support cells, the Paneth cells. Under conditions of dietary restriction, TOR signaling activity is reduced in Paneth cells, resulting in secretion of factors that promote stem cell maintenance and proliferation [47]. In the Drosophila germline, TSC/TOR signaling regulates proliferation and maintenance of germline stem cells (GSCs) [48]–[50]. GSCs mutant for TSC1/2 undergo differentiation, through a so far unknown mechanism [49], [50], while GSCs mutant for the TOR kinase exhibit proliferation defects [49]. TSC/TOR signaling is thus likely to mediate, at least partially, the effects of the dietary status of the organism on GSC proliferation and maintenance [48]–[50][4], [51].
In the Drosophila intestine, TSC/TOR signaling may have a similar function, as ISCs are also regulated according to nutrient availability [33], [52]. Indeed, a recent report shows that loss of TSC in ISCs causes excessive ISC growth and impairs ISC proliferation [53]. Using the ISC and EB driver esgGal4, it was shown that TSC2-RNAi expressing ISCs become large, express less cell cycle markers, have reduced DNA replication, and that these phenotypes are Rapamycin-sensitive. These cells further fail to respond to tissue damage by initiating cell divisions, and exhibit increased DNA content, indicating that they are becoming polyploidy [53]. While these characteristics indicated differentiation of TSC deficient cells, it was shown that TSC2-RNAi expressing cells do not express the EC marker Pdm1, and do not form ECs with brushed borders, suggesting that they may have initiated, but not completed, differentiation. TSC-mediated inhibition of TOR signaling thus seems to be critical to maintain ISC activity and function. It remained unclear, however, what physiological role, if any, TOR activation may have in ISCs or their daughter cells, and how Tor signaling may interact with others pathways regulating ISC commitment and differentiation.
Here, to address these questions, we characterize the function and regulation of TSC/TOR signaling in the ISC lineage in more detail. We find that TSC2 is highly expressed in ISCs, but specifically down regulated in EBs. While, consistent with the previous report [53], high TSC2 expression is required for ISC function, we also find that the down-regulation of TSC2 in EBs, and the resulting TOR activation, are critical for EC differentiation. Our results further suggest that TSC activity promotes lineage commitment of EBs into the EE fate.
To characterize the regulation of TSC/TOR signaling in EBs further, we assessed its interaction with the Notch (N) signaling pathway. We find that N-induced Su(H) activity represses TSC2 expression in EBs. Strikingly, repression of TSC1/2 function is sufficient to commit cells into the EC fate independently of N activity, indicating that TSC2 repression is a central step in N-induced EC differentiation.
We also find that food conditions significantly impact the proliferative capacity of TSC-deficient ISCs. We show that TSC mutant ISCs are capable of generating normal clones of daughter cells on a low calorie (low yeast) diet, but that these lineages decline over time. Rearing flies on high-yeast food, however, causes growth and proliferation phenotypes similar to the ones observed in [53], accelerating the decline of TSC mutant clones. TSC activity in ISCs is thus specifically required to maintain ISC function under high nutrient conditions.
Results
Regulation of cell proliferation and growth by TOR signaling in the Drosophila intestine
While InR/Akt signaling can activate TOR signaling in many Drosophila tissues [35]–[37], [40], [41], previous reports have suggested an opposing role of InR and TOR signaling in the control of ISC proliferation: While Insulin/IGF signaling (IIS) is required for ISC proliferation, and activation of IIS (by InR over-expression) induces increased proliferation [18], [23], [33], [34], activation of TOR signaling (by loss of TSC function) was found to impair proliferative capacity [53]. Using RNAi-based knockdown of TSC2 in ISCs and EBs, Amcheslavsky et al found that loss of TSC2 increased the size of ISCs. Based on cell cycle markers and EdU incorporation experiments, it was concluded that these cells are not mitotically active. Furthermore, the proliferative capacity of TSC2 homozygous mutant ISCs was assessed using lineage tracing by somatic recombination. However, a mitotic recombination with a repressible cell marker (MARCM, [54]) approach was used in which GFP was expressed under the control of esg::Gal4, which labels only ISCs and EBs (see Materials and Methods in [53]). Clones with more than two cells (including ECs and EEs) that may be formed by TSC mutant ISCs (see below) can not be observed with this approach (see for example Fig. 2A in [53]), and a full lineage analysis of TSC deficient ISCs was thus not possible. While the results reported in [53] thus clearly identified a critical role for TSC2 in maintaining small, diploid ISCs, it remained unclear whether activation of TOR signaling in ISCs would fully impair their proliferative activity and prevent generation of ISC daughter cells. Interestingly, the reported results indicated that TSC2 function is required in ISCs for IIS-mediated induction of proliferation, suggesting that IIS activation does not result in inactivation of TSC in the ISC lineage. It further remained unclear whether TOR signaling has to be continuously repressed by TSC2 in the ISC lineage, or whether TOR activation occurs naturally in the lineage to regulate proliferation, growth or differentiation of ISCs or their daughter cells.
To characterize the relationship between InR and the TOR signaling pathway in ISC lineages in more detail, we generated ISC clones with gain - and loss-of-function conditions for multiple IIS and TOR pathway components (Figure 1). We used MARCM to generate ISC clones that over-express wild-type or dominant-negative insulin receptor (InR; [55]) molecules, that were mutant for the IRS homologue Chico (carrying the loss of function allele chico1 [56]), or that were homozygous for the InR loss-of-function alleles InRE19 or InR353 [57]. Similarly, we generated clones with TOR pathway gain - and loss-of-function conditions by over-expressing Rheb or TSC1 and 2, introducing the TSC1 loss of function allele Tsc1Q87X [58], the TSC2 loss of function allele gigas192 [59], the TOR loss of function alleles Tor2L1, Tor2L19 and TorW1251R [60], or the Rheb loss of function allele Rheb2D1 [61], or expressing dsRNA against TSC2 (TSC2RNAi).

Importantly, we used a MARCM approach in which all daughter cells of mutant ISCs are labeled by GFP (since GFP was expressed under the control of tub::Gal4). The vast majority of GFP+ lineages (>95%) in the midgut were induced by mitotic recombination in response to heat shock, as very few marked cell clones could be observed in control animals (Figure S1C). The number of cells in each clone at a given time point after the heat shock thus accurately reflects ISC proliferation.
Consistent with previous reports [18], [23], [33], [34], gain of InR function increased the number of cells produced in a clone, while loss of InR or chico activity significantly reduced the number of cells produced by an ISC in 7 days (Figure 1A, 1B). Loss of TOR pathway activity also reduced clone sizes at 7 days, and increasing TOR pathway activity (in TSC mutants or Rheb over-expressing clones) resulted in clones that showed no significant difference in average cell numbers at 7 day after induction. In contrast to the observations reported in [53], ISCs with increased TOR pathway (i.e. reduced TSC) activity were thus capable of generating normal ISC lineages in our studies. However, the variability in clone sizes increased in TOR gain of function conditions compared to wild-type clones (compare standard deviations in Figure 1B), indicating that, consistent with [53], individual ISCs may lose the ability to generate normal numbers of daughter cells (see below). As expected, we also observed significantly larger Enterocytes (ECs, defined as the largest polyploid, Dl - negative cell in a clone) in both IIS and TOR gain-of-function conditions at 7 days after clone induction, and significantly smaller cells in IIS/TOR loss-of-function conditions (Figure 1C). This is consistent with previous findings in developmental contexts and in GSCs, showing that IIS and TOR signaling act in concert to promote endoreplication and growth [39], [49].
Our results thus support a positive interaction between InR and TOR signaling in the ISC lineage. We tested whether TOR signaling acts downstream of InR in the regulation of proliferation and growth in this lineage by assessing the frequency of mitotic figures and the size of EC nuclei. We co-overexpressed InR with TSC1 and TSC2, or with dsRNA against S6K (S6KRNAi) using the ISC/EB driver esg::Gal4 in combination with the heat-sensitive Gal4 inhibitor Gal80ts (Figure S1A, S1B; TARGET system [8], [9], [62]). InR over-expression using this driver dramatically increases ISC proliferation rates (as represented by the number of phospho-histone H3 (pH3) positive cells [18]) and increases cell sizes in the gut (as represented by the size of EC nuclei; Figure S1A, S1B). Loss of TOR pathway activity (over-expression of TSC1 and 2 or knockdown of S6K) did not affect InR-mediated proliferation, but significantly prevented the increase in EC nuclear size. In these InR gain-of-function conditions, the TSC/TOR/S6K pathway is thus specifically required to promote growth and endoreplication rather than proliferation in the ISC lineage.
Nutrient-dependent phenotypes of TSC deficient ISCs
Since these results contrasted with the observations reported in [53], we assessed the phenotypes of TSC deficient ISCs in more detail. A timecourse analysis revealed that loss of TSC1 resulted in clones that initially grew faster than wild-type clones, but declined and became heterogeneous in size at later timepoints (Figure 2A and Figure S2A; see large standard deviations in TSC1 mutant clones at 5, 7, and 15 days, and compare with TSC2 mutant clones in Figure 1B). This indicated an initial increase of proliferative activity in TSC mutant ISCs, followed by a sporadic loss of proliferation in individual ISCs at a later timepoint. Indeed, while many Tsc1Q87X or gigas192 mutant clones, or clones expressing TSC2RNAi, were recovered that contained a single diploid Dl+ ISC even at 15 days after clone induction, at all ages rare clones could also be observed in which the Dl+ cell became large and polyploid, consistent with the phenotype reported by Amcheslavsky et al (Figure S2B, S2C). In our experiments, TSC mutant ISCs did thus not immediately increase in size, but grew and lost function sporadically. This interpretation is supported by the fact that the number of Tsc1Q87X mutant clones observed in the gut declined over time (Figure 2B).

To explore why TSC mutant ISCs exhibited a much less penetrant growth phenotype in our experiments as compared to [53], we tested whether the rate of the spontaneous growth of TSC mutant ISCs might be influenced by dietary conditions, which can modulate TOR activity independently of TSC [35]–[39]. Indeed, the average number of cells generated by Tsc1Q87X mutant ISCs within 7 days was significantly reduced when flies were reared on high yeast food (HY, 15% yeast) compared to our regular food (RF, 2% yeast)(Figure 2C, 2D). Dl+ cells in these Tsc1Q87X mutant clones became large and polyploid, similar to the phenotype described in [53](Figure 2E). Clone sizes were also reduced in wild-type flies reared on high yeast food, but this reduction was less significant than the size reduction of TSC deficient clones (Figure 2D).
Two recent studies have reported strong effects of yeast, the only protein source in fly food, on ISC activity. Both studies reported increased ISC activity in yeast-fed flies compared to flies completely starved of yeast [33], [34]. ISCs thus require a protein source to become fully active, yet our results indicate that they can also lose function when protein levels are too high. This effect is significantly enhanced when TSC is lost, indicating that TSC activity isolates the TOR pathway from dietary stimuli in ISCs, maintaining their function. The role of the TSC1/2 complex in ensuring the long-term maintenance of ISCs is thus reminiscent of its function in GSCs [48]–[50].
Interestingly, Tsc1Q87X mutant, or TSC2RNAi or Rheb over-expressing clones were significantly less likely to contain prospero-labeled EE cells than wild-type clones, suggesting that TOR activation also impaired the commitment of EBs into the EE cell fate, or the terminal differentiation of EEs (Figure 2F, 2G). It remains unclear, however, whether this is a consequence of direct TOR pathway-mediated regulation of prospero expression, or of other events required for EE differentiation.
Our observations thus suggest that the TSC complex promotes ISC maintenance in varying nutritional conditions, influences commitment into the EE fate, and regulates EC growth in the intestinal epithelium.
Notch-mediated suppression of TSC2 expression in ISCs/EBs
We hypothesized that these multiple functions of TSC are coordinated by intricate, cell-type specific regulation of TSC activity in the ISC lineage. To start analyzing this regulation, we examined the expression of TSC2 using an anti-Gigas antibody described in [44]. High expression of TSC2 was detected in ISCs (Dl+ cells that do not express GFP under the control of the RU486-inducible EB/EC driver 5966::GS [63], Figure 3A) and in EEs (pros+ cells, Figure 3C. These cells show even higher TSC2 expression than ISCs), and its expression was significantly weaker in EBs (cells expressing bGalactosidase from a Su(H)-GBE::lacZ construct, Figure 3B). Consistent with this expression pattern of TSC2, we found that in wild-type homeostatic conditions, the TOR pathway is highly active in EBs (compared to ISCs or ECs), as determined using an antibody against phosphorylated 4EBP (Figure 3D, this antibody reliably detects changes in TOR signaling activity, see S3A and [49]). Preventing this activation of TOR signaling in EBs was sufficient to impair the formation of normal EBs: over-expression of TSC1/2 or knockdown of S6K (S6KRNAi) specifically in EBs and ECs (using 5966::GS), resulted in the accumulation of small Dl+ cells that also express GFP (Figure 3E). Most of these cells had DNA content that was similar to ISCs, indicating that they are diploid or have not completed endoreplication (Figure S3B). The disruption of the normal asymmetric distribution of Dl in ISC/EB pairs indicates that TOR inactivation in ISC daughter cells inhibits differentiation. A similar disruption of normal EB determination was observed when TSC1/2 were over-expressed in EBs only using Su(H)-GBE::Gal4 [64] (Figure 3F, 3G). Interestingly, these guts also exhibited a significant increase in the number of pros+ EE cells, indicating that inhibiting TOR activity in EBs is sufficient to alter their commitment from the EC fate into the EE fate (Figure S3C).

Combined, our findings suggested that reduced TSC1/2 function in EBs is critical for differentiation of EBs and for lineage commitment into the EC fate. Importantly, these findings also suggested a potential mechanism for TSC2 regulation in the ISC lineage, as down-regulation of TSC2 expression coincides with the activation of N signaling in EBs. We hypothesized that N activation promotes TSC2 down-regulation and tested this idea by over-expressing the N Intracellular Domain (NICD) in ISCs and EBs (using esg::Gal4, Gal80ts). Expression of NICD is sufficient to force differentiation of ISCs into ECs [8], [9]. Consistently, we found that TSC2 expression was undetectable in most esg::GFP+ cells expressing NICD, while in wild-type intestines, more than 50% of all esg::GFP+ cells express high levels of TSC2 (Figure 4A, 4B). We further tested whether N signaling is required for TSC2 repression in the ISC lineage by over-expressing a dsRNA against N (NRNAi) in ISCs and EBs. Expression of NRNAi under the control of esg::Gal4 prevents EB differentiation and results in the formation of ISC tumors characterized by clusters of small, diploid, Dl+ cells [8], [9]. Cells in these tumors were also TSC2 positive, confirming the correlation between ISC identity and TSC2 expression, and suggesting that N signaling is required for TSC2 repression (Figure 4C; TSC2 immunoreactivity was suppressed by TSC2RNAi and enhanced by over-expressing both TSC1 and 2, confirming the specificity of the antibody. Co-expression of TSC1/2 also moderately increased the size of the stem cell tumors, indicating additional enhancement of the NRNAi-caused phenotype).

The N-responsive transcriptional regulator Su(H) has been reported to bind to a cluster of four sites within 1.5 kb in the upstream promoter region of the gigas/Tsc2 gene in Drosophila [65]. Su(H)-mediated transcriptional repression of gigas/Tsc2 was thus a plausible mechanism for N-induced repression of TSC2 expression in EBs. To test this idea, we assessed the regulation of gigas/Tsc2 in co-cultures of S2 cells that constitutively express N or Dl [66](Figure 4D–4E; N activation in N-expressing cells occurs within minutes of exposure to Dl-expressing cells, Figure S4). We first confirmed that Su(H) binds to the upstream promoter region of gigas/Tsc2 using chromatin IP (ChIP, Figure 4D), and found significant enrichment of a region proximal to the transcriptional start site in precipitates from cells with activated N signaling. We further measured transcript levels of gigas/Tsc2 and found reduced expression of this gene within 30 min of N activation (Figure 4E). This repression of gigas/Tsc2 was sustained for at least 24 hours. Protein levels of TSC2 (measured by Western Blot) did not decrease significantly in S2 cells in these experiments (not shown), indicating that in addition to transcriptional repression, posttranslational mechanisms have to be involved in reducing TSC2 protein levels in vivo as observed in ISCs expressing NICD (Figure 4A, 4B). Importantly, these results suggested that Su(H) is a general transcriptional repressor of gigas/Tsc2 expression in Drosophila cells. Accordingly, TSC2 repression in EBs was mediated by Su(H), as inducing ‘Flp-out’ clones [67] expressing Su(H)RNAi was sufficient for the formation of tumors containing small Dl+ and TSC2+ cells (Figure 4F). Consistently, gigas/Tsc2 repression in the S2 co-culture system was prevented when Su(H) was knocked down by RNAi (Figure 4G).
TSC/TOR signaling regulates EC differentiation
These findings are consistent with a model in which N activation suppresses TSC2 expression in EBs, inducing growth and endoreplication in response to insulin signals. We asked whether TSC2 repression was sufficient and required for ISC differentiation downstream of N, and found that loss of TSC1/2 indeed rescued the tumor phenotype of NRNAi expressing ISCs (in both MARCM clones, and when driven by esg::Gal4; Figure 5, Figure S5). N-deficient ISCs generate tumors because they undergo symmetric divisions and thus generate exponentially growing cell clones. Loss of TSC1/2 prevented this accumulation of Dl+ ISCs in N loss of function conditions and converted NRNAi expressing cells into Dl−, polyploid, EC-like cells. Similar to wild-type ECs, these cells also contained brush borders and expressed the EC marker Pdm1 (Figure 5A–5E, Figure S5A–S5C; brush borders can be observed by staining for phalloidin; Polyploidy measured by intensity of DAPI fluorescence). TSC1 suppression is thus sufficient to fully differentiate N-deficient ISCs into ECs. Consistent with a conversion of these cells into a postmitotic state, the number of cells observed in each cluster of NRNAi expressing cells was significantly reduced when TSC1 or 2 were lost (Figure 5E, 5F).
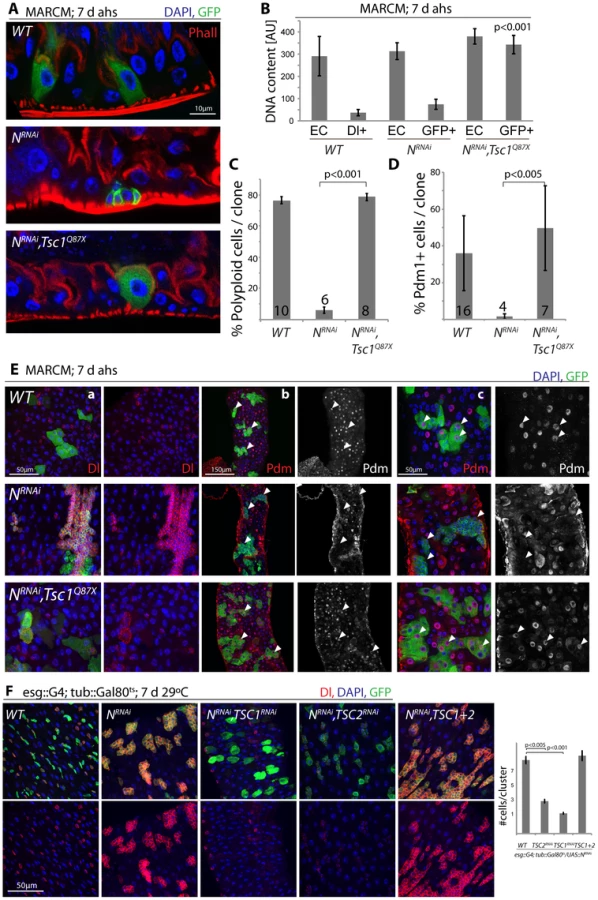
These results confirm that loss of TSC1/2 in N loss-of-function conditions is sufficient to promote differentiation of ISCs towards the EC fate. For most analyzed phenotypes, inhibition of TSC1 elicited stronger effects than inhibition of TSC2, suggesting that the knockdown of TSC2 is less efficient, or reflecting the fact that loss of TSC1 also results in degradation of TSC2 protein, as TSC1 stabilizes TSC2. While many TSC1/Notch double mutant cells thus are morphologically indistinguishable from wild-type ECs, it is important to note, however, that Notch activation elicits complex gene expression changes in cells, and it remains unclear whether all functional aspects of ECs can be reconstituted in N/TSC1/2 deficient cells. Furthermore, some of these cells retain Dl expression (see example in Figure 5E), indicating that not all of these cells fully differentiate into normal ECs.
Loss of TSC1/2 also rescued the accumulation of pros+ EE cells in N loss-of-function conditions (Figure S5D, Figure S5E), confirming a shift towards the EC fate in TSC-deficient EBs. Furthermore, co-expression of TSC1 and 2 resulted in the maintenance of small, diploid, Dl+ cells even in the presence of NICD, showing that TSC2 repression is required for N-induced ISC differentiation (in both Flp-out clones and when driven by esgGal4, Figure 6). Repression of TSC1/2 function is thus a critical step in the regulation of EB differentiation.

Discussion
TSC function and stem cell maintenance
Our results establish a new mechanism by which lineage commitment, differentiation and growth are coordinated in an epithelial stem cell lineage (Figure 7). This mechanism allows for the integration of nutritional signals through the IIS and TOR pathways with Notch-mediated differentiation signals: High expression of TSC2 in ISCs prevents differentiation and is thus critical for stem cell maintenance, while reducing TSC activity in EBs is required and sufficient to promote differentiation into ECs. This dynamic regulation of TSC levels in the ISC lineage intersects with the control of TSC1/2 activity by growth factor signals. Based on current models, we propose that control of TSC2 expression is required to set a threshold for the Akt-mediated inactivation of the TSC1/2 complex downstream of growth factor receptors. The TSC2 expression level would thus determine the cellular response to growth signals in the ISC lineage. Supporting this view, ISCs, which express high levels of TSC2 constitutively, do not differentiate in response to InR over-expression, but rather increase their proliferation rate. EBs, on the other hand, express less TSC2 and respond to InR activation by endoreplicating and growing into ECs.

Robust expression of TSC2 in ISCs thus prevents premature differentiation and growth of ISCs. When IIS is chronically activated (as in high nutrient conditions), however, Akt-mediated TSC1/2 complex inactivation may cause sporadic differentiation and loss of ISCs. Conversely, ISC maintenance might be improved in conditions of chronically low IIS and TOR activity. The TSC1/2 complex thus acts as a ‘buffer’ that improves ISC maintenance by isolating these cells from changing nutritional conditions. Accordingly, TSC1 deficiency leads to differentiation and loss of ISC function when flies are reared under high yeast conditions. Interestingly, these results also indicate that TOR pathway activation is not constitutive in TSC deficient ISCs, but is still inducible by nutritional changes. It is likely that amino acid-sensing signaling pathways, involving Rag GTPase complexes and the MAP4K3 and Vps34 kinases, regulate TOR in these situations [38].
An effect of TOR signaling on stem cell maintenance has previously been described in GSCs, and is consistent with recent findings that suppression of TOR activity, through rapamycin or genetic means, increases lifespan [48]–[50], [68]. While reducing IIS activity in the ISC lineage is sufficient to extend lifespan [23], additional studies will have to be performed to assess the role of TOR signaling in this context.
Mechanisms of Notch/TSC interaction
Three pieces of evidence indicate that transcriptional repression of TSC2 occurs downstream of N activation in the ISC lineage: (i) TSC2 expression is significantly reduced in EBs with high levels of N signaling activity, (ii) forced expression of NICD suppresses TSC2 expression in ISCs, and (iii) loss of TSC2 is sufficient to rescue N loss of function phenotypes in the ISC lineage. This regulatory interaction between TSC2 and N signaling is reminiscent of recent findings in Drosophila sensory organ precursors, mouse embryonic fibroblasts, and mammalian cancer cells [46], [69]–[73]. However, the results reported in these studies indicated that TOR pathway activation could result in increased N cleavage and N pathway activation. In the fly SOP, activation of the TOR pathway phenocopied N gain of function phenotypes, but it was not tested whether these phenotypes were rescued in N loss of function backgrounds. It thus remained unclear whether N activation is a consequence of TOR pathway activation, or whether TOR activation is a required component of the N-induced differentiation pathway in this lineage. Our results demonstrate that in the ISC lineage, TOR activation is sufficient to drive EC differentiation even in the absence of N signaling, supporting a model in which TOR activation occurs downstream of N. In TSC mutant mouse embryonic fibroblasts, on the other hand, TOR -dependent activation of N can be observed, highlighting the close, evolutionarily conserved relationship between these two signaling pathways in the control of cell differentiation, but also suggesting that multiple, context dependent, interaction mechanisms may exist [69].
Our model implies a novel role for Su(H) as a transcriptional repressor of the gigas gene. This interpretation is based on the requirement of Su(H) for the N-mediated repression of the gigas gene both in S2 cells and in the ISC linage, as well as on the binding of Su(H) to the gigas promoter. A function of Su(H) as a transcriptional repressor has not previously been described, and additional studies are needed to explore its mechanism. While binding of Su(H) to the gigas promoter indicates a direct role in transcriptional repression of gigas, it is possible that Su(H) also acts indirectly to repress gigas expression by inducing or cooperating with transcriptional repressors. A candidate group of such repressors are encoded by Su(H) target genes, the classical Hairy and E(Spl) complex. These transcription factors are induced by Su(H) in response to Notch signaling and have been described as transcriptional repressors in other contexts [74]. Putative E(Spl) binding sites are present in the gigas promoter (not shown), and additional studies will therefore be of interest to dissect the requirement for individual E(Spl) complex genes in the regulation of gigas.
Our data further indicate that transcriptional repression of gigas may not be the only mechanism by which TSC2 repression is achieved in EBs. While we find that activation of N is sufficient and required for repression of TSC2 protein in EBs in vivo, our S2 studies indicate that the turnover rate of the TSC2 protein also has to be increased to achieve rapid reduction of TSC2 levels. It can be anticipated that the control of TSC2 ubiquitination by the cul4/ddb1/fbw5 complex may be an important regulatory mechanism here, and it will be of interest to further dissect the interaction of this complex with the N signaling pathway in the ISC lineage [44].
Characterizing these signaling interactions in ISCs in more detail is of significant interest for our understanding of somatic stem cell maintenance, proliferative homeostasis and lineage commitment. The evolutionary conservation of N and TOR signaling, as well as the similarities in the biology of Drosophila and vertebrate stem cell populations [7], indicate that such understanding will provide important insight into human regenerative and proliferative diseases.
Materials and Methods
Drosophila stocks and culture
The following fly stocks were obtained from the Bloomington Drosophila Stock Center: w1118, UAS-InR, UAS-InRDN, UAS-Rheb, UAS-S6KKQ, tub-Gal80ts, UAS-SuHRNAi (TRiP.HM05110). UAS-TSC1RNAi (Transformant ID 22252), UAS-TSC2RNAi (TID 103417) and UAS-S6KRNAi (TID 104369) were obtained from the Vienna Drosophila RNAi Center. The following lines were gifts from: Esg-Gal4, S. Hayashi; UAS-NICD, UAS-NotchRNAi, and hsFlp; tub-Gal4, UAS-GFP; FRT82B tubGal80, N. Perrimon; Su(H)-GBE-LacZ, S. Bray; Su(H)-GBE-Gal4, S.X. Hou; UAS-TSC1, TSC2, M. Tatar; FRT40A, chico1, FRT82B, InRE19, and FRT82B, InR353, and FRT40, Tor2L1, FRT40, Tor2L19 and FRT40, TorW1251R by D. Drummond-Barbosa; hsFlp; FRT40A, tub-Gal80; tub-Gal4, UAS-GFP and 5966-GS, B.Ohlstein; w, hsFLP; actin, FRT, y+, FRT, Gal4, UAS::RFP, M. Uhlirova; FRT82, Tsc1Q87X and FRT82, Rheb2D1, K. Harvey.
Flies were cultured on yeast-molasses based food at 25°C with a 12 hours light/dark cycle. For TARGET experiments flies were raised at 18°C and shifted to the restrictive temperature (29°C) 3–5 days after eclosion. For clone induction (MARCM and Flp-out), 3–5 day old flies were heat shocked at 37°C for 45 minutes. For 5966GS, flies were maintained for 7 days on RU486 food (100 µl of a 5 mg/ml solution of RU486 was deposited on top of a 10 ml food vial and dried for 16 hours).
Immunostaining and microscopy
Guts were dissected in phosphate-buffered saline (PBS) and fixed for 45 min at room temperature in 100 mM glutamic acid, 25 mM KCl, 20 mM MgSO4, 4 mM sodium phosphate, 1 mM MgCl2, and 4% formaldehyde. All subsequent washes (1 hour) and antibody incubations (4°C overnight) were performed in PBS, 0.5% bovine serum albumin and 0.1% Triton X-100.
Staining with Delta antibody was performed following the methanol-heptane fixation method described in (Lin et al., 2008).
Fluorescent in situ hybridization protocol was adapted from [75] using Tyramide signal amplification (TSA) and Digoxigenin (DIG) labeled RNA probes. The following primers were used to generate RNA probes for pdm1: F 5′-AGT TTG CCA AGA CCT TCA AGC AGC and R 5′-AGG GAT TGA TGC GCT TCT CCT TCT.
Primary antibodies with respective dilutions were: From Developmental Studies Hybridoma Bank: mouse anti - Armadillo and anti-Delta, 1∶100; mouse anti-Prospero, 1∶250; Cell Signaling: rabbit anti-phospho-4EBP, 1∶500; ICN: mouse anti-b-galactosidase, 1∶100; gift from Yue Xiong: rabbit anti-Gigas, 1∶500; gift from Yang Xiao-Hang: rabbit anti-Pdm1; Upstate Biotech: rabbit anti phospho histone H3, 1∶1000; Invitrogen: Alexa Fluor 568 1∶500
Confocal microscopy was performed on a Leica SP5 system. Image processing was done on NIH Image J and Adobe Photoshop.
Cell culture
S2 cell lines stably transfected to express wild type Notch receptor (S2-Mt-N) or Delta ligand (S2-Mt-Dl) from a Cu-inducible metallothionein promoter were obtained from the Drosophila Genomic Resource Center. Both lines were cultured in M3+BPYE medium with 10% heat inactivated Fetal Calf Serum and grown under permanent selection with 0.2 µM Methotrexate (Sigma). N and Dl expression was induced separately with 600 mM CuSO4 for 24 hours and the two cell lines were then co-cultured in 1∶1 ratio for the indicated times.
For RNAi experiments, double-stranded RNAs were synthesized against GFP and Suppressor of Hairless using T7 promoters (Ambion MEGAscript RNAi kit). S2-Mt-N and S2-Mt-Dl cells were cultured separately and only S-Mt-N cells were treated with GFP dsRNA (control) or with SuH dsRNA for 3 days. After two days of dsRNA treatment both cell lines were induced with 600 mM CuSO4 for 24 hours. After three days of dsRNA treatment, S2-Mt-N cells and S2-Mt-Dl cells were co-cultured at a 1∶1 ratio for the indicated times. Knockdown of Su(H) was confirmed by RT-PCR (not shown).
Chromatin immunoprecipitation (ChIP)
∼1×10⁷ cells were collected from triplicate cell cultures of S2-Mt-N cells (control) or of 2 h co-cultures of S2-Mt-N and S2-Mt-Dl. Cells were cross-linked using ∼1.1% formaldehyde and ChIP was performed using the abcam ChIP kit (ab500). Cells were sonicated on ice using a Branson Sonicator (power 4, 50×10 second pulses with 30 second intervals; average size of genomic DNA fragments was ∼500 bp). Sheared chromatin was incubated with 5 µg of rabbit anti-GFP (invitrogen; negative control) and goat anti-SuH (Santa Cruz Biotechnology) for 24 hours and then precipitated using Protein G Sepharose (Fast Flow; Sigma). De-crosslinking and DNA purification was performed according to kit instructions (ab500). DNA from different ChIP samples was analyzed for enrichment using real time PCR using the following primer sets: gig 1 : 5′-ACAAACGCAAAGTTGGCGAC-3′ and 5′-GTGTGCAACCAGTAATTCCTAGCC-3′; gig 2 : 5′-AAGTTGTTCCTCAAATCGCTGCCG-3′ and 5′-ATTGAAGTTGTGCAGCTGCGTGTC-3′; actin5C: 5′-ATTCAACACACCAGCGCTCTCCTT-3′ and 5′-ACCGCACGGTTTGAAAGGAATGAC-3′.
Reverse transcription and real-time PCR
Total RNA was extracted using Trizol. cDNAs were synthesized using oligo-dT primers and real-time RTPCR was performed on a BioRad iQ5 detection system (using SYBR Green and ΔΔCt quantification method). Gigas and Suppressor of Hairless expression levels were quantified relative to Actin5c expression.
Western blot
Cell samples were resolved using 5% (for NICD) or 10% (for tubulin) SDS-polyacrylamide gel electrophoresis, transferred to nitrocellulose membranes using semi-dry transfer, and probed with the following primary antibodies: mouse anti-NICD (DSHB, 1∶10,000), mouse anti-alpha-tubulin (Sigma, 1∶5000). Antibodies were detected using horseradish peroxidase-conjugated secondary antibodies and the ECL detection system (Amersham).
Supporting Information
Zdroje
1. RossiDJ, JamiesonCH, WeissmanIL (2008) Stems cells and the pathways to aging and cancer. Cell 132 : 681–696.
2. Drummond-BarbosaD (2008) Stem cells, their niches and the systemic environment: an aging network. Genetics 180 : 1787–1797.
3. SharplessNE, DePinhoRA (2007) How stem cells age and why this makes us grow old. Nat Rev Mol Cell Biol 8 : 703–713.
4. JasperH, JonesDL (2010) Metabolic regulation of stem cell behavior and implications for aging. Cell Metab 12 : 561–565.
5. HouSX (2010) Intestinal stem cell asymmetric division in the Drosophila posterior midgut. J Cell Physiol 224 : 581–584.
6. CasaliA, BatlleE (2009) Intestinal stem cells in mammals and Drosophila. Cell Stem Cell 4 : 124–127.
7. BiteauB, HochmuthCE, JasperH (2011) Maintaining tissue homeostasis: dynamic control of somatic stem cell activity. Cell Stem Cell 9 : 402–411.
8. MicchelliCA, PerrimonN (2006) Evidence that stem cells reside in the adult Drosophila midgut epithelium. Nature 439 : 475–479.
9. OhlsteinB, SpradlingA (2006) The adult Drosophila posterior midgut is maintained by pluripotent stem cells. Nature 439 : 470–474.
10. OhlsteinB, SpradlingA (2007) Multipotent Drosophila intestinal stem cells specify daughter cell fates by differential notch signaling. Science 315 : 988–992.
11. PerdigotoCN, SchweisguthF, BardinAJ (2011) Distinct levels of Notch activity for commitment and terminal differentiation of stem cells in the adult fly intestine. Development 138 : 4585–4595.
12. BardinAJ, PerdigotoCN, SouthallTD, BrandAH, SchweisguthF (2010) Transcriptional control of stem cell maintenance in the Drosophila intestine. Development 137 : 705–714.
13. XuN, WangSQ, TanD, GaoY, LinG, et al. (2011) EGFR, Wingless and JAK/STAT signaling cooperatively maintain Drosophila intestinal stem cells. Dev Biol 354 : 31–43.
14. StaleyBK, IrvineKD (2010) Warts and Yorkie mediate intestinal regeneration by influencing stem cell proliferation. Curr Biol 20 : 1580–1587.
15. ShawRL, KohlmaierA, PoleselloC, VeelkenC, EdgarBA, et al. (2010) The Hippo pathway regulates intestinal stem cell proliferation during Drosophila adult midgut regeneration. Development 137 : 4147–4158.
16. RenF, WangB, YueT, YunEY, IpYT, et al. (2010) Hippo signaling regulates Drosophila intestine stem cell proliferation through multiple pathways. Proc Natl Acad Sci U S A 107 : 21064–21069.
17. KarpowiczP, PerezJ, PerrimonN (2010) The Hippo tumor suppressor pathway regulates intestinal stem cell regeneration. Development 137 : 4135–4145.
18. AmcheslavskyA, JiangJ, IpYT (2009) Tissue damage-induced intestinal stem cell division in Drosophila. Cell Stem Cell 4 : 49–61.
19. ApidianakisY, PitsouliC, PerrimonN, RahmeL (2009) Synergy between bacterial infection and genetic predisposition in intestinal dysplasia. Proc Natl Acad Sci U S A 106 : 20883–20888.
20. BeebeK, LeeWC, MicchelliCA (2010) JAK/STAT signaling coordinates stem cell proliferation and multilineage differentiation in the Drosophila intestinal stem cell lineage. Dev Biol 338 : 28–37.
21. BiteauB, HochmuthCE, JasperH (2008) JNK activity in somatic stem cells causes loss of tissue homeostasis in the aging Drosophila gut. Cell Stem Cell 3 : 442–455.
22. BiteauB, JasperH (2011) EGF signaling regulates the proliferation of intestinal stem cells in Drosophila. Development 138 : 1045–1055.
23. BiteauB, KarpacJ, SupoyoS, DeGennaroM, LehmannR, et al. (2010) Lifespan extension by preserving proliferative homeostasis in Drosophila. PLoS Genet 6: e1001159 doi:10.1371/journal.pgen.1001159.
24. BuchonN, BroderickNA, ChakrabartiS, LemaitreB (2009) Invasive and indigenous microbiota impact intestinal stem cell activity through multiple pathways in Drosophila. Genes Dev 23 : 2333–2344.
25. BuchonN, BroderickNA, KuraishiT, LemaitreB (2010) Drosophila EGFR pathway coordinates stem cell proliferation and gut remodeling following infection. BMC Biol 8 : 152.
26. BuchonN, BroderickNA, PoidevinM, PradervandS, LemaitreB (2009) Drosophila intestinal response to bacterial infection: activation of host defense and stem cell proliferation. Cell Host Microbe 5 : 200–211.
27. JiangH, GrenleyMO, BravoMJ, BlumhagenRZ, EdgarBA (2011) EGFR/Ras/MAPK signaling mediates adult midgut epithelial homeostasis and regeneration in Drosophila. Cell Stem Cell 8 : 84–95.
28. JiangH, PatelPH, KohlmaierA, GrenleyMO, McEwenDG, et al. (2009) Cytokine/Jak/Stat signaling mediates regeneration and homeostasis in the Drosophila midgut. Cell 137 : 1343–1355.
29. LeeWC, BeebeK, SudmeierL, MicchelliCA (2009) Adenomatous polyposis coli regulates Drosophila intestinal stem cell proliferation. Development 136 : 2255–2264.
30. LinG, XuN, XiR (2008) Paracrine Wingless signalling controls self-renewal of Drosophila intestinal stem cells. Nature 455 : 1119–1123.
31. HochmuthCE, BiteauB, BohmannD, JasperH (2011) Redox regulation by Keap1 and Nrf2 controls intestinal stem cell proliferation in Drosophila. Cell Stem Cell 8 : 1–12.
32. ChoiNH, KimJG, YangDJ, KimYS, YooMA (2008) Age-related changes in Drosophila midgut are associated with PVF2, a PDGF/VEGF-like growth factor. Aging Cell 7 : 318–334.
33. O'BrienLE, SolimanSS, LiX, BilderD (2011) Altered modes of stem cell division drive adaptive intestinal growth. Cell 147 : 603–614.
34. ChoiNH, LucchettaE, OhlsteinB (2011) Nonautonomous regulation of Drosophila midgut stem cell proliferation by the insulin-signaling pathway. Proc Natl Acad Sci U S A 108 : 18702–18707.
35. GrewalSS (2009) Insulin/TOR signaling in growth and homeostasis: a view from the fly world. Int J Biochem Cell Biol 41 : 1006–1010.
36. JohnstonLA, GallantP (2002) Control of growth and organ size in Drosophila. Bioessays 24 : 54–64.
37. NobukiniT, ThomasG (2004) The mTOR/S6K signalling pathway: the role of the TSC1/2 tumour suppressor complex and the proto-oncogene Rheb. Novartis Found Symp 262 : 148–154; discussion 154-149, 265-148.
38. HietakangasV, CohenSM (2009) Regulation of tissue growth through nutrient sensing. Annu Rev Genet 43 : 389–410.
39. BrittonJS, LockwoodWK, LiL, CohenSM, EdgarBA (2002) Drosophila's insulin/PI3-kinase pathway coordinates cellular metabolism with nutritional conditions. Dev Cell 2 : 239–249.
40. HuangJ, ManningBD (2008) The TSC1-TSC2 complex: a molecular switchboard controlling cell growth. Biochem J 412 : 179–190.
41. LaplanteM, SabatiniDM (2012) mTOR signaling in growth control and disease. Cell 149 : 274–293.
42. SchleichS, TelemanAA (2009) Akt phosphorylates both Tsc1 and Tsc2 in Drosophila, but neither phosphorylation is required for normal animal growth. PLoS ONE 4: e6305 doi:10.1371/journal.pone.0006305.
43. DongJ, PanD (2004) Tsc2 is not a critical target of Akt during normal Drosophila development. Genes Dev 18 : 2479–2484.
44. HuJ, ZacharekS, HeYJ, LeeH, ShumwayS, et al. (2008) WD40 protein FBW5 promotes ubiquitination of tumor suppressor TSC2 by DDB1-CUL4-ROC1 ligase. Genes Dev 22 : 866–871.
45. InokiK, GuanKL (2009) Tuberous sclerosis complex, implication from a rare genetic disease to common cancer treatment. Hum Mol Genet 18: R94–100.
46. EasleyCAt, Ben-YehudahA, RedingerCJ, OliverSL, VarumST, et al. (2010) mTOR-mediated activation of p70 S6K induces differentiation of pluripotent human embryonic stem cells. Cell Reprogram 12 : 263–273.
47. YilmazÖH, KatajistoP, LammingDW, GültekinY, Bauer-RoweKE, et al. (2012) mTORC1 in the Paneth cell niche couples intestinal stem-cell function to calorie intake. Nature
48. LaFeverL, Drummond-BarbosaD (2005) Direct control of germline stem cell division and cyst growth by neural insulin in Drosophila. Science 309 : 1071–1073.
49. LaFeverL, FeoktistovA, HsuHJ, Drummond-BarbosaD (2010) Specific roles of Target of rapamycin in the control of stem cells and their progeny in the Drosophila ovary. Development 137 : 2117–2126.
50. SunP, QuanZ, ZhangB, WuT, XiR (2010) TSC1/2 tumour suppressor complex maintains Drosophila germline stem cells by preventing differentiation. Development 137 : 2461–2469.
51. HsuHJ, Drummond-BarbosaD (2009) Insulin levels control female germline stem cell maintenance via the niche in Drosophila. Proc Natl Acad Sci U S A 106 : 1117–1121.
52. McLeodCJ, WangL, WongC, JonesDL (2010) Stem cell dynamics in response to nutrient availability. Curr Biol 20 : 2100–2105.
53. AmcheslavskyA, ItoN, JiangJ, IpYT (2011) Tuberous sclerosis complex and Myc coordinate the growth and division of Drosophila intestinal stem cells. J Cell Biol 193 : 695–710.
54. LeeT, LuoL (2001) Mosaic analysis with a repressible cell marker (MARCM) for Drosophila neural development. Trends Neurosci 24 : 251–254.
55. WuQ, ZhangY, XuJ, ShenP (2005) Regulation of hunger-driven behaviors by neural ribosomal S6 kinase in Drosophila. Proc Natl Acad Sci U S A 102 : 13289–13294.
56. BohniR, Riesgo-EscovarJ, OldhamS, BrogioloW, StockerH, et al. (1999) Autonomous control of cell and organ size by CHICO, a Drosophila homolog of vertebrate IRS1-4. Cell 97 : 865–875.
57. ChenC, JackJ, GarofaloRS (1996) The Drosophila insulin receptor is required for normal growth. Endocrinology 137 : 846–856.
58. TaponN, ItoN, DicksonBJ, TreismanJE, HariharanIK (2001) The Drosophila tuberous sclerosis complex gene homologs restrict cell growth and cell proliferation. Cell 105 : 345–355.
59. ItoN, RubinGM (1999) gigas, a Drosophila homolog of tuberous sclerosis gene product-2, regulates the cell cycle. Cell 96 : 529–539.
60. OldhamS, MontagneJ, RadimerskiT, ThomasG, HafenE (2000) Genetic and biochemical characterization of dTOR, the Drosophila homolog of the target of rapamycin. Genes Dev 14 : 2689–2694.
61. BatemanJM, McNeillH (2004) Temporal control of differentiation by the insulin receptor/tor pathway in Drosophila. Cell 119 : 87–96.
62. McGuireSE, LePT, OsbornAJ, MatsumotoK, DavisRL (2003) Spatiotemporal rescue of memory dysfunction in Drosophila. Science 302 : 1765–1768.
63. MathurD, BostA, DriverI, OhlsteinB (2010) A transient niche regulates the specification of Drosophila intestinal stem cells. Science 327 : 210–213.
64. ZengX, ChauhanC, HouSX (2010) Characterization of midgut stem cell - and enteroblast-specific Gal4 lines in drosophila. Genesis 48 : 607–611.
65. KrejciA, BernardF, HousdenBE, CollinsS, BraySJ (2009) Direct response to Notch activation: signaling crosstalk and incoherent logic. Sci Signal 2: ra1.
66. FehonRG, KoohPJ, RebayI, ReganCL, XuT, et al. (1990) Molecular interactions between the protein products of the neurogenic loci Notch and Delta, two EGF-homologous genes in Drosophila. Cell 61 : 523–534.
67. TheodosiouNA, XuT (1998) Use of FLP/FRT system to study Drosophila development. Methods 14 : 355–365.
68. KatewaSD, KapahiP (2010) Role of TOR signaling in aging and related biological processes in Drosophila melanogaster. Exp Gerontol 46 : 382–390.
69. MaJ, MengY, KwiatkowskiDJ, ChenX, PengH, et al. (2010) Mammalian target of rapamycin regulates murine and human cell differentiation through STAT3/p63/Jagged/Notch cascade. J Clin Invest 120 : 103–114.
70. KarbowniczekM, ZitsermanD, KhabibullinD, HartmanT, YuJ, et al. (2010) The evolutionarily conserved TSC/Rheb pathway activates Notch in tuberous sclerosis complex and Drosophila external sensory organ development. J Clin Invest 120 : 93–102.
71. WangZ, LiY, BanerjeeS, KongD, AhmadA, et al. (2010) Down-regulation of Notch-1 and Jagged-1 inhibits prostate cancer cell growth, migration and invasion, and induces apoptosis via inactivation of Akt, mTOR, and NF-kappaB signaling pathways. J Cell Biochem 109 : 726–736.
72. EffersonCL, WinkelmannCT, WareC, SullivanT, GiampaoliS, et al. (2010) Downregulation of Notch pathway by a gamma-secretase inhibitor attenuates AKT/mammalian target of rapamycin signaling and glucose uptake in an ERBB2 transgenic breast cancer model. Cancer Res 70 : 2476–2484.
73. PearWS (2010) New roles for Notch in tuberous sclerosis. J Clin Invest 120 : 84–87.
74. FisherA, CaudyM (1998) The function of hairy-related bHLH repressor proteins in cell fate decisions. Bioessays 20 : 298–306.
75. LecuyerE, YoshidaH, ParthasarathyN, AlmC, BabakT, et al. (2007) Global analysis of mRNA localization reveals a prominent role in organizing cellular architecture and function. Cell 131 : 174–187.
Štítky
Genetika Reprodukční medicínaČlánek vyšel v časopise
PLOS Genetics
2012 Číslo 11
Nejčtenější v tomto čísle
- Mechanisms Employed by to Prevent Ribonucleotide Incorporation into Genomic DNA by Pol V
- Inference of Population Splits and Mixtures from Genome-Wide Allele Frequency Data
- Zcchc11 Uridylates Mature miRNAs to Enhance Neonatal IGF-1 Expression, Growth, and Survival
- Histone Methyltransferases MES-4 and MET-1 Promote Meiotic Checkpoint Activation in