
Controls of Nucleosome Positioning in the Human Genome
Nucleosomes are important for gene regulation because their arrangement on the genome can control which proteins bind to DNA. Currently, few human nucleosomes are thought to be consistently positioned across cells; however, this has been difficult to assess due to the limited resolution of existing data. We performed paired-end sequencing of micrococcal nuclease-digested chromatin (MNase–seq) from seven lymphoblastoid cell lines and mapped over 3.6 billion MNase–seq fragments to the human genome to create the highest-resolution map of nucleosome occupancy to date in a human cell type. In contrast to previous results, we find that most nucleosomes have more consistent positioning than expected by chance and a substantial fraction (8.7%) of nucleosomes have moderate to strong positioning. In aggregate, nucleosome sequences have 10 bp periodic patterns in dinucleotide frequency and DNase I sensitivity; and, across cells, nucleosomes frequently have translational offsets that are multiples of 10 bp. We estimate that almost half of the genome contains regularly spaced arrays of nucleosomes, which are enriched in active chromatin domains. Single nucleotide polymorphisms that reduce DNase I sensitivity can disrupt the phasing of nucleosome arrays, which indicates that they often result from positioning against a barrier formed by other proteins. However, nucleosome arrays can also be created by DNA sequence alone. The most striking example is an array of over 400 nucleosomes on chromosome 12 that is created by tandem repetition of sequences with strong positioning properties. In summary, a large fraction of nucleosomes are consistently positioned—in some regions because they adopt favored sequence positions, and in other regions because they are forced into specific arrangements by chromatin remodeling or DNA binding proteins.
Published in the journal:
. PLoS Genet 8(11): e32767. doi:10.1371/journal.pgen.1003036
Category:
Research Article
doi:
https://doi.org/10.1371/journal.pgen.1003036
Summary
Nucleosomes are important for gene regulation because their arrangement on the genome can control which proteins bind to DNA. Currently, few human nucleosomes are thought to be consistently positioned across cells; however, this has been difficult to assess due to the limited resolution of existing data. We performed paired-end sequencing of micrococcal nuclease-digested chromatin (MNase–seq) from seven lymphoblastoid cell lines and mapped over 3.6 billion MNase–seq fragments to the human genome to create the highest-resolution map of nucleosome occupancy to date in a human cell type. In contrast to previous results, we find that most nucleosomes have more consistent positioning than expected by chance and a substantial fraction (8.7%) of nucleosomes have moderate to strong positioning. In aggregate, nucleosome sequences have 10 bp periodic patterns in dinucleotide frequency and DNase I sensitivity; and, across cells, nucleosomes frequently have translational offsets that are multiples of 10 bp. We estimate that almost half of the genome contains regularly spaced arrays of nucleosomes, which are enriched in active chromatin domains. Single nucleotide polymorphisms that reduce DNase I sensitivity can disrupt the phasing of nucleosome arrays, which indicates that they often result from positioning against a barrier formed by other proteins. However, nucleosome arrays can also be created by DNA sequence alone. The most striking example is an array of over 400 nucleosomes on chromosome 12 that is created by tandem repetition of sequences with strong positioning properties. In summary, a large fraction of nucleosomes are consistently positioned—in some regions because they adopt favored sequence positions, and in other regions because they are forced into specific arrangements by chromatin remodeling or DNA binding proteins.
Introduction
In eukaryotes, the genome is organized into a compact protein-DNA complex known as chromatin which, at the most fundamental level, consists of a repeating series of nucleosome core “beads” separated by linker DNA “strings” [1]. Each nucleosome core is made up of an octamer of histone proteins, encircled 1.7 times by 147 base pairs of DNA [2]. Since nucleosomes sterically exclude other proteins that bind to DNA, their organization on the genome sequence can dictate which sites are accessible to regulatory factors and transcriptional machinery [3], [4].
Nucleosome organization is described by the translational and rotational positions of nucleosomes [5]. The “translational” position is the stretch of DNA sequence that is wrapped around the nucleosome and can be specified by the genomic location of the nucleosome center. The “rotational” position is the orientation of the DNA helix as it wraps around the nucleosome. Since a single turn of DNA occupies about 10.5 bp, translational positions that are multiples of about 10.5 bp apart have similar rotational positions. Nucleosomes that adopt the same translational position in every cell are said to be “well” or “strongly” positioned and, conversely, those with highly variable positions are considered “weakly” or “fuzzily” positioned [5], [6].
The positioning of nucleosomes is at least partly encoded by the genome, because some DNA sequences energetically favor nucleosome formation more than others [7], [8]. Sequences such as Poly(dA:dT) tracts strongly disfavor nucleosome formation [9]–[12], and GC rich sequences tend to have high nucleosome occupancy [13], [14]. Periodic AA/AT/TA/TT dinucleotides may be particularly amenable to nucleosome formation because they possess an intrinsic curvature that facilitates wrapping around the histone octamer [15]. These dinucleotides also influence the rotational positioning of nucleosomes—AA/AT/TA/TT dinucleotides are favored where the DNA minor groove faces inwards towards the histone surface, and CC/CG/GC/GG dinucleotides are favored where the minor groove faces outwards [5], [15], [16]. In aggregate, these dinucleotides show clear periodic frequencies in nucleosomal sequences obtained in vitro [7], [16], [17], and in vivo from yeast, fly and chicken [5], [15], [16], [18].
Nucleosome organization is also influenced by barriers that exclude nucleosomes from stretches of sequence [19]. For example, barriers can be created by proteins that compete for binding to a sequence [20], or by ATP-dependent chromatin remodelers that actively displace nucleosomes [21]. Additionally, barriers can be created by other strongly-positioned nucleosomes or by sequences that exclude nucleosomes such as poly(dA:dT) tracts [14], [19]. If the density of nucleosomes around a barrier is high, they will form “statistically positioned” arrays with consistent phasing across cells. This occurs because the nucleosome adjacent to the barrier can only occupy positions that do not overlap the barrier. Subsequent nucleosomes are similarly constrained because the second nucleosome cannot overlap the first, the third cannot overlap the second, and so on [22]. Positioned arrays of nucleosomes have been observed around active promoters [11], [14], [18], [23]–[25], around binding sites for the insulator protein CTCF [14], [26], and around binding sites for the repressor protein NRSF [14].
The importance of sequence preferences for nucleosome positioning is controversial, and some authors have argued that the nucleosomes with the strongest positioning are usually directed by cellular machinery such as RNA polymerase, chromatin remodelers, or transcription factors [14], [24], [27]. In the human genome the contributions of sequence preferences and other cellular factors have been difficult to asses because of the limited resolution of existing maps of nucleosome occupancy, which have been generated using high-throughput single-end sequencing of micrococcal nuclease digested chromatin (MNase-seq) [14], [23]. Since the length of MNase digestion fragments varies substantially, the positions of nucleosomes inferred from single-end reads are imprecise. As a consequence, it is not known what fraction of the human genome contains positioned arrays of nucleosomes, and it is difficult to assess the consistency of fine-scale translational or rotational nucleosome positions from the data that are available. The most extensive study of human nucleosome positioning to date reported that a small proportion (20%) of nucleosomes have even weak detectable positioning [14], but this may reflect the limited resolution of the existing data.
To overcome these limitations and assess the strength of nucleosome positioning in the human genome, we performed paired-end MNase-seq on seven human lymphoblastoid cell lines (LCLs) derived from HapMap individuals. LCLs are an ideal model system for this problem because they have been extensively characterized by ENCODE [28], and our lab recently generated high-resolution maps of DNase I sensitivity for them [29], [30]. The HapMap individuals that the LCLs are derived from are almost completely genotyped by the 1000 Genomes Project [31], and we use this information to investigate the impact of genetic variation on nucleosome organization. Our study is the first to employ paired-end MNase-seq in a human model system, and we determine nucleosome positions with much greater precision than previously possible. Our results reveal a surprising consistency in nucleosome positions and illuminate a trade-off between sequence preferences and barriers created by bound transcription factors.
Results
To determine the genomic positions of nucleosomes in seven human lymphoblastoid cell lines (LCLs), we combined micrococcal nuclease (MNase) digestion of chromatin with high-throughput paired-end and single-end DNA sequencing (MNase-seq). MNase preferentially cuts within linker DNA [32], so the size-selected fragments indicate the positions of nucleosomes when they are sequenced and mapped back to the genome [33]. We aligned the paired-end MNase-seq reads to the human genome and calculated the size of each DNA fragment from the separation of the paired reads (mean = 152 bp, SD = 11.5; Figure S1). We also mapped a set of single-end reads, for which we assumed a fragment size of 151 bp (corresponding to the median from the paired-end sequencing). As a quality filter, we discarded fragments of extreme size (outside the central 95% range of 126–184 bp) or poor mapping quality (Q<10). In total, 2.5 billion paired-end and 1.1 billion single-end fragments were retained (Table S1), which corresponds to approximately 240 fragments per nucleosome.
Rotational positioning of human nucleosomes
To study the rotational and fine-scale translational positioning of human nucleosome sequences, we restricted ourselves to 130 million fragments of length 147 bp. Fragments that are substantially longer or shorter than this may result from over - or under-digestion of nucleosomal DNA and provide less precise estimates of individual nucleosome positions. A major advantage of using paired-end sequencing is that large and small fragments can be filtered and the location of nucleosome dyads can be determined much more precisely.
We examined the nucleotide composition of the 147 bp fragments, and found clear 10 base pair periodicities in all 16 dinucleotides (Figure S2); this result is largely unaffected when we correct for MNase cutting bias (Figure 1A). The dinucleotide patterns closely resemble those found in other organisms [5], [15], [16], [18] and in vitro [7], [16], [17], and argue that these dinucleotides are important for the rotational positioning of human nucleosomes in vivo. Note that the aggregate dinucleotide pattern does not necessarily represent any single nucleosome sequence, but instead reflects a preference for dinucleotides to be placed at specific positions along the nucleosome. When we calculate dinucleotide frequencies using our single-end sequences, the periodic dinucleotide pattern is greatly attenuated (Figures S2, S3 and S4), which confirms that we attain greater precision through the use of paired-end reads.

We investigated the sensitivity of nucleosome sequences to nicking by the DNase I enzyme using 3.0 billion experimentally identified DNase I nick sites [30]. Across the mapped 147 bp MNase fragments, there is a 10 base pair periodicity in DNase I nicking and a phase-shift of 2–3 bp between the two strands (Figure 1B). This pattern reflects the three dimensional structure of DNA that is wrapped around the nucleosome core (the minor groove is only accessible to DNase I when it faces outward from the histone surface [34]–[37]), and indicates that a substantial fraction of nucleosomes must have consistent rotational positioning [34].
Unexpectedly, the 10 bp periodicity in DNase I sensitivity extends beyond the putative nucleosome core region into the adjacent linker sequences. This suggests that nucleosomes in different cells often have translational offsets that are multiples of 10 bp. This would maintain their rotational positioning and result in a longer periodic pattern of DNase I sensitivity in aggregate. To look for further evidence of 10 bp offsets in translational positioning, we examined how other 147 bp MNase fragment midpoints are distributed around observed fragment midpoints. To avoid artifacts introduced by the MNase-seq protocol (such as duplicate sequences introduced by amplification), we ascertained midpoints using four cell lines, and examined the distribution of midpoints in the surrounding region using three other cell lines. This procedure reveals a striking periodic pattern, in which nucleosomes are much more likely to be positioned at “in-phase” distances that are multiples of 10 bp from the ascertained dyad (Figure 1C).
Translational positioning of human nucleosomes
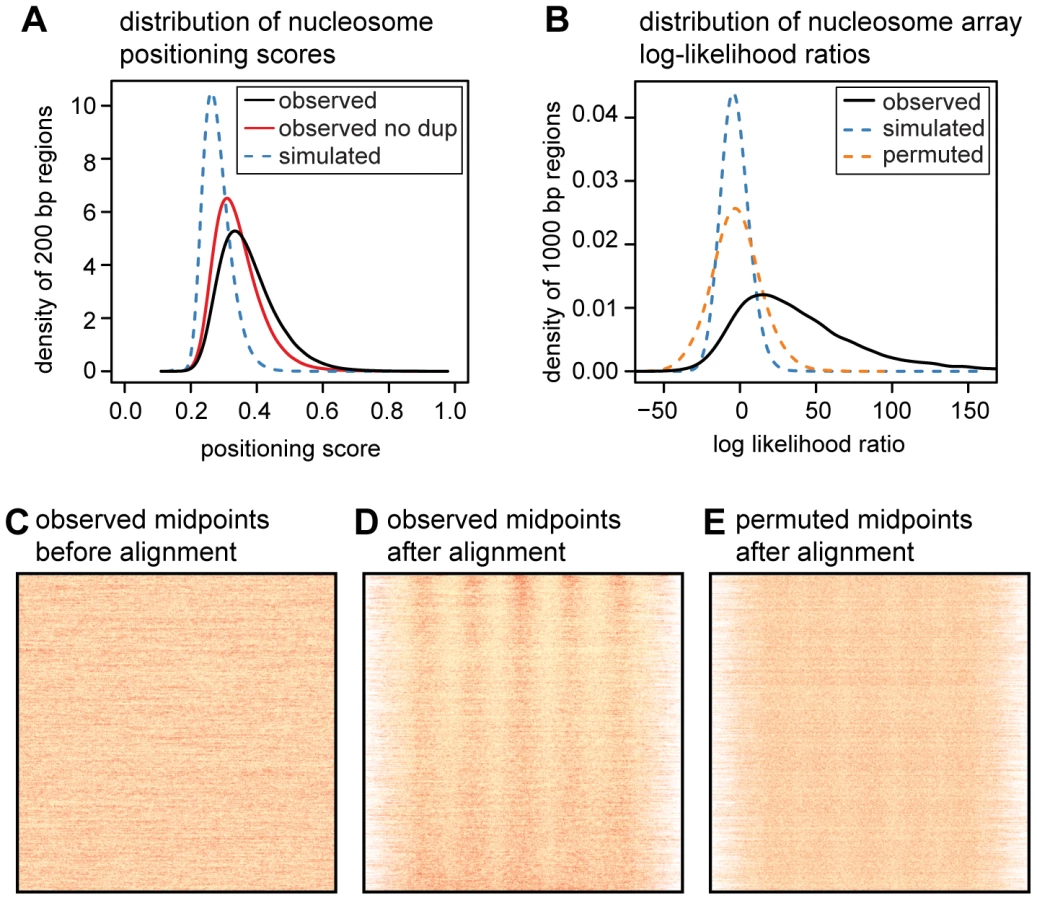
To quantify the translational positioning of nucleosomes we calculated positioning scores for one million randomly sampled 200 bp regions. We define the positioning score for a particular site as the fraction of nearby midpoints (within 100 bp) that are within 15 bp of the site. The score for a given region is then the maximum score across all sites in the region. For the same regions we also calculated positioning scores using simulated midpoints (Figure 2A). The observed scores are skewed towards much higher values than those from simulated midpoints (mean of 0.37 vs. 0.28; p<2.2×10⁻¹⁶, two-sided Mann-Whitney U test), and we estimate that 84% of nucleosomes are more consistently positioned than expected by chance. We compute this estimate after conservatively filtering duplicate read pairs from each MNase-seq library (to avoid amplification artifacts) so the true fraction of nucleosomes with non-random positioning is likely to be even higher. For comparison, we also computed the nucleosome positioning stringency metric of Valouev et al. [14] using both our simulated and observed midpoints (Figures S5 and S6). By comparing the stringency values for real and simulated midpoints, we again estimate that 84% of nucleosomes have stronger positioning than expected by chance (note that in this comparison we did not filter duplicate reads).
While most nucleosomes have non-random positioning, the majority of translational positioning is weak. Using arbitrary score thresholds, we estimate that 81% of human nucleosomes have weak positioning (score between 0.3 and 0.5), 8.4% have moderately strong positioning (score between 0.5 and 0.7), and 0.3% have very strong positioning (score>0.7). This is a large enrichment over simulated midpoints where only 27%, 0.06% and 0.03% of regions meet these criteria (Table S2).
Many nucleosomes are in regularly spaced arrays
We next sought to establish how much of the genome contains consistently positioned arrays of nucleosomes. We randomly sampled 100,000 genomic segments each 1 kb long and removed those where fewer than 80% of the sites were uniquely mappable. We split the remaining 47,528 regions into training and test data sets and estimated parameters for a probabilistic nucleosome array model from the training data. The array model specifies the probability of observing an MNase fragment midpoint at each position of an 879 bp “template” spanning 5 nucleosomes (Figure S7). Under this model, genomic regions with midpoints that match the phase and period of the template will yield the highest likelihoods. We then used a log likelihood ratio (LLR) to assess whether fragment midpoints in each of the 23,763 test regions were distributed uniformly or according to the template. By permuting midpoints in each region we are able to estimate a false discovery rate (FDR) for the log-likelihood ratio statistic. An LLR threshold of 27.8 corresponds to an FDR of 1%, and 53% of our sampled regions exceed this threshold.
As our LLR statistic compares a template model to a uniform model, some fraction of the significant regions may have non-uniform patterns that do not closely resemble nucleosome arrays. It is visually clear, however, that many of the high scoring regions contain evenly spaced arrays of nucleosomes, even those with an LLR close to the 1% FDR threshold (Figure S8). Even after removing the highest scoring nucleosome from each region, 47% of regions still contain a significant template match at an FDR of 1% (Figure S9). If we adopt a more conservative permutation procedure that retains two positioned nucleosomes in each region, we estimate the FDR for the same LLR threshold to be 19% (Figure S10). From these results we conclude that almost half of the genome contains nucleosome arrays, although the estimated proportion is sensitive to the method used and to the definition of what constitutes a nucleosome array.
To better understand what types of genomic regions contain consistently positioned nucleosome arrays we estimated the overlap of the significant arrays (LLR>27.8; FDR<1%) with chromatin states identified from histone marks in human LCLs [38]. Nucleosome arrays are enriched in active insulators, promoters and enhancers, but are depleted within actively elongating genes (Figure S11). However, the majority of regions with significant arrays (72%) are located in the heterochromatin state, which makes up most of the genome and is defined by an absence of histone modifications associated with gene activity, elongation, silencing or CTCF binding [38].
To investigate the contribution of DNA sequence to nucleosome organization within each of these chromatin states, we compared observed nucleosome occupancies to those predicted by an in vitro sequence model that incorporates steric exclusion of overlapping nucleosomes [33]. Observed and predicted nucleosome occupancies are correlated across the 47,527 sampled regions (Spearman's ρ = 0.69, p<2.2×10⁻¹⁶), but the strength of correlation varies widely (Figure S12). The correlation is lowest in the poised promoter (ρ = 0.12) and active promoter states (ρ = 0.37), and is highest in the weak transcription (ρ = 0.69) and heterochromatin (ρ = 0.72) states.
We also performed a scan for regions containing extremely strongly positioned arrays by sliding the nucleosome array template across the genome in 5 bp steps. Windows with low numbers of mapped fragments, or low mappability were removed and overlapping windows with likelihood ratios greater than 50 were merged. This genome-wide scan revealed many striking examples of regularly spaced, consistently positioned nucleosomes (Figure 3). Many of these arrays are adjacent to DNase I hypersensitive sites (Figure 3C), however strong nucleosome arrays also occur in regions without open chromatin. In these regions the DNA sequence itself appears to promote stable nucleosome configurations.

We observed a particularly extreme example of sequence-directed nucleosome positioning near the centromere of chromosome 12. This region spans ∼76 kb and contains over 400 consistently positioned nucleosomes in a single array (Figure 3A, 3B). This remarkable arrangement appears to result from a series of GC-rich sequences with high predicted nucleosome occupancy, which are separated by short AT-rich sequences with low predicted occupancy. This pattern resembles the ‘container elements’ described by Valouev et al. [14] and is created by a large number of degenerate tandem repeats that have periods of either ∼188 bp or ∼377 bp [39]. The periodicity in MNase midpoints does not appear to be an artifact of mappability in the region because the pattern is not observed in midpoints from simulated paired-end reads or in mapped reads from The 1000 Genomes Project (Figure 3B). In aggregate we observe elevated rates of DNase I nicking in the linker sequences of this region, as expected for strongly positioned nucleosomes (Figure S13). We estimate the nucleosome repeat length of the region to be 187 bp, which is slightly shorter than our genome-wide estimate for LCLs (192 bp) (Figure S14). This is also slightly shorter than the nucleosome repeat lengths of granulocytes (193 bp) and CD4+ T cells (203 bp), but matches or exceeds the repeat lengths of some chromatin domains in the latter cell type [14].
Transcription factor binding sites are flanked by nucleosome arrays
We examined the positioning of nucleosomes around transcription factor binding sites, using publicly available chromatin immunoprecipitation followed by sequencing (ChIP-seq) data for 35 different transcription factors in LCLs [28]. So that we could identify nucleosome arrays, while allowing for nucleosome-depleted regions of variable width and uncertain location, we split our nucleosome array template into two mirror-image halves (Figure S7). We then used each half to search for nucleosome arrays upstream and downstream of each ChIP-seq peak. To avoid confounding with the known organization of nucleosomes around core promoters [11], [14], [18], [23]–[25], we examined only those ChIP-seq peaks that were at least 1 kb from a known transcription start site. Although our template is symmetric, recent work suggests that nucleosome organization at many transcription factor binding sites is asymmetric [40], [41].
ChIP-seq peaks with strongly positioned flanking arrays are more sensitive to DNase I digestion and have far more pronounced DNase I footprints (Figure 4). As DNase I sensitivity is correlated with transcription factor occupancy [29], [30], we reasoned that transcription factors are more likely to influence nucleosome positions when their occupancy is high. To examine this relationship, we quantified transcription factor occupancy by ChIP-seq read depth. We ranked ChIP-seq peaks separately for each transcription factor and then aggregated data across transcription factors that fell into the same quintiles. For example, the top 20% of peaks for each factor were included in the same bin. As with DNase I sensitivity, transcription factor occupancy is closely related to the strength of nucleosome positioning (Figure 5A and Figure S15).


In the regions surrounding transcription factor binding sites, predicted occupancy is correlated with observed nucleosome occupancy (Figure 5B). This correlation diminishes with increasing transcription factor occupancy, which argues that the intrinsic sequence affinity of nucleosomes is overridden as transcription factor binding increases (Figure 5B). Even in the regions with the highest transcription factor occupancy, however, there is a detectable periodic pattern in aggregate predicted occupancy (Figure 5B). This pattern mirrors the observed nucleosome occupancy and suggests that nucleosome positions around bound transcription factors are not dictated solely by boundary effects, but are also partly encoded by the genome sequence. Another notable feature is that the ChIP-seq peaks are depleted of nucleosomes despite their high predicted occupancy (Figure 5). This is consistent with the previous observation that regulatory regions have high predicted nucleosome occupancy as a consequence of their high GC content [13], [42].
Single nucleotide polymorphisms can affect the positioning of nucleosome arrays
The above results argue that nucleosome positions are guided by sequence preferences, which are frequently overridden by barriers that are sensitive to DNase I digestion. As a direct test of this hypothesis, we asked whether DNA sequence differences that affect DNase I sensitivity also affect nucleosome positions, using a set of 7088 DNase I sensitivity quantitative trait loci (dsQTLs) [30]. These are regions in which DNase I sensitivity is correlated with the genotype of a single nucleotide polymorphism (SNP). Frequently, the difference in DNase I sensitivity between genotypes is explained by SNPs that disrupt transcription factor binding sites [30].
For each dsQTL we classified each cell line as homozygous sensitive, heterozygous or homozygous insensitive, using the genotype of the associated SNP. We then examined the nucleosome organization of each genotype class by aggregating MNase-seq midpoints across dsQTLs. Regions that are homozygous for the sensitive genotype are flanked by arrays of positioned nucleosomes, consistent with those around ChIP-seq peaks (Figure 6; Figure S16). The strength of positioning is diminished in the heterozygous genotype, and is further reduced in the insensitive genotype (Figure 6).

Discussion
Previous studies have found little evidence for consistent positioning of human nucleosomes [14]. Our data confirm that the translational positioning of most human nucleosomes is weak, but we also find that most nucleosomes are significantly more positioned than expected by chance. Additionally, a substantial fraction of nucleosomes have moderate or strong positioning.
At a fine scale, nucleosomes are often found at alternate “minor” translational positions that are multiples of 10 bp away from their most frequent “major” position. These alternate positions preserve the rotational positioning of the nucleosome on the DNA and are likely to be energetically favored because they retain phase with the periodic nucleosome sequence preferences. Similar offsets in nucleosome positions have been observed in 5S rDNA in vitro [43], [44] and are consistent with a weak 10 bp periodicity in MNase-seq reads from C. elegans [45]. Recently, this finding has been confirmed by chemical mapping of nucleosomes in yeast, which demonstrates that it is not an artifact of digestion by MNase [46].
At a broad scale, nucleosomes are often found in consistently positioned, regularly spaced arrays, which are enriched in insulators, promoters, and enhancers. These arrays frequently flank transcription factor binding sites and are strongest, in aggregate, when DNase I sensitivity and transcription factor occupancy are highest. Additionally, the consistent phasing of nucleosomes flanking DNase I sensitive sites is disrupted by single nucleotide polymorphisms that reduce DNase I sensitivity. This is strong evidence that the positioning of nucleosomes in these regions depends upon a barrier that is created by the binding of non-histone proteins to the DNA. A single nucleotide difference is unlikely to substantially change the affinity of a single nucleosome for a sequence, let alone shift the positions of multiple nucleosomes across a region spanning several thousand bases.
An interesting question is whether a barrier alone is sufficient to create arrays of regularly spaced nucleosomes. Recent results in yeast suggest that this may not be the case. While a minimal in vitro system can reconstitute a nucleosome free region and strongly-positioned +1 nucleosome near the transcription start site, flanking arrays are only formed in the presence of chromatin remodeling complexes and ATP [47], [48]. This argues that chromatin remodelers may pack nucleosomes against barriers or may increase the mobility of nucleosomes such that they can be pushed aside.
While the sequence preferences of nucleosomes are often overridden by other factors in functional regions of the genome, the abundance of nucleosomes with consistent rotational and translational positioning suggest that sequence preferences may play an important role in gene regulation. In particular, sequence-directed organization of nucleosomes may determine whether pioneer transcription factors that recruit chromatin remodelers can bind in the first place.
Methods
Cell lines and nuclei preparation
We studied in vivo nucleosome positioning in lymphoblastoid cell lines derived from seven Yoruba individuals obtained from Coriell (Table S1). Cell lines were cultured in RPMI 1640 media (supplemented with 2 mM L-glutamine and 15% fetal bovine serum) and maintained at a density of between 2–5×10⁵ viable cells/ml as per Coriell recommendations. Cells were pelleted at 1000 rpm at 4°C and washed in ice-cold PBS buffer. The cell pellet was resuspended in ice-cold NP-40 lysis buffer (10 mM Tris [pH 7.4], 10 mM NaCl, 3 mM MgCl2, 0.5% NP-40, 0.15 mM spermine, 0.5 mM spermidine) and incubated on ice for 5 minutes. The solution was centrifuged at 1000 rpm for 3 minutes at 4°C, and then washed in a wash buffer (10 mM Tris [pH 7.4], 15 mM NaCl, 60 mM KCl, 0.15 mM spermine, 0.5 mM spermidine), and centrifuged again at 1000 rpm for 3 minutes at 4°C. 1×10⁸ cells were then resuspended in 10 ml of ice-cold MNase digestion buffer (10 mM Tris [pH 7.4], 15 mM NaCl, 60 mM KCl, 0.15 mM spermine, 0.5 mM spermidine, 1 mM CaCl2).
MNase digestion and DNA extraction
A 1 ml aliquot of nuclei was digested with 7 µl of 50 U/µl MNase at 37°C for 12 minutes. The reaction was stopped by addition of EDTA, SDS and NaCl to an end concentration of 0.01 M, 2% and 0.2 M respectively. Reactions were digested with RNaseA (0.1 mg) for 1 hr at 42°C and further treated with ProteinaseK at 37°C for one hour. DNA was extracted using phenol-chloroform extraction and concentrated by ethanol precipitation. DNA was then run on a 3.3% Nusieve agarose gel at 75 V for 5 hours. 147 bp fragments representing the mononucleosomes were excised from the gel and DNA was extracted from the gel by crushing the gel and soaking in soak buffer (300 mM Sodium Acetate, 1 mM EDTA, 0.1% SDS). The resulting DNA fragments in solution were then purified using a Qiagen PCR purification kit.
Sequencing and read mapping
Our seven libraries of nucleosome fragments were prepared for paired-end sequencing using the standard Illumina protocol. Libraries were sequenced for a total of 36 or 50 cycles (18 bp or 25 bp for each end of the fragment) on either an Illumina Genome Analyzer II or Illumina HiSeq machine. For one flow cell only 25 bp single-end reads were generated due to a problem with the adaptor sequences. We retained the single-end reads for analysis, but also re-sequenced the two affected libraries to obtain a complete complement of paired-end data (Table S1).
We mapped reads to the hg18 assembly of the human genome using BWA (with default arguments) [49] and discarded alignments with mapping quality less than 10. We sorted and indexed alignments using samtools [50] and inferred the distribution of fragment sizes from the separation of read pairs. We discarded paired-end reads if their fragment size fell outside the central 95% of the fragment size distribution (126–184 bp). For paired-end reads the nucleosome dyad position was estimated to be the midpoint of the mapped fragment. For single-end reads, the dyad was assumed to be 75 bp downstream of the 5′ end of each mapped read because the median fragment size of the paired-end reads was 151 bp.
To estimate the number of mapped MNase-seq fragments per nucleosome, we assumed a genome size of 3 billion bases with one nucleosome every 200 bp.
A complete summary of the sequenced libraries is provided in Table S1.
Fine-scale compositional properties of nucleosomes
To examine the fine scale properties of nucleosomes, we restricted our analysis to the 134 million mapped MNase-seq fragments of size 147 bp. To generate Figure 1, we calculated the mean dinucleotide composition, DNase I nick rate and density of MNase-seq fragment midpoints as a function of distance from the midpoints using a sample of 10% of these fragments. The locations of DNase I nicks across 70 lymphoblastoid cell lines were obtained from a previous study [30]. We calculated the density of MNase-seq fragment midpoints from 3 cell lines (GM19193, GM19238, GM19239) around midpoints ascertained using an independent set of 4 cell lines (GM18507, GM18508, GM18516, GM18522).
Correction for mappability and MNase and DNase I cutting bias
MNase has a strong sequence specificity that could bias the positions of nucleosomes inferred using MNase-seq [51], [52] (although results obtained using a different enzyme suggest that this is not a substantial problem [53]). Mappability of reads could also affect our estimates of nucleosome positioning. To address both of these issues, we simulated reads and estimated the expected frequency of MNase midpoints at each position in the genome. Reads were simulated by randomly sampling genomic fragments with sizes drawn from the distribution of observed fragment sizes (Figure S1). We then performed rejection sampling of the fragments so that the 4-mer frequencies at their ends matched those of the real MNase-seq fragments (these positions have the strongest compositional bias (Figure S17)). Using this procedure we simulated 207 million pairs of 18 bp reads and 2.3 billion pairs of 25 bp reads. These numbers were chosen to approximately match the proportions of reads in the real data (Table S1). We mapped the simulated reads back to the genome using BWA and estimated the fragment sizes and midpoint locations using the same procedure that was employed for the real reads.
To correct for MNase cutting bias in Figure 1A, 1C and Figure S13 we calculated expected dinucleotide compositions and MNase-seq midpoint densities from the simulated 147 bp fragments. The simulated fragments were also used to estimate the expected distribution of nucleosome positioning scores and nucleosome array log-likelihood ratios as described below.
To correct for bias in DNase I nicking, we counted occurrences of 6-mers at observed DNase I nick sites. The 6-mers were extracted from positions −3 to +3 around each nick, which have the strongest compositional bias (Figure S18). We estimated an expected nicking rate for each 6-mer by dividing the number of times it occurs at a nick by the number times it occurs in the genome. We normalized observed DNase I nicking rates by dividing by the expected rate at each position (Figure 1B and Figure S13).
Nucleosome positioning scores
To quantify the consistency of nucleosome positioning, we calculated positioning scores for a sample of one million 200 bp genomic regions. We only sampled from regions where at least 80% of the bases are uniquely mappable (defined by the wgEncodeDukeUniqueness24 bp track from the UCSC genome browser) and excluded regions that overlapped segments with excessive 1000 genomes read depth [54].
We defined the positioning score, S(i), at a genomic site i as the fraction of midpoints in a 201 bp window surrounding i that are within 15 bp of i:

As a control, we calculated positioning scores for midpoints from the simulated set of 142–152 bp fragments. To avoid amplification artifacts we also computed scores after conservatively removing duplicate read pairs from each MNase-seq library.
To calculate a FDR for positioning scores, we assigned each sampled region an empirical p-value (the fraction of scores from simulated midpoints that exceeded a region's score calculated from observed non-duplicate read pairs). We used the R package “q-value” [55] to calculate a false discovery rate corresponding to each possible p-value threshold and to estimate the proportion of nulls in the dataset, π0. We then estimated the fraction of nucleosomes showing more consistent positioning than expected by chance as 1-π0.
Sliding window to detect arrays of positioned nucleosomes
We searched for well-ordered nucleosome arrays using a sliding window approach. In each window, we performed a likelihood ratio test that compared a model of a uniform distribution of MNase midpoints in the window (expected under no positioning) to an array model, where MNase midpoints are highly ordered into successive peaks and troughs. We modeled the spatial distribution of midpoints in the window as multinomial distribution, such that the likelihood of the midpoints in a window of k nucleotides is:


To estimate the fraction of the genome that contained nucleosome arrays, we selected 1 kb windows at random from the genome. For each window we slid a symmetric template over central 200 bp of the window in 1 bp increments computing a LLR for each successive step. Our procedure started with the template midpoint at a position 100 bp upstream of the window midpoint and ended with the template midpoint 200 bp downstream of the window midpoint. For each template we used all data in the 1 kb region to compute the LLR.
To align MNase data flanking ChIP-seq peaks we extracted MNase data from 2 kb windows flanking each ChIP-seq peak summit. To identify arrays of nucleosomes upstream and downstream of the peak summit we used two 1 kb nucleosome array templates separated by a nucleosome free region with a size of up to 200 bp. The probability of observing nucleosome midpoints in the nucleosome free region was assumed to be uniform with a rate equal to the mean number of midpoints per site in the region. For each window we estimated the size of the central nucleosome free region to be the one that gave the maximum likelihood. We then aligned all of the regions on the edges of their nucleosome free regions (Figure 4).
We investigated the performance of our array searching method in two ways. First, to assess the effect of mappability and MNase digestion biases we searched for nucleosome arrays in the simulated read data set described above. We extracted simulated reads for each of the 23,763 random 1 kb regions and performed the same array search procedure as for the real data. The distribution of LLRs from simulated read data is shown in Figure 2. Second, we estimated the proportion of “arrays” that may be driven by a single positioned nucleosome (Figure S9). For each of the 26,763 test regions we identified the most strongly positioned nucleosome in the array using a template containing a single positioned nucleosome. We removed this nucleosome and recomputed the LLR. This procedure was then repeated with a permuted data set from which we estimated the FDR.
Chromosome 12 array analysis
To examine aggregate MNase midpoints and DNase I sensitivity in the chromosome 12 array region, we first identified locations of nucleosomes using the following procedure. We identified contiguous regions with nucleosome positioning scores>0.4 as ‘peak regions’ and labeled the position with the maximum score in each region as the peak. We discarded peaks where the score at the peak was less than 0.5, and when multiple positions tied we chose the one closest to the midpoint of the region. Using this method we identified 403 putative nucleosomes within the nucleosome array region (chr12 : 34,376,000–34,452,000), and used these to construct the aggregate plot shown in Figure S13. The locations of MNase midpoint peaks within the aggregate plot was used to estimate the nucleosome repeat length (Figure S14). We used the same procedure to estimate the genome-wide nucleosome repeat length, after aggregating data across a random sample of 200,000 nucleosome score peaks.
Identification of ChIP–seq peaks
We downloaded publicly available ChIP-seq data for 40 transcription factors that were generated for the ENCODE consortium by the Bernstein, Myers and Snyder groups [28]. We removed all reads that had a quality score<10 and called peak locations using MACs [56]. Five transcription factors had a very small number of called peaks and were excluded from our analyses.
Nucleosome organization around dsQTLs
We obtained a list of 7088 DNase I sensitivity quantitative trait loci (dsQTLs) from [30]. For each dsQTL, we labeled each cell line as homozygous sensitive, heterozygous or homozygous insensitive based on the genotype of the associated SNP. Genotypes for the cell lines were previously imputed from the 1000 Genomes Project data using BimBam [30], [31], [57], [58].
To more precisely identify the DNase I sensitive region within each dsQTL, we combined DNase I nick counts from homozygous sensitive and heterozygous cell lines and smoothed them with a 101 bp sliding window. We used the smoothed values to define a “peak” and “sensitive region”. We defined the “peak” as the site with the maximum value within 200 bp of the dsQTL's midpoint and defined the “sensitive region” as the block of contiguous sites around each peak where values exceeded 1/2 the peak value.
We then filtered the dsQTLs as follows. First, we discarded dsQTLs where the edge of the sensitive region was more than 100 bp from the dsQTL's midpoint (n = 396). Second, we filtered dsQTLs where the sensitive region overlapped one from another nearby dsQTL (n = 1463). Finally we discarded dsQTLs where the DNase I values in the peak region were inconsistent with the original, broader dsQTL region. We considered the DNase I values to be inconsistent with the dsQTL if the mean value for the heterozygote was greater than that of the homozygous sensitive genotype, or if the mean value for the homozygous insensitive genotype was greater than either that of the heterozygous or homozygous sensitive genotype. In total 911 dsQTLs were discarded by this latter criterion leaving a total of 4318 for analysis.
To examine the nucleosome organization in the remaining dsQTLs, each region was centered on the midpoint of the identified sensitive region and MNase midpoints were aggregated across regions separately for each of the three possible genotype classes.
Data availability
All MNase-seq data are deposited in GEO under accession number GSE36979 and are available at http://eqtl.uchicago.edu.
Supporting Information
Zdroje
1. KornbergRD (1974) Chromatin structure: a repeating unit of histones and DNA. Science 184 : 868–871.
2. KornbergRD, LorchY (1999) Twenty-five years of the nucleosome, fundamental particle of the eukaryote chromosome. Cell 98 : 285–294.
3. JohnS, SaboPJ, ThurmanRE, SungMH, BiddieSC, et al. (2011) Chromatin accessibility pre-determines glucocorticoid receptor binding patterns. Nat Genet 43 : 264–8.
4. KaplanT, LiXY, SaboPJ, ThomasS, StamatoyannopoulosJA, et al. (2011) Quantitative Models of the Mechanisms That Control Genome-Wide Patterns of Transcription Factor Binding during Early Drosophila Development. PLoS Genet 7: e1001290 doi:10.1371/journal.pgen.1001290.
5. AlbertI, MavrichTN, TomshoLP, QiJ, ZantonSJ, et al. (2007) Translational and rotational settings of H2A.Z nucleosomes across the Saccharomyces cerevisiae genome. Nature 446 : 572–576.
6. KaplanN, HughesTR, LiebJD, WidomJ, SegalE (2010) Contribution of histone sequence preferences to nucleosome organization: proposed definitions and methodology. Genome Biol 11 : 140.
7. LowaryPT, WidomJ (1998) New DNA sequence rules for high affinity binding to histone octamer and sequence-directed nucleosome positioning. J Mol Biol 276 : 19–42.
8. ThåströmA, LowaryPT, WidlundHR, CaoH, KubistaM, et al. (1999) Sequence motifs and free energies of selected natural and non-natural nucleosome positioning DNA sequences. J Mol Biol 288 : 213–229.
9. IyerV, StruhlK (1995) Poly(dA:dT), a ubiquitous promoter element that stimulates transcription via its intrinsic DNA structure. EMBO J 14 : 2570–2579.
10. StruhlK (1985) Naturally occurring poly(dA-dT) sequences are upstream promoter elements for constitutive transcription in yeast. Proc Natl Acad Sci USA 82 : 8419–8423.
11. YuanGC, LiuYJ, DionMF, SlackMD, WuLF, et al. (2005) Genome-scale identification of nucleosome positions in S. cerevisiae. Science 309 : 626–630.
12. FieldY, KaplanN, Fondufe-MittendorfY, MooreIK, SharonE, et al. (2008) Distinct modes of regulation by chromatin encoded through nucleosome positioning signals. PLoS Comput Biol 4: e1000216 doi:10.1371/journal.pcbi.1000216.
13. TilloD, HughesTR (2009) G+C content dominates intrinsic nucleosome occupancy. BMC Bioinformatics 10 : 442.
14. ValouevA, JohnsonSM, BoydSD, SmithCL, FireAZ, et al. (2011) Determinants of nucleosome organization in primary human cells. Nature 474 : 516–520.
15. SatchwellSC, DrewHR, TraversAA (1986) Sequence periodicities in chicken nucleosome core DNA. J Mol Biol 191 : 659–675.
16. SegalE, Fondufe-MittendorfY, ChenL, ThåströmA, FieldY, et al. (2006) A genomic code for nucleosome positioning. Nature 442 : 772–778.
17. WidlundHR, CaoH, SimonssonS, MagnussonE, SimonssonT, et al. (1997) Identification and characterization of genomic nucleosome-positioning sequences. J Mol Biol 267 : 807–817.
18. MavrichTN, JiangC, IoshikhesIP, LiX, VentersBJ, et al. (2008) Nucleosome organization in the Drosophila genome. Nature 453 : 358–362.
19. MavrichTN, IoshikhesIP, VentersBJ, JiangC, TomshoLP, et al. (2008) A barrier nucleosome model for statistical positioning of nucleosomes throughout the yeast genome. Genome Res 18 : 1073–1083.
20. WassonT, HarteminkAJ (2009) An ensemble model of competitive multi-factor binding of the genome. Genome Res 19 : 2101–2112.
21. CairnsBR (2009) The logic of chromatin architecture and remodelling at promoters. Nature 461 : 193–198.
22. KornbergRD, StryerL (1988) Statistical distributions of nucleosomes: nonrandom locations by a stochastic mechanism. Nucleic Acids Research 16 : 6677–6690.
23. SchonesDE, CuiK, CuddapahS, RohTY, BarskiA, et al. (2008) Dynamic regulation of nucleosome positioning in the human genome. Cell 132 : 887–898.
24. ZhangY, MoqtaderiZ, RattnerBP, EuskirchenG, SnyderM, et al. (2009) Intrinsic histone-DNA interactions are not the major determinant of nucleosome positions in vivo. Nat Struct Mol Biol 16 : 847–852.
25. SasakiS, MelloCC, ShimadaA, NakataniY, HashimotoSI, et al. (2009) Chromatin-Associated Periodicity in Genetic Variation Downstream of Transcriptional Start Sites. Science 323 : 401–4.
26. FuY, SinhaM, PetersonCL, WengZ (2008) The insulator binding protein CTCF positions 20 nucleosomes around its binding sites across the human genome. PLoS Genet 4: e1000138 doi:10.1371/journal.pgen.1000138.
27. KaplanN, MooreI, Fondufe-MittendorfY, GossettAJ, TilloD, et al. (2010) Nucleosome sequence preferences influence in vivo nucleosome organization. Nat Struct Mol Biol 17 : 918–20 author reply 920–2.
28. ENCODE Project Consortium (2011) MyersRM, StamatoyannopoulosJ, SnyderM, DunhamI, et al. (2011) A user's guide to the encyclopedia of DNA elements (ENCODE). PLoS Biol 9: e1001046 doi:10.1371/journal.pbio.1001046.
29. Pique-RegiR, DegnerJF, PaiAA, GaffneyDJ, GiladY, et al. (2011) Accurate inference of transcription factor binding from DNA sequence and chromatin accessibility data. Genome Res 21 : 447–55.
30. DegnerJF, PaiAA, Pique-RegiR, VeyrierasJB, GaffneyDJ, et al. (2012) DNase I sensitivity QTLs are a major determinant of human expression variation. Nature 482 : 390–394.
31. Genomes Project Consortium (2010) DurbinRM, AbecasisGR, AltshulerDL, AutonA, et al. (2010) A map of human genome variation from population-scale sequencing. Nature 467 : 1061–1073.
32. NollM (1974) Subunit structure of chromatin. Nature 251 : 249–251.
33. KaplanN, MooreIK, Fondufe-MittendorfY, GossettAJ, TilloD, et al. (2009) The DNA-encoded nucleosome organization of a eukaryotic genome. Nature 458 : 362–366.
34. BoyleAP, DavisS, ShulhaHP, MeltzerP, MarguliesEH, et al. (2008) High-resolution mapping and characterization of open chromatin across the genome. Cell 132 : 311–322.
35. CousinsDJ, IslamSA, SandersonMR, ProykovaYG, Crane-RobinsonC, et al. (2004) Redefinition of the cleavage sites of DNase I on the nucleosome core particle. J Mol Biol 335 : 1199–1211.
36. KlugA, LutterLC (1981) The helical periodicity of DNA on the nucleosome. Nucleic Acids Research 9 : 4267–4283.
37. LutterLC (1979) Precise location of DNase I cutting sites in the nucleosome core determined by high resolution gel electrophoresis. Nucleic Acids Research 6 : 41–56.
38. ErnstJ, KheradpourP, MikkelsenTS, ShoreshN, WardLD, et al. (2011) Mapping and analysis of chromatin state dynamics in nine human cell types. Nature 473 : 43–49.
39. BensonG (1999) Tandem repeats finder: a program to analyze DNA sequences. Nucleic Acids Research 27 : 573–580.
40. KundajeA, Kyriazopoulou-PanagiotopoulouS, LibbrechtM, SmithCL, RahaD, et al. (2012) Ubiquitous heterogeneity and asymmetry of the chromatin environment at regulatory elements. Genome Res 22 : 1735–1747.
41. LaiWK, BuckMJ (2010) ArchAlign: coordinate-free chromatin alignment reveals novel architectures. Genome Biol 11: R126.
42. TilloD, KaplanN, MooreIK, Fondufe-MittendorfY, GossettAJ, et al. (2010) High nucleosome occupancy is encoded at human regulatory sequences. PLoS ONE 5: e9129 doi:10.1371/journal.pone.0009129.
43. PenningsS, MeerssemanG, BradburyEM (1991) Mobility of positioned nucleosomes on 5 S rDNA. J Mol Biol 220 : 101–110.
44. DongF, HansenJC, Van HoldeKE (1990) DNA and protein determinants of nucleosome positioning on sea urchin 5S rRNA gene sequences in vitro. Proc Natl Acad Sci USA 87 : 5724–5728.
45. ValouevA, IchikawaJ, TonthatT, StuartJ, RanadeS, et al. (2008) A high-resolution, nucleosome position map of C. elegans reveals a lack of universal sequence-dictated positioning. Genome Res 18 : 1051–1063.
46. BrogaardK, LiqunX, WangJP, WidomJ (2012) A base pair resolution map of nucleosome positions in yeast. Nature 486 : 496–501.
47. ZhangZ, WippoCJ, WalM, WardE, KorberP, et al. (2011) A packing mechanism for nucleosome organization reconstituted across a eukaryotic genome. Science 332 : 977–980.
48. GkikopoulosT, SchofieldP, SinghV, PinskayaM, MellorJ, et al. (2011) A Role for Snf2-Related Nucleosome-Spacing Enzymes in Genome-Wide Nucleosome Organization. Science 333 : 1758–1760.
49. LiH, DurbinR (2009) Fast and accurate short read alignment with Burrows-Wheeler transform. Bioinformatics 25 : 1754–1760.
50. LiH, HandsakerB, WysokerA, FennellT, RuanJ, et al. (2009) The Sequence Alignment/Map format and SAMtools. Bioinformatics 25 : 2078–2079.
51. ChungHR, DunkelI, HeiseF, LinkeC, KrobitschS, et al. (2010) The effect of micrococcal nuclease digestion on nucleosome positioning data. PLoS ONE 5: e15754 doi:10.1371/journal.pone.0015754.
52. DingwallC, LomonossoffGP, LaskeyRA (1981) High sequence specificity of micrococcal nuclease. Nucleic Acids Research 9 : 2659–2673.
53. AllanJ, FraserRM, Owen-HughesT, Keszenman-PereyraD (2012) Micrococcal nuclease does not substantially bias nucleosome mapping. J Mol Biol 417 : 152–164.
54. PickrellJK, GaffneyDJ, GiladY, PritchardJK (2011) False positive peaks in ChIP-seq and other sequencing-based functional assays caused by unannotated high copy number regions. Bioinformatics 27 : 2144–2146.
55. StoreyJD, TibshiraniR (2003) Statistical significance for genomewide studies. Proc Natl Acad Sci USA 100 : 9440–9445.
56. ZhangY, LiuT, MeyerCA, EeckhouteJ, JohnsonDS, et al. (2008) Model-based analysis of ChIP-Seq (MACS). Genome Biol 9: R137.
57. GuanY, StephensM (2008) Practical issues in imputation-based association mapping. PLoS Genet 4: e1000279 doi:10.1371/journal.pgen.1000279.
58. ScheetP, StephensM (2006) A fast and flexible statistical model for large-scale population genotype data: applications to inferring missing genotypes and haplotypic phase. Am J Hum Genet 78 : 629–644.
Štítky
Genetika Reprodukční medicínaČlánek vyšel v časopise
PLOS Genetics
2012 Číslo 11
Nejčtenější v tomto čísle
- Mechanisms Employed by to Prevent Ribonucleotide Incorporation into Genomic DNA by Pol V
- Inference of Population Splits and Mixtures from Genome-Wide Allele Frequency Data
- Zcchc11 Uridylates Mature miRNAs to Enhance Neonatal IGF-1 Expression, Growth, and Survival
- Histone Methyltransferases MES-4 and MET-1 Promote Meiotic Checkpoint Activation in