
Brain Expression Genome-Wide Association Study (eGWAS) Identifies Human Disease-Associated Variants
Genetic variants that modify brain gene expression may also influence risk for human diseases. We measured expression levels of 24,526 transcripts in brain samples from the cerebellum and temporal cortex of autopsied subjects with Alzheimer's disease (AD, cerebellar n = 197, temporal cortex n = 202) and with other brain pathologies (non–AD, cerebellar n = 177, temporal cortex n = 197). We conducted an expression genome-wide association study (eGWAS) using 213,528 cisSNPs within ±100 kb of the tested transcripts. We identified 2,980 cerebellar cisSNP/transcript level associations (2,596 unique cisSNPs) significant in both ADs and non–ADs (q<0.05, p = 7.70×10⁻⁵–1.67×10−82). Of these, 2,089 were also significant in the temporal cortex (p = 1.85×10⁻⁵–1.70×10−141). The top cerebellar cisSNPs had 2.4-fold enrichment for human disease-associated variants (p<10−6). We identified novel cisSNP/transcript associations for human disease-associated variants, including progressive supranuclear palsy SLCO1A2/rs11568563, Parkinson's disease (PD) MMRN1/rs6532197, Paget's disease OPTN/rs1561570; and we confirmed others, including PD MAPT/rs242557, systemic lupus erythematosus and ulcerative colitis IRF5/rs4728142, and type 1 diabetes mellitus RPS26/rs1701704. In our eGWAS, there was 2.9–3.3 fold enrichment (p<10−6) of significant cisSNPs with suggestive AD–risk association (p<10−3) in the Alzheimer's Disease Genetics Consortium GWAS. These results demonstrate the significant contributions of genetic factors to human brain gene expression, which are reliably detected across different brain regions and pathologies. The significant enrichment of brain cisSNPs among disease-associated variants advocates gene expression changes as a mechanism for many central nervous system (CNS) and non–CNS diseases. Combined assessment of expression and disease GWAS may provide complementary information in discovery of human disease variants with functional implications. Our findings have implications for the design and interpretation of eGWAS in general and the use of brain expression quantitative trait loci in the study of human disease genetics.
Published in the journal:
. PLoS Genet 8(6): e32767. doi:10.1371/journal.pgen.1002707
Category:
Research Article
doi:
https://doi.org/10.1371/journal.pgen.1002707
Summary
Genetic variants that modify brain gene expression may also influence risk for human diseases. We measured expression levels of 24,526 transcripts in brain samples from the cerebellum and temporal cortex of autopsied subjects with Alzheimer's disease (AD, cerebellar n = 197, temporal cortex n = 202) and with other brain pathologies (non–AD, cerebellar n = 177, temporal cortex n = 197). We conducted an expression genome-wide association study (eGWAS) using 213,528 cisSNPs within ±100 kb of the tested transcripts. We identified 2,980 cerebellar cisSNP/transcript level associations (2,596 unique cisSNPs) significant in both ADs and non–ADs (q<0.05, p = 7.70×10⁻⁵–1.67×10−82). Of these, 2,089 were also significant in the temporal cortex (p = 1.85×10⁻⁵–1.70×10−141). The top cerebellar cisSNPs had 2.4-fold enrichment for human disease-associated variants (p<10−6). We identified novel cisSNP/transcript associations for human disease-associated variants, including progressive supranuclear palsy SLCO1A2/rs11568563, Parkinson's disease (PD) MMRN1/rs6532197, Paget's disease OPTN/rs1561570; and we confirmed others, including PD MAPT/rs242557, systemic lupus erythematosus and ulcerative colitis IRF5/rs4728142, and type 1 diabetes mellitus RPS26/rs1701704. In our eGWAS, there was 2.9–3.3 fold enrichment (p<10−6) of significant cisSNPs with suggestive AD–risk association (p<10−3) in the Alzheimer's Disease Genetics Consortium GWAS. These results demonstrate the significant contributions of genetic factors to human brain gene expression, which are reliably detected across different brain regions and pathologies. The significant enrichment of brain cisSNPs among disease-associated variants advocates gene expression changes as a mechanism for many central nervous system (CNS) and non–CNS diseases. Combined assessment of expression and disease GWAS may provide complementary information in discovery of human disease variants with functional implications. Our findings have implications for the design and interpretation of eGWAS in general and the use of brain expression quantitative trait loci in the study of human disease genetics.
Introduction
Expression quantitative trait loci (eQTL) are genomic loci that influence levels of gene transcripts and can be mapped by genetic linkage in families or eGWAS in unrelated populations [1]. eQTLs are distinct from other complex trait loci, because they directly identify the target gene, since the transcript trait is a reflection of the mRNA level from a single gene. Furthermore, eQTLs imply regulation of gene expression as the mechanism of action for the underlying variants. Recently, few studies identified an enrichment of eQTLs from lymphocytes [2] and lymphoblasts [3] amongst human complex disease and trait GWAS loci, suggesting that eQTLs may be useful in mapping human disease-associated variants.
Most human eQTL mapping studies to date assessed immortalized lymphoblastoid cell lines [4], [5], [6], [7], [8], [9], [10], [11], [12] and family-based samples from the CEPH [4], [5], [6], [7], [8], [13] (Centre d'Etude du polymorphisme humain) or HapMap [10], [11], [14], [15] repositories. Multiple other small and large scale eQTL studies investigated other tissues and populations including lymphocytes [16], monocytes [17], T-cells [18], fibroblasts [18], skin [19], subcutaneous and omental adipose tissue [20], [21], bone [22], liver [23] and brain [24], [25].
Despite the assumption that brain eQTLs would also influence human diseases and traits, there are no systematic gene mapping studies for human diseases that utilize brain gene expression phenotypes. Furthermore, the brain region most relevant for such studies and the influence of brain pathology on eQTL mapping studies are largely unknown. To address these issues, we performed an eQTL using cerebellar tissue from 197 subjects with Alzheimer's disease (AD) neuropathology and 177 with other pathologies (non–AD). We validated the results in a different brain region using temporal cortex samples from 202 ADs and 197 non–ADs (Supplementary Tables 1 and 2 in Dataset S1), 85% of whom overlapped with the cerebellar group. We evaluated significant cisSNPs from our study for association with human diseases/traits using a GWAS catalog [26]. We also assessed our significant eGWAS cisSNPs for association with two central nervous system (CNS) diseases, progressive supranuclear palsy (PSP) [27] and AD risk [28], using two recent GWAS for these diseases.
Our results demonstrate the power of the brain eQTL approach in the identification and characterization of many human CNS and non–CNS disease-associated variants. This study also highlights the remarkable reproducibility of human eQTLs across different brain regions and pathologies, which has implications for the design of eGWAS in general. Combined assessment of eQTLs and disease risk loci can be instrumental in mapping disease genes with regulatory variants.
Results
Brain eGWAS
Levels of 24,526 transcripts for 18,401 genes were measured in 773 brain samples from the cerebellum and temporal cortex of ∼200 ADs and ∼200 non–ADs, using WG-DASL assays. Nearly 70% of all probes could be detected in >75% of the samples tested. All autopsied subjects were genotyped for 313,330 single nucleotide polymorphisms (SNPs) from Illumina HumanHap300-Duo Genotyping BeadChips, as part of the Mayo AD GWAS [29]. An eGWAS testing association of transcript levels with cisSNPs was performed using multivariable linear regression correcting for APOE ε4 dosage, age at death, gender and multiple technical variables. False discovery rate (FDR)-based q values [30] (q) were used for corrections of multiple testing.
To achieve internal replication, we first analyzed the ADs and non–ADs separately. In our cerebellar eGWAS, at q<0.05, there were 5,271 significant cisSNP/transcript associations (1,156 unique genes) in the AD, 4,450 (1,022 unique genes) in the non–AD and 10,281 (1,875 unique genes) in the combined datasets. Q-Q plots suggested a clear excess of significant results (Figure 1, Figure S1a–S1d). 2,980 cisSNP/transcript associations (2,596 unique cisSNPs, 686 unique genes) were significant at q<0.05 in both ADs and non–ADs (Table 1, Supplementary Table 3 in Dataset S1, Figure S2). The direction and magnitude of associations in both groups demonstrate remarkable similarities (Pearson's correlation coefficient = 0.98, p<0.0001). The box plots depicted for some of these top associations (Figure S3a–S3c) demonstrate this replication in ADs and non–ADs. Most associations have an additive or dominant pattern with respect to the minor allele.


To assess the genetic component contributing to gene expression variability, we estimated intraclass correlation coefficients (ICC) [31] in the 15 samples measured in replicate on 5–6 different plates and 2–3 different days. Between-subject variance accounted for a median of 60% of total probe expression variance (Supplementary Table 4 in Dataset S1; Figure S4). The 746 probes for the top 2,980 cerebellar cisSNP associations had higher between-subject variance (median = 78%).
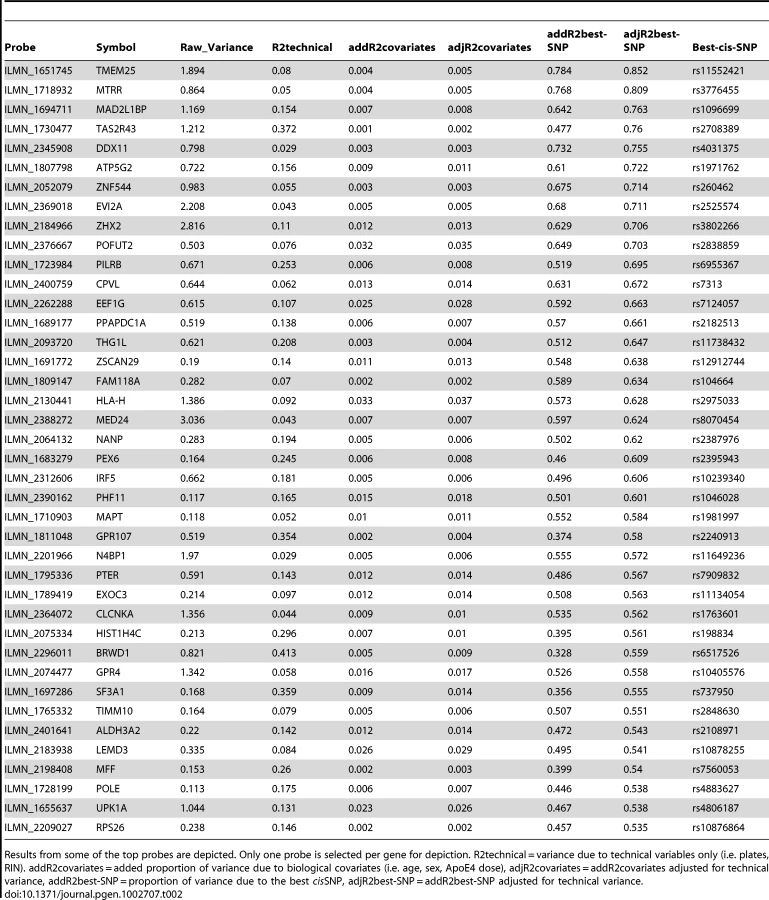
Using multivariable linear regression, we next estimated the percent variation in cerebellar probe expression levels due to the “best” cisSNP for each transcript after accounting for technical and biological covariates. We found that the “best” cisSNP explained a median of ∼3% of the expression variation. For the top 746 probes, the “best” cisSNPs accounted for a median of 18% of the expression variance (Table 2, Supplementary Table 5 in Dataset S1).
The top 2,980 cerebellar eGWAS associations were followed up in the temporal cortex validation study. We found that 2,685 top cerebellar cisSNP/transcript associations could be tested in the temporal cortex (2,387 unique cisSNPs, 677 unique probes and 625 unique genes) (Figure 1, Table 3, Supplementary Table 6 in Dataset S1). A total of 2,089 of these (1,888 unique cisSNPs, 502 unique probes and 471 unique genes) were significant after study-wide Bonferroni corrections, many of which had effect sizes showing remarkable similarity to those from the cerebellar eGWAS (Pearson's correlation coefficient = 0.94, p<0.0001).

The top cerebellar eGWAS results were also compared to published liver [23] and brain [24], [25] eGWAS and overlap was identified for 4–11% of the top transcripts from these published studies (Text S1) Using HapMap2 genotypes, all transcripts and association threshold p<1.0E-4 in our eGWAS, we determined that 24–32% of the top transcripts from the published eGWAS overlapped with ours.
We used the cerebellar eGWAS as the discovery analysis and the temporal cortex eGWAS as the validation; since our goal is to identify significant cisSNP associations while minimizing any confounding factors due to pathology and given the fact that half of our subjects had pathologic AD, in which cerebellum is relatively unaffected whereas temporal cortex is one of the first affected brain regions. Nonetheless, we have also used temporal cortex as the discovery set and cerebellum as the validation, with remarkably similar results (Text S1, Supplementary Tables 7 and 8 in Dataset S1).
Enrichment of brain cisSNPs among human disease-associated SNPs
To examine whether the brain eGWAS approach identified variants implicated in human diseases/traits, we linked the 2,596 top cerebellar eGWAS cisSNPs to the “Catalog of Published GWAS” [26], which compiles weekly search results from all published GWAS of ≥100,000 SNPs where associations of p≤1.0E-05 are reported. We identified 47 cisSNPs that were also associated with 36 diseases/traits (Table 4, Supplementary Table 9 in Dataset S1). This represents a 2.4-fold enrichment of significant cerebellar cisSNPs amongst disease/trait associated SNPs, which is significant (p<10−6) based on simulations adjusted for minor allele frequencies [3] (Text S1).

Among the 36 diseases/traits associating with top cerebellar cisSNPs were central nervous system (CNS)-related conditions including Parkinson's disease (PD), Moyamoya disease, cognitive performance and attention-deficit hyperactivity disorder (ADHD). We both identified novel cisSNP/transcript associations and confirmed some previously reported ones. We found novel associations between rs6532197, which confers increased risk of PD [32], and higher brain levels of MMRN1 (cerebellar eGWAS p = pCer = 4.86×10⁻¹²; temporal cortex eGWAS p = pTCx = 4.57×10⁻⁹). MMRN1 encodes for multimerin and was found to be in a region of duplication/triplication with SNCA (encoding α-synuclein), a well-established risk gene in PD [33]. We found no significant cisSNP/SNCA level associations. These results suggest that MMRN1 may deserve further investigations as an additional PD risk gene.
Another example of a cisSNP which associates with human disease risk is rs8070723, the minor allele of which is associated with reduced risk of PD [32] and reduced brain MAPT levels (pCer = 3.36×10⁻⁷–7.02×10−69; pTCx = 9.03×10⁻⁴–8.61×10−44). Rs11012 minor allele, which confers increased risk of PD [34], showed association with lower brain LRRC37A4 levels (pCer = 1.69×10⁻³³; pTCx = 3.378E−20). MAPT region variants were previously identified to associate with brain levels of MAPT and LRRC37A4 in neurologically normal subjects [27], [32], in a MAPT haplotype H1/H2-dependent manner [27]. Indeed, rs8070723 is in tight linkage disequilibrium with rs1052553 (r2 = 0.95, D′ = 0.97), the major allele of which marks the MAPT-H1 haplotype and associates with higher brain MAPT levels [24].
Many top cerebellar cisSNPs also associate with non–CNS diseases/traits (Supplementary Table 9 in Dataset S1). IRF5 cisSNP rs4728142 is associated with both cerebellar IRF5 levels and risk of systemic lupus erythematosus (SLE) [35]. Previously, IRF variants were shown to influence IRF splicing and expression as well as SLE risk [36], [37]. Interestingly, rs4728142 is also associated with ulcerative colitis (UC) [38] where both IRF5 and TNPO3 are reported as candidate genes. Given its influence on IRF5, but not TNPO3 expression levels, rs4728142 most likely marks IRF5, but not TNPO3 as the candidate UC risk gene.
Our approach to identify human disease-associated SNPs amongst the 2,596 top cerebellar eGWAS cisSNPs may be overly conservative, given our selection criteria to only include transcripts that are detectable in >75% of the subjects and only those cisSNPs that are significant in both independent cohorts (ADs and non–ADs). Furthermore, given that our eGWAS genotyping platform consisted of ∼300 K SNPs, it is plausible that transcript associations with SNPs from the “Catalog of Published GWAS” [26] may be missed if those SNPs did not exist in our platform. To address these issues, we repeated the cerebellar and temporal cortex eGWAS, without restrictions for transcript detection rates and using genotypes imputed to HapMap2 (>2 million SNPs). Comparison of the eGWAS associations with p<1.0E-4 to the “Catalog of Published GWAS” identified 392 unique cerebellar cisSNPs that also associate with 189 human diseases/traits; and 339 such temporal cortex cisSNPs associating with 167 diseases/traits (Text S1, Supplementary Tables 10 and 11 in Dataset S1). Amongst the associations identified by this less stringent approach were those for brain levels of CLU [39], [40], CR1 [40] and GAB2 [41] which were identified as risk loci in GWAS of Alzheimer's disease.
We also performed comparisons of the eGWAS results from the ADs and non–ADs separately to determine whether there were any results unique to these diagnostic groups (Text S1, Supplementary Tables 12, 13, 14, 15 in Dataset S1). Although 13–25% of the disease/trait associations were with cisSNPs that were unique to ADs or non–ADs, all but a few of these could also be identified in the combined analysis of all subjects. There were only 2–7 human diseases/traits with cisSNP associations that were detectable just in ADs or non–ADs, but not the combined group.
Of these unique cisSNP, those that associate with cerebellar levels of C9orf72 in non–ADs are interesting, as these variants were previously identified in GWAS of amyotrophic lateral sclerosis (ALS), where C9orf72 was one of the candidate genes at the disease locus [42], [43]. This gene was recently identified as the most common cause of familial ALS, with a repeat expansion leading to loss of an alternatively spliced transcript [44], [45]. These results further support the utility of the combined eGWAS and disease GWAS approaches in the potential identification of disease genes with modified transcript levels as the plausible disease mechanism.
Identification of brain cisSNPs among PSP GWAS loci
In a recent PSP GWAS [27], four loci near MAPT, STX6, EIF2AK3, and MOBP conferred significant risk, in addition to three suggestive loci at 1q41 intergenic locus, BMS1 and SLCO1A2. We assessed these seven strongest PSP risk loci in our eGWAS in the ADs, non–ADs and combined datasets, as well as the PSP subset of non–ADs (Table 5, Supplementary Table 16 in Dataset S1). We found novel, significant rs11568563 minor allele associations with reduced brain SLCO1A2 levels (pCer = 2.33×10⁻⁸; pTCx = 4.36×10⁻²–9.14×10⁻¹⁸), which confers increased PSP risk [27]. SLCO1A2 encodes solute carrier organic anion transporter family member 1a2 and is a drug transporter into the CNS [46]. Fine-mapping of the SLCO1A2 region revealed rs11568563 to be the strongest cisSNP influencing brain levels of this gene (Figure S5). This SNP was also identified as the top PSP-associating variant at this locus [27]. All other cisSNPs that associate with brain SLCO1A2 levels have weaker effects that appear to be due to their LD with s11568563, which is a missense coding mutation within SLCO1A2. Whether rs11568563 is merely tagging the functional variant(s) regulating levels of SLCO1A2 or coding changes also influence expressed transcript levels require further investigations. Additionally, MAPT/rs242557 minor allele increased PSP risk [27] and brain MAPT levels (pCer = 9.78×10⁻³–8.8×10⁻¹³, pTCx = 1.1×10⁻⁸). MAPT/rs8070723 minor allele associated with lower brain MAPT levels in our eGWAS, decreased PSP risk [27], similar to a PD GWAS [32]. We also found nominally significant increases in brain MOBP levels (pCer = 2.13×10⁻²–1.71×10⁻⁷; pTCx = 1.55×10⁻²–1.57×10⁻⁶) with rs1768208, which increases PSP risk [27].

The recent PSP GWAS by Hoglinger et al. [27] included eQTL analysis for the significant loci using brain expression levels from 387 subjects without clinical neurologic diseases. In addition to associations between MAPT locus cisSNPs with brain MAPT and LRRC37A4 levels, they also detected signals for the nearby ARL17A and PLEKHM1 genes, neither of which were detectable in our eGWAS. They also identified cisSNP associations with brain MOBP levels but even stronger influence on the nearby SLC25A38 levels. We did not identify significant cisSNP/SLC25A38 brain expression associations. Although some of the significant probes for MOBP and MAPT harbor variants within their probe sequence, which may potentially confound associations with expression levels, these genes had other significant probes without any sequence variants (Text S1).
Most non–AD subjects in our study had pathologic diagnosis of PSP (nCer = 98, nTCx = 107, Supplementary Table 2 in Dataset S1). We assessed the 2,980 top cerebellar cisSNP/transcript associations in this subset, and found that most results were consistent with the ADs (Supplementary Tables 17 and 18 in Dataset S1).
Enrichment of brain cisSNPs in the AD GWAS from ADGC
To investigate whether any of the significant brain cisSNPs may influence risk of AD, we compared our eGWAS results to the AD risk associations from the large AD GWAS conducted by ADGC [28]. We obtained results of meta-analyses for the ADGC Stage 1+2 cohort (11,840 LOAD vs. 10,931 controls) [28] and investigated those SNPs with suggestive AD risk association in this dataset (pmeta<10−3). To ensure uniform comparison between our eGWAS and the ADGC GWAS, we assessed results from >2 million SNPs for each study using SNPs genome-wide imputed to HapMap phase 2 (release 22). There were 77,126 cerebellar (63,652 unique SNPs, 2,338 unique genes) and 68,172 temporal cortex (57,922 unique SNPs and 2,201 unique genes) cisSNP/transcript associations significant at q<0.05 representing a clear excess (Figure S6). There were 380 cisSNPs that were significant for the cerebellar transcript associations and also had suggestive AD risk associations (2.9-fold enrichment), 432 such temporal cortex cisSNPs (3.3-fold enrichment) and 356 cisSNPs significant in both the cerebellum and temporal cortex (2.7-fold enrichment, p<10−6 for all three analyses) (Figure 1, Supplementary Tables 19 and 20 in Dataset S1).
MAPT and LRRC37A4 cisSNPs, implicated in PSP [27] and PD [32] GWAS and which significantly influenced brain levels of these genes also had suggestive AD risk associations (pmeta = 8.82×10⁻⁴–1.53×10⁻⁵). CisSNP alleles associating with lower brain MAPT levels were associated with lower AD risk, similar to PD [32] and PSP [27] GWAS, which may suggest a common mechanism for these neurodegenerative diseases. ABCA7, identified recently as a novel LOAD risk locus [28], [47], had significant cerebellar cisSNPs. Further investigations of the other genes with evidence of brain transcript and AD risk association is warranted to understand their role in AD (Text S1).
To ensure that we did not miss any associations due to the stringent eGWAS criteria that we applied, we repeated the analyses using no restrictions for transcript detection rates and eGWAS p value threshold of p<1.0E-4. We also investigated cisSNPs identified in AD and non–AD brains, both separately, and jointly, given that some cisSNP associations may be unique to one group. We compared these eGWAS results to the ADGC GWAS as described above (Supplementary Tables 21, 22, 23, 24, 25, 26 in Dataset S1). Using cerebellar and temporal cortex eGWAS from all subjects, 561 and 488 unique transcripts with cisSNPs that yield suggestive AD risk associations were identified, respectively. There were 259–312 such transcripts identified in each AD or non–AD eGWAS, with >50% overlap between the two diagnostic groups' results, although many of these results could be identified in the eGWAS of combined samples. About 7–10% of the transcripts could only be identified in just ADs or non–ADs, but not the combined eGWAS. Amongst such unique transcripts were CLU and BIN1, which reside at the LOAD GWAS loci [39], [40], [48] and associate with cisSNPs in the cerebellum of non–ADs. Detailed analyses of the CLU locus cisSNP/transcript associations are in-press [49].
Discussion
In a large eQTL study on 773 brain samples from ∼400 autopsied subjects, we demonstrate significant contribution of genetic factors to human brain gene expression, reliably detected across different brain regions and pathologies. There is significant enrichment of brain cisSNPs amongst disease-associated variants, advocating gene expression changes as a mechanism for the first time for certain genes implicated in human diseases, including PSP (SLCO1A2), PD (MMRN1), Paget's disease (OPTN) while replicating others (e.g. PD/MAPT, SLE/UC/IRF5). MAPT cisSNPs associating with PSP, PD and AD risk highlight potential common mechanisms for these neurodegenerative diseases.
The reported results have several important implications for the genetics of human brain gene expression: First, despite technical challenges of gene expression measurements in post-mortem brain tissue [50], ∼70% of the transcriptome can be reliably detected in >75% of the subjects across two brain regions and different disease pathologies. Second, although there is significant contribution from technical covariates, genetic factors account for a substantial proportion of the variance in brain gene expression levels. We estimate that genetic factors explain an average 3% (range: 0–85%) of the variance in human cerebellar gene expression overall, and 18% (range: 8–85%) of the variance for the top cis-regulated transcripts. These estimates show remarkable similarity to those from other eQTL studies, such as a large, family-based lymphocyte eQTL, where cis eQTLs had an overall median effect size of 1.8% and significant eQTLs accounted for 24.6% of the variance in expression [16]. Similarly, significant cisSNPs explained 2–90% of expression variance in a liver eGWAS [23].
Third, there is remarkable replication of significant cisSNP associations across different brain regions and underlying tissue pathologies. Indeed, the 2,980 top cerebellar cisSNP/transcript associations represent 58% and 68%of all significant associations in the ADs and non–ADs. Since >50% of the non–ADs were comprised of subjects with PSP, we also conducted a separate analysis of this pathologically distinct group of non–ADs and again determined that many of the top cisSNPs were also significant in the PSPs despite the small sample size (n = 98). Importantly, most of the cisSNPs had highly similar effect sizes in the ADs, non–ADs and PSP subset of non–ADs. Furthermore, 78% of the top cerebellar cis-associations were also significant in the temporal cortex. Cerebellum is a relatively unaffected region in AD, whereas temporal cortex is typically one of the first areas to harbor neuropathology [51]. It is not inherently evident whether the unaffected or affected tissue regions would be most suitable for eQTL studies. Whereas unaffected regions would have the advantage of minimizing confounding on expression measurements from pathology (such as inflammation and cell death), affected regions may be more relevant for disease-associated eQTL mapping. The substantial overlap in significant cisSNP associations between different brain regions and disease types in our study implies that sample size may be the most critical element of successful eQTL mapping. In other words, analysis of expression data collected in different tissue regions and diseases, provided there is careful statistical control, could greatly enhance power to detect eQTLs. Nevertheless, there may be important eQTLs that are specific to brain region and disease.
It is not obvious whether the cisSNP that display similar effects in different brain regions and different disease types would have relevance to human disease. The top 2,596 cerebellar cisSNPs that are significant in both ADs and non–ADs, and many of which are also significant in the temporal cortex are also enriched for variants implicated in human disease, including CNS disease, such as PD and PSP. Thus, the fourth implication of our study is that it may be possible to map disease-associated variants using eQTL studies conducted in unaffected tissue or unaffected subjects. In addition to providing a general characterization of the genetics of brain gene expression, this study successfully replicated many previously published cisSNP associations, such as rs8070723/ MAPT level, rs11012/ LRRC37A4 level associations, both of which were implicated in PD. We found novel brain expression level associations for transcripts implicated in disease, including rs11568563 association with SLCO1A2, recently identified in a PSP GWAS. The disease-associating cisSNP associations identified in this study were not restricted to CNS diseases, but also included non–CNS diseases, such as SLE, where we replicated the previously published rs4728142/ IRF5 level associations.
These findings imply that many disease-associated cisSNPs can influence gene expression idependently of tissue/region/pathology, and be mapped reliably in tissue which is unaffected, not disease-related or from unaffected subjects. Indeed, our findings are consistent with a study of lymphoblastoid cell lines from subjects affected and unaffected with asthma, where Dixon et al. [12] found no differences between asthmatics and non-asthmatics. Furthermore, they detected significant transcript level associations with SNPs that also associate with asthma. Emilsson et al. [20] performed eQTL mapping in both blood and adipose tissue and determined that >50% of significant adipose tissue cisSNPs were also significant in blood. This is similar to the overlap we detected for cerebellum and temporal cortex, though two brain regions are more likely to have similar eQTL profiles than two different tissues.
Although many cisSNP effects can be detected in many different tissue types and disease conditions as shown here and by others [12], [20], there conceivably exist expression variants which exert their effects in a tissue or disease-specific manner. For example in the eQTL comparing blood and adipose tissue, Emilsson et al. [20] also found that more transcripts from adipose tissue had significant correlations with obesity-related traits. In reality, both scenarios may be at play, such that some expression variants have more ubiquitous effects, whereas others may need tissue/cell/region/disease specific factors to exert their influence on gene expression. Indeed, many of the CNS disease related cisSNP associations in our brain eGWAS could not be identified in our comparison to a liver eGWAS [23] or an existing database for a LCL eGWAS [12], suggesting that disease-relevant tissue may be necessary to detect effects of certain cisSNPs, and highlighting the value of this brain eGWAS for CNS traits/conditions.
Despite the enrichment of our samples with tissue from AD subjects and our use of both cerebellar and temporal cortex tissue, we did not identify strong transcript associations for some of the top genes recently implicated in AD risk in large LOAD GWAS studies [28], [39], [40], [47], [48]. This could be because the AD risk variants in these genes exert their effects via mechanisms other than influencing transcript levels, namely changes in protein conformation. If so, even the negative results from an eGWAS could be informative in guiding the future deep-sequencing efforts which should focus on coding rather than non-coding, functional regions. Alternative explanations include technical shortcomings, such as inability to measure all transcript species, measurements of global rather than cell-specific gene expression, not including all tested disease-associated variants in our genotyping platform. We also need to consider that the top genes nearest the strongest variants from the LOAD GWAS may not be actual disease genes. These loci require further investigations to account for this possibility. Additionally, our criteria for selection of the top cisSNPs, requiring significance in both ADs and non–ADs, might be too stringent, thereby leading to some false negative results. Finally, it may be possible to identify additional disease-related expression variants by focusing on those that have differential influence in disease vs. non-disease tissue, although this was not a focus of analysis in this study. Given that our non–AD tissue also consisted of subjects with other neurodegenerative diseases, there may be more similarities with the AD tissue, making it more difficult to detect variants with differential disease-related expression-associations in our current study. Nevertheless, we did find associations with cisSNPs for ABCA7, a novel AD risk locus gene [28], [47] and MAPT [52], [53], [24], [54] implicated in AD.
It is important to emphasize that although the identification of transcript level associations provides another layer of confidence for disease-associating variants and genes, it is entirely possible that a variant in an LD region encompassing multiple genes, could be marking a functional disease variant in one gene and an expression variant in another gene. Thus, although highly useful in conjunction with disease association studies, eGWAS should be seen as a guide rather than ultimate evidence in disease-mapping efforts. Similarly, absence of eGWAS associations for a disease-associated variant should not be seen as contradictory evidence, but rather raise the possibility of alternative functional mechanisms for that variant.
Despite the wealth of information our study provides, we acknowledge several shortcomings. First, our non–ADs were not normal controls but often had other brain pathologies. It will be necessary to seek replication of these findings or novel cisSNP/transcript associations in normal brain tissue, as well. Second, we only focused on single SNP associations. The preliminary observations from our eGWAS findings suggest that multiple independent variants may affect brain expression levels of some genes, whereas others might be under the influence of a single strong variant. Finally, like any association study, it is not clear whether the cisSNPs identified in our eGWAS are themselves the functional SNPs or simply in LD with un-genotyped regulatory variants. Future studies focusing on analysis of haplotypes, SNPxSNP interactions, novel variant discovery and functional in-vitro studies testing effects of multiple variants are required to dissect the genetic variation underlying brain gene expression levels.
In summary, this cerebellar eGWAS study and the temporal cortex validations provide insight about the genetics of brain gene expression, a framework to guide future studies with respect to tissue/region/disease choice in eQTL studies, examples about the utility of this approach in gene mapping, replication of some known transcript associations and evidence for novel transcript associations in human disease. Combined eGWAS-disease GWAS approach may provide complementary information in mapping human disease and enable identification of functional variants that may not be possible by either approach alone.
The complete set of results from the brain eGWAS can be accessed at the National Institute on Aging Genetics of Alzheimer's Disease Data Storage (NIAGADS) website at http://alois.med.upenn.edu/niagads/. Questions about the dataset can be addressed to the corresponding author of this manuscript (taner.nilufer@mayo.edu).
Methods
Subjects
All subjects were participants in the published Mayo LOAD GWAS [29] as part of the autopsy-based series (AUT_60–80). All subjects had neuropathologic evaluation by DWD. All ADs had definite diagnosis according to the NINCDS-ADRDA criteria [55] and had Braak scores of ≥4.0. All non–ADs had Braak scores of ≤2.5, and many had brain pathology unrelated to AD (Supplementary Tables 1 and 2 in Dataset S1). Three-hundred forty subjects had measurements in both cerebellum and temporal cortex. This study was approved by the appropriate institutional review board.
Expression genome-wide association study (eGWAS)
RNA extraction and gene expression measurements
Total RNA was extracted from frozen brain samples using the Ambion RNAqueous kit according to the manufacturer's instructions. The quantity and quality of the RNA samples were determined by the Agilent 2100 Bioanalyzer using the Agilent RNA 6000 Nano Chip. Transcript levels were measured using the Whole Genome DASL assay (Illumina, San Diego, CA). Probe annotations were done based on NCBI Ref Seq, Build 36.2. The RNA samples were randomized across the chips and plates using a stratified approach to ensure balance with respect to diagnosis, age, gender, RINs and APOE genotype. Replicate samples were utilized for QC and also for intra-class coefficient (ICC) estimations. Raw probe level mRNA expression data were exported from GenomeStudio software (Illumina Inc.) for preprocessing with background correction, variance stabilizing transformation, quantile normalization and probe filtering using the lumi package of BioConductor [56], [57] (Text S1). A probe with detectable signal in >75% of the samples was regarded as informative and used in subsequent analyses, although we also did supplementary analyses without imposing any restrictions based on probe detection levels. The number of informative probes differed slightly between the AD, non–AD and combined groups (Figure S7).
Genome-wide genotyping
Genotypes were generated using Illumina's HumanHap300-Duo Genotyping BeadChips and analyzed with an Illumina BeadLab Station (Illumina, San Diego, CA) at the Mayo Clinic Genotyping Shared Resource according to the manufacturer's protocols. The LOAD GWAS QC methods were previously published [29] (Text S1).
Statistical methods for eGWAS
Linear regression analysis to test for cisSNP/transcript associations were done in PLINK [58]. Preprocessed probe transcript levels were utilized as endophenotypes. Each probe was assessed separately, even though one gene may have multiple probes. CisSNPs localized to ±100 kb flanking region of the gene targeted by the probe of interest, mapped according to NCBI Build 36, were assessed for transcript level associations, using an additive model, with the minor allele dosage (0, 1, 2) as the independent variable, and APOE ε4 dosage (0, 1, 2), age at death, gender, PCR plate, RIN, (RIN-RINmean)2 as covariates. The cerebellum and temporal cortex expression levels were analyzed separately. The ADs and non–ADs were analyzed both separately and jointly. The joint analyses included diagnosis as an additional covariate (AD = 1, non–AD = 0). We also ran analyses including the top 10 eigenvectors from EIGENSTRAT, and compared eGWAS results to those excluding the eigenvectors (Text S1, Figure S8, Supplementary Table 27 in Dataset S1) [59].
Q values used for multiple testing corrections are based on false-discovery rates [30] and were corrected for genomic inflation of significance (Text S1). In addition, permutations (pperm-WY) and Bonferroni adjustment were used for comparison of correction strategies. Permutation p values were obtained by shuffling the endophenotype, while maintaining the covariate structure, 10,000 times and applying the Westfall and Young [60] resampling-style stepdown approach to account for correlations between probes.
Variance of gene expression
To assess the genetic contribution to the variance in human cerebellar gene expression, we first determined between-subject variance, as a percentage of the total variance in probe expression, using ICC [31] for 15 samples measured in replicate on 5–6 different plates and 2–3 different days.
Using multivariable linear regression models, we then calculated the proportion of variance in cerebellar gene expression levels that were explained by technical effects (PCR plate, RIN, (RIN-RINmean)2), biological covariates (APOE ε4 dosage, age at death, gender) and the “best” cisSNP for each probe. These analyses were carried out on the combined dataset consisting of cerebellar expression measurements from 374 subjects and 15,283 probes with at least one cisSNP (Text S1).
Replication of top cerebellar eGWAS hits in the temporal cortex
We identified 2,980 cisSNP/transcript associations (2,596 unique SNPs, 746 unique probes and 686 unique genes) that achieved genome-wide significance within both the ADs and non–ADs analyses with q values<0.05. All 2,980 cisSNP/transcript associations achieved genome-wide significance with q<0.05 and pBonf<0.05 in the combined ADs+non–ADs analysis. We sought validation of these hits in the temporal cortex of 399 subjects who had WG-DASL whole transcriptome measurements and whole-genome genotypes. RNA extractions, QC, WG-DASL measurements, transcript level detections and association analyses were performed for these temporal cortex samples, in the same manner as that for the cerebellar samples. After appropriate QC, 2,685 of the 2,980 top cerebellar cisSNP/transcript associations remained detectable among the temporal cortex results (2,387 unique SNPs, 677 unique probes and 625 unique genes).
Comparison of cerebellar eGWAS results with other published complex disease and trait GWAS
To determine whether the cerebellar eGWAS captured variants implicated in complex diseases/traits, we compared the top 2,980 cerebellar eGWAS cisSNPs with the top disease/trait associated SNPs in the “Catalog of Published GWAS” [26], curated by the National Human Genome Research Institute (www.genome.gov/gwastudies). This catalog compiles weekly search results from all published GWAS of ≥100,000 SNPs where associations of p≤1.0E-05 are reported. The catalog accessed on 04/23/2011 had 5,272 entries. We restricted our search to those entries where the “SNPs” column had only one SNP with an rs number. Thus, haplotypes and variants without rs numbers were excluded. There were 5,101 entries after this exclusion, comprised of 4,248 unique SNPs and 433 unique diseases. One SNP may associate with >1 disease/trait and each disease/trait may have ≥1 associating SNP. This list was linked to the 2,980 top cerebellar cisSNPs by common rs numbers.
To assess whether the number of observed cisSNPs that have both significant cerebellar eGWAS and disease/trait associations represent a significant enrichment, we performed simulations while adjusting for cisSNP minor allele frequencies, as previously reported [3]. We performed 1 million simulations and adjusted for the minor allele frequencies of all the tested cisSNPs in 10 bins from 0–0.05 to 0.45–0.50. Using the total number of cisSNPs that are both transcript and disease/trait associating for each simulation, we obtained an empirical p value and an estimate of fold-enrichment.
Cerebellar eGWAS results were also compared to other published eGWAS results from a human liver [23] and two human brain [24], [25] studies. The methods and results are depicted in Text S1.
Alzheimer's Disease Genetics Consortium (ADGC) meta-analyses
To determine whether any of the cisSNPs significant at q<0.05 influenced risk of AD, we obtained meta-analyses results from the ADGC [28]. The cohorts that are assessed by ADGC, as well as the methodological details of the meta-analyses are described in detail in a recent publication [28]. Briefly, the meta-analyses of the ADGC dataset results reported here (Supplementary Tables 17 and 18 in Dataset S1) are generated from the combined analyses of stage 1 and stage 2 cohorts (Text S1), with detailed descriptions provided elsewhere [28]. Stage 1 cohorts are comprised of 8,309 LOAD cases and 7,366 cognitively normal elder controls. Stage 2 has 3,531 LOAD vs. 3,565 control subjects. Each cohort was tested for AD risk association using a logistic regression approach, assuming an additive model and adjusting for age, sex, APOE ε4 dosage and principal components from EIGENSTRAT [59]. The meta-analyses results were generated using the inverse variance method implemented in the software package METAL [61].
Supporting Information
Zdroje
1. Ertekin-TanerN 2011 Gene expression endophenotypes: a novel approach for gene discovery in Alzheimer's disease. Mol Neurodegener 6 31
2. MurphyAChuJHXuMCareyVJLazarusR 2010 Mapping of numerous disease-associated expression polymorphisms in primary peripheral blood CD4+ lymphocytes. Hum Mol Genet 19 4745 4757
3. NicolaeDLGamazonEZhangWDuanSDolanME 2010 Trait-associated SNPs are more likely to be eQTLs: annotation to enhance discovery from GWAS. PLoS Genet 6 e1000888 doi:10.1371/journal.pgen.1000888
4. SchadtEEMonksSADrakeTALusisAJCheN 2003 Genetics of gene expression surveyed in maize, mouse and man. Nature 422 297 302
5. CheungVGConlinLKWeberTMArcaroMJenKY 2003 Natural variation in human gene expression assessed in lymphoblastoid cells. Nat Genet 33 422 425
6. MorleyMMolonyCMWeberTMDevlinJLEwensKG 2004 Genetic analysis of genome-wide variation in human gene expression. Nature 430 743 747
7. MonksSALeonardsonAZhuHCundiffPPietrusiakP 2004 Genetic inheritance of gene expression in human cell lines. Am J Hum Genet 75 1094 1105
8. CheungVGSpielmanRSEwensKGWeberTMMorleyM 2005 Mapping determinants of human gene expression by regional and genome-wide association. Nature 437 1365 1369
9. StrangerBEForrestMSClarkAGMinichielloMJDeutschS 2005 Genome-wide associations of gene expression variation in humans. PLoS Genet 1 e78 doi:10.1371/journal.pgen.0010078
10. StrangerBENicaACForrestMSDimasABirdCP 2007 Population genomics of human gene expression. Nat Genet 39 1217 1224
11. StrangerBEForrestMSDunningMIngleCEBeazleyC 2007 Relative impact of nucleotide and copy number variation on gene expression phenotypes. Science 315 848 853
12. DixonALLiangLMoffattMFChenWHeathS 2007 A genome-wide association study of global gene expression. Nat Genet 39 1202 1207
13. DaussetJCannHCohenDLathropMLalouelJM 1990 Centre d'etude du polymorphisme humain (CEPH): collaborative genetic mapping of the human genome. Genomics 6 575 577
14. 2005 A haplotype map of the human genome. Nature 437 1299 1320
15. StrangerBEForrestMSClarkAGMinichielloMJDeutschS 2005 Genome-wide associations of gene expression variation in humans. PLoS Genet 1 e78 doi:10.1371/journal.pgen.0010078
16. GoringHHCurranJEJohnsonMPDyerTDCharlesworthJ 2007 Discovery of expression QTLs using large-scale transcriptional profiling in human lymphocytes. Nat Genet 39 1208 1216
17. RotivalMZellerTWildPSMaoucheSSzymczakS 2011 Integrating genome-wide genetic variations and monocyte expression data reveals trans-regulated gene modules in humans. PLoS Genet 7 e1002367 doi:10.1371/journal.pgen.1002367
18. DimasASDeutschSStrangerBEMontgomerySBBorelC 2009 Common regulatory variation impacts gene expression in a cell type-dependent manner. Science 325 1246 1250
19. DingJGudjonssonJELiangLStuartPELiY 2010 Gene expression in skin and lymphoblastoid cells: Refined statistical method reveals extensive overlap in cis-eQTL signals. Am J Hum Genet 87 779 789
20. EmilssonVThorleifssonGZhangBLeonardsonASZinkF 2008 Genetics of gene expression and its effect on disease. Nature 452 423 428
21. ZhongHBeaulaurierJLumPYMolonyCYangX 2010 Liver and adipose expression associated SNPs are enriched for association to type 2 diabetes. PLoS Genet 6 e1000932 doi:10.1371/journal.pgen.1000932
22. GrundbergEAdoueVKwanTGeBDuanQL 2011 Global analysis of the impact of environmental perturbation on cis-regulation of gene expression. PLoS Genet 7 e1001279 doi:10.1371/journal.ppat.1001279
23. SchadtEEMolonyCChudinEHaoKYangX 2008 Mapping the genetic architecture of gene expression in human liver. PLoS Biol 6 e107 doi:10.1371/journal.pbio.0060107
24. MyersAJGibbsJRWebsterJARohrerKZhaoA 2007 A survey of genetic human cortical gene expression. Nat Genet 39 1494 1499
25. WebsterJAGibbsJRClarkeJRayMZhangW 2009 Genetic control of human brain transcript expression in Alzheimer disease. Am J Hum Genet 84 445 458
26. HindorffLASethupathyPJunkinsHARamosEMMehtaJP 2009 Potential etiologic and functional implications of genome-wide association loci for human diseases and traits. Proc Natl Acad Sci U S A 106 9362 9367
27. HoglingerGUMelhemNMDicksonDWSleimanPMWangLS 2011 Identification of common variants influencing risk of the tauopathy progressive supranuclear palsy. Nat Genet 43 699 705
28. NajACJunGBeechamGWWangLSVardarajanBN 2011 Common variants at MS4A4/MS4A6E, CD2AP, CD33 and EPHA1 are associated with late-onset Alzheimer's disease. Nat Genet 43 436 441
29. CarrasquilloMMZouFPankratzVSWilcoxSLMaL 2009 Genetic variation in PCDH11X is associated with susceptibility to late-onset Alzheimer's disease. Nat Genet 41 192 198
30. StoreyJDTibshiraniR 2003 Statistical significance for genomewide studies. Proc Natl Acad Sci U S A 100 9440 9445
31. BarryWTKernagisDNDressmanHKGriffisRJHunterJD 2010 Intratumor heterogeneity and precision of microarray-based predictors of breast cancer biology and clinical outcome. J Clin Oncol 28 2198 2206
32. Simon-SanchezJSchulteCBrasJMSharmaMGibbsJR 2009 Genome-wide association study reveals genetic risk underlying Parkinson's disease. Nat Genet 41 1308 1312
33. FuchsJNilssonCKachergusJMunzMLarssonEM 2007 Phenotypic variation in a large Swedish pedigree due to SNCA duplication and triplication. Neurology 68 916 922
34. EdwardsTLScottWKAlmonteCBurtAPowellEH 2010 Genome-wide association study confirms SNPs in SNCA and the MAPT region as common risk factors for Parkinson disease. Ann Hum Genet 74 97 109
35. HanJWZhengHFCuiYSunLDYeDQ 2009 Genome-wide association study in a Chinese Han population identifies nine new susceptibility loci for systemic lupus erythematosus. Nat Genet 41 1234 1237
36. GrahamRRKozyrevSVBaechlerECReddyMVPlengeRM 2006 A common haplotype of interferon regulatory factor 5 (IRF5) regulates splicing and expression and is associated with increased risk of systemic lupus erythematosus. Nat Genet 38 550 555
37. GrahamRRKyogokuCSigurdssonSVlasovaIADaviesLR 2007 Three functional variants of IFN regulatory factor 5 (IRF5) define risk and protective haplotypes for human lupus. Proc Natl Acad Sci U S A 104 6758 6763
38. AndersonCABoucherGLeesCWFrankeAD'AmatoM 2011 Meta-analysis identifies 29 additional ulcerative colitis risk loci, increasing the number of confirmed associations to 47. Nat Genet 43 246 252
39. HaroldDAbrahamRHollingworthPSimsRGerrishA 2009 Genome-wide association study identifies variants at CLU and PICALM associated with Alzheimer's disease. Nat Genet
40. LambertJCHeathSEvenGCampionDSleegersK 2009 Genome-wide association study identifies variants at CLU and CR1 associated with Alzheimer's disease. Nat Genet 41 1094 1099
41. ReimanEMWebsterJAMyersAJHardyJDunckleyT 2007 GAB2 alleles modify Alzheimer's risk in APOE epsilon4 carriers. Neuron 54 713 720
42. van EsMAVeldinkJHSarisCGBlauwHMvan VughtPW 2009 Genome-wide association study identifies 19p13.3 (UNC13A) and 9p21.2 as susceptibility loci for sporadic amyotrophic lateral sclerosis. Nat Genet 41 1083 1087
43. LaaksovirtaHPeuralinnaTSchymickJCScholzSWLaiSL 2010 Chromosome 9p21 in amyotrophic lateral sclerosis in Finland: a genome-wide association study. Lancet Neurol 9 978 985
44. Dejesus-HernandezMMackenzieIRBoeveBFBoxerALBakerM 2011 Expanded GGGGCC Hexanucleotide Repeat in Noncoding Region of C9ORF72 Causes Chromosome 9p-Linked FTD and ALS. Neuron 72 245 256
45. RentonAEMajounieEWaiteASimon-SanchezJRollinsonS 2011 A hexanucleotide repeat expansion in C9ORF72 is the cause of chromosome 9p21-linked ALS-FTD. Neuron 72 257 268
46. LeeWGlaeserHSmithLHRobertsRLMoeckelGW 2005 Polymorphisms in human organic anion-transporting polypeptide 1A2 (OATP1A2): implications for altered drug disposition and central nervous system drug entry. J Biol Chem 280 9610 9617
47. HollingworthPHaroldDSimsRGerrishALambertJC 2011 Common variants at ABCA7, MS4A6A/MS4A4E, EPHA1, CD33 and CD2AP are associated with Alzheimer's disease. Nat Genet 43 429 435
48. SeshadriSFitzpatrickALIkramMADeStefanoALGudnasonV 2010 Genome-wide analysis of genetic loci associated with Alzheimer disease. JAMA 303 1832 1840
49. AllenMZouFChaiHSYounkinCSCrookJ 2012 Novel late-onset Alzheimer's disease loci variants associate with brain gene expression. Neurology in-press
50. AtzMWalshDCartagenaPLiJEvansS 2007 Methodological considerations for gene expression profiling of human brain. J Neurosci Methods 163 295 309
51. BraakHBraakE 1991 Neuropathological stageing of Alzheimer-related changes. Acta Neuropathol (Berl) 82 239 259
52. CaffreyTMJoachimCParacchiniSEsiriMMWade-MartinsR 2006 Haplotype-specific expression of exon 10 at the human MAPT locus. Hum Mol Genet 15 3529 3537
53. CaffreyTMJoachimCWade-MartinsR 2008 Haplotype-specific expression of the N-terminal exons 2 and 3 at the human MAPT locus. Neurobiol Aging 29 1923 1929
54. MyersAJPittmanAMZhaoASRohrerKKaleemM 2007 The MAPT H1c risk haplotype is associated with increased expression of tau and especially of 4 repeat containing transcripts. Neurobiol Dis 25 561 570
55. McKhannGDrachmanDFolsteinMKatzmanRPriceD 1984 Clinical diagnosis of Alzheimer's disease: report of the NINCDS-ADRDA Work Group under the auspices of Department of Health and Human Services Task Force on Alzheimer's Disease. Neurology 34 939 944
56. DuPKibbeWALinSM 2008 lumi: a pipeline for processing Illumina microarray. Bioinformatics 24 1547 1548
57. LinSMDuPHuberWKibbeWA 2008 Model-based variance-stabilizing transformation for Illumina microarray data. Nucleic Acids Res 36 e11
58. PurcellSNealeBTodd-BrownKThomasLFerreiraMA 2007 PLINK: a tool set for whole-genome association and population-based linkage analyses. Am J Hum Genet 81 559 575
59. PriceALPattersonNJPlengeRMWeinblattMEShadickNA 2006 Principal components analysis corrects for stratification in genome-wide association studies. Nat Genet 38 904 909
60. WestfallPHZaykinDVYoungSS 2002 Multiple tests for genetic effects in association studies. Methods Mol Biol 184 143 168
61. WillerCJLiYAbecasisGR 2010 METAL: fast and efficient meta-analysis of genomewide association scans. Bioinformatics 26 2190 2191
Štítky
Genetika Reprodukční medicínaČlánek vyšel v časopise
PLOS Genetics
2012 Číslo 6
Nejčtenější v tomto čísle
- Rumors of Its Disassembly Have Been Greatly Exaggerated: The Secret Life of the Synaptonemal Complex at the Centromeres
- The NSL Complex Regulates Housekeeping Genes in
- Tipping the Balance in the Powerhouse of the Cell to “Protect” Colorectal Cancer
- Interplay between Synaptonemal Complex, Homologous Recombination, and Centromeres during Mammalian Meiosis