
Partitioning the Heritability of Tourette Syndrome and Obsessive Compulsive Disorder Reveals Differences in Genetic Architecture
The direct estimation of heritability from genome-wide common variant data as implemented in the program Genome-wide Complex Trait Analysis (GCTA) has provided a means to quantify heritability attributable to all interrogated variants. We have quantified the variance in liability to disease explained by all SNPs for two phenotypically-related neurobehavioral disorders, obsessive-compulsive disorder (OCD) and Tourette Syndrome (TS), using GCTA. Our analysis yielded a heritability point estimate of 0.58 (se = 0.09, p = 5.64e-12) for TS, and 0.37 (se = 0.07, p = 1.5e-07) for OCD. In addition, we conducted multiple genomic partitioning analyses to identify genomic elements that concentrate this heritability. We examined genomic architectures of TS and OCD by chromosome, MAF bin, and functional annotations. In addition, we assessed heritability for early onset and adult onset OCD. Among other notable results, we found that SNPs with a minor allele frequency of less than 5% accounted for 21% of the TS heritability and 0% of the OCD heritability. Additionally, we identified a significant contribution to TS and OCD heritability by variants significantly associated with gene expression in two regions of the brain (parietal cortex and cerebellum) for which we had available expression quantitative trait loci (eQTLs). Finally we analyzed the genetic correlation between TS and OCD, revealing a genetic correlation of 0.41 (se = 0.15, p = 0.002). These results are very close to previous heritability estimates for TS and OCD based on twin and family studies, suggesting that very little, if any, heritability is truly missing (i.e., unassayed) from TS and OCD GWAS studies of common variation. The results also indicate that there is some genetic overlap between these two phenotypically-related neuropsychiatric disorders, but suggest that the two disorders have distinct genetic architectures.
Published in the journal:
. PLoS Genet 9(10): e32767. doi:10.1371/journal.pgen.1003864
Category:
Research Article
doi:
https://doi.org/10.1371/journal.pgen.1003864
Summary
The direct estimation of heritability from genome-wide common variant data as implemented in the program Genome-wide Complex Trait Analysis (GCTA) has provided a means to quantify heritability attributable to all interrogated variants. We have quantified the variance in liability to disease explained by all SNPs for two phenotypically-related neurobehavioral disorders, obsessive-compulsive disorder (OCD) and Tourette Syndrome (TS), using GCTA. Our analysis yielded a heritability point estimate of 0.58 (se = 0.09, p = 5.64e-12) for TS, and 0.37 (se = 0.07, p = 1.5e-07) for OCD. In addition, we conducted multiple genomic partitioning analyses to identify genomic elements that concentrate this heritability. We examined genomic architectures of TS and OCD by chromosome, MAF bin, and functional annotations. In addition, we assessed heritability for early onset and adult onset OCD. Among other notable results, we found that SNPs with a minor allele frequency of less than 5% accounted for 21% of the TS heritability and 0% of the OCD heritability. Additionally, we identified a significant contribution to TS and OCD heritability by variants significantly associated with gene expression in two regions of the brain (parietal cortex and cerebellum) for which we had available expression quantitative trait loci (eQTLs). Finally we analyzed the genetic correlation between TS and OCD, revealing a genetic correlation of 0.41 (se = 0.15, p = 0.002). These results are very close to previous heritability estimates for TS and OCD based on twin and family studies, suggesting that very little, if any, heritability is truly missing (i.e., unassayed) from TS and OCD GWAS studies of common variation. The results also indicate that there is some genetic overlap between these two phenotypically-related neuropsychiatric disorders, but suggest that the two disorders have distinct genetic architectures.
Introduction
For most complex traits, DNA sequence variants that meet the genome-wide significance threshold do not explain the majority of the heritability as estimated by twin and family studies [1]. Heritability (broad sense) is defined as the proportion of phenotypic variance accounted for by genotypic variance within a population. Narrow sense heritability is a special case of broad sense heritability and refers to the proportion of phenotypic variance that is due only to additive genetic effects. The limited heritability explained by significant GWAS findings has led to the so-called “missing heritability” dilemma and subsequent hypotheses have been generated for how to capture the heritable factors contributing to human trait variation [2], [3]. However, others have argued that the proportion of heritability explained by “top GWAS hits” is limited by currently available sample sizes and analytic approaches, and that sub-threshold GWAS signals may capture a much larger proportion of heritability [1], [4]. Indeed, under current experimental conditions, genome-wide significant GWAS findings alone are likely to account for a very small proportion of total risk variants for many complex disorders and by extension a small proportion of heritability.
The application of genome-wide estimation of heritability using restricted maximum likelihood (REML) methods has provided a new means to quantify narrow sense heritability attributable to all interrogated variants in GWAS [5]. This approach, as implemented in the Genome-wide Complex Trait Analysis (GCTA) package, has been utilized to study a number of complex human phenotypes including autism, schizophrenia, height, Parkinson's disease, type 2 diabetes, and hypertension, and has shown that a significant proportion of genetic risk undiscovered by GWAS was nevertheless detectable by REML heritability approaches [5], [6], [7], [8].
Tourette Syndrome (TS) and obsessive-compulsive disorder (OCD) are neurodevelopmental disorders with overlapping neural circuitries and similarities in phenotypic expression [9], [10], [11]. Neuroimaging studies have implicated specific brain regions, i.e. the ventromedial prefrontal cortex (VMPFC), anterior cingulate cortex (ACC), orbitofrontal cortex (OFC), parietal cortex and somatosensory cortex, along with the striatum and the thalamus, as being involved in the pathophysiology of both OCD and TS [12]. These brain regions are interconnected in multiple recurrent loops, making up the cortico-striatal-thalamo-cortical (CSTC) circuitry, and are thought to be involved in action selection, performance monitoring, response inhibition, and goal-directed behaviors [13], [14]. Both TS and OCD have a strong familial component, and often co-occur within families. Multiple studies have suggested that OCD and TS are both highly heritable (h2 = 27%–45% adult onset OCD; 65% for childhood onset OCD, h2 = 60% for TS) and likely to be genetically related [15]–[18], [19], [20], [21], [22], [23]–[25], [26], [27], [28], [29]. For review of TS heritability studies see Scharf and Pauls, 2007.
This study sought to quantify the heritability of both TS and OCD using genome wide genotype data and the REML approach implemented in GCTA [5]. Here we present results from a comprehensive heritability study of these disorders using thorough and stringent quality controls. In addition to obtaining a direct genetic estimate of total heritability for each trait, we also examined the genetic architectures of TS and OCD by partitioning genetic variation according to minor allele frequency, chromosome, and functional annotation. Functional annotations included annotation by genic regions as well as annotation of SNPs correlated with gene expression in parietal cortex and cerebellum, two brain regions for which we had previously generated eQTL data. In addition, we assessed heritability for early onset and adult onset OCD. Lastly, we conducted a bivariate analysis to examine the genetic correlation between OCD and TS.
Methods
Ethics Statement
All participants 18 years of age and older gave informed consent. Individuals under 18 years of age gave assent after a parent signed a consent form on their behalf. The Ethics Committees of each participating site approved this research and the research was conducted in accordance with the Declaration of Helsinki.
Sample
The datasets used in this study are described in depth elsewhere [30], [31]. Briefly, DNA from individuals with TS or OCD and from controls was randomized across plates and genotyped using the Illumina Human610-Quad genotyping array. Additional unscreened controls that were genotyped as a part of the SAGE (genotyped on Illumina HumanHap1Mv1_C) and iControl (genotyped on Illumina HumanHap550v1/v3) datasets were also included in this study. To reduce effects of population stratification, subjects were limited to those with genetically defined European ancestry, based on principal components clustering analysis using genome-wide pairwise identity-by-descent (IBD) information as estimated with EIGENSTRAT 3.0 [32] and including previously defined European population samples as reference (HapMap3.0).
Quality Control
The first phase of quality control analyses, including assessment of Hardy-Weinberg equilibrium, differential missingness, platform effects, population stratification, and genotyping call rate, was conducted as a part of the recently published GWAS of OCD and TS [30], [31]. The variance components models in the REML analysis utilized all unpruned genotype data simultaneously. Because all genotypes are fitted together in a given variance component, these components are particularly susceptible to minor technical and experimental artifacts that might only modestly affect each genotype (i.e., in a SNP-by-SNP test of association) but could have a substantial cumulative global effect on the results from a mixed linear model. We thus undertook additional, more stringent quality control measures to minimize any possible persistent population stratification and experimental bias. Prior to case-control comparisons, we first focused solely on the control dataset to develop our QC pipeline. We split the controls by data source (iControl vs. SAGE controls) and performed the following QC steps using PLINK. We implemented stringent thresholds and removed additional SNPs showing low levels of differential missingness between cases and controls (p<0.05), modest deviation from Hardy-Weinberg expectation (p<0.05), and significant platform effect after adjustment for all ten principal components (p<0.001). In addition, individuals with genotype call rate <99.9%, or with a high degree of relatedness (pi-hat>0.05) were removed (Table S1). To assess any residual cross-platform artifacts that might artificially elevate the heritability estimate, we conducted a dummy case-control GWAS by assigning case status to the iControl data (N = 1,104) and control status to the SAGE Controls (N = 2,190). We detected no significant association with platform “phenotype” by logistic regression (Figure S1) or “heritability” between cross-platform controls (h2 = 10−6, se = 0.11) (Table S2). Additionally, we analyzed ten permutations of the dummy case phenotype and detected no significant heritability in any permuted analysis. In addition to these QC steps, we examined the data for any possible residual population stratification or cryptic relatedness, which is described in depth in the Supplementary Methods (Figures S1, S2, S3, S4). The quality control and matching steps resulted in a final data set of 617 TS cases and 4,116 TS controls genotyped on 393,387 SNPs, as well as 1,061 OCD cases and 4,236 OCD controls genotyped on 373,846 SNPs. Each analysis included the top 20 principal components as covariates.
Heritability Analysis
For each analysis presented, GCTA v1.2 ([5]; www.complextraitgenomics.com) was used to create a genetic relationship matrix (GRM) file containing IBD relationship calculations for all pair-wise sets of individuals. Principal components were determined within GCTA, using all genotype data, and the top 20 principal components were applied to each analysis. The REML analysis was then performed using the respective GRMs and principal component quantitative covariates. As this analysis was performed with dichotomous case/control traits, it was necessary to convert the phenotypic variance to an underlying liability scale. This conversion uses population prevalence to adjust for case/control ascertainment in the sample and to modify the phenotypic variance estimate accordingly [4]. We conducted primary analyses using 2.5% for OCD prevalence and 0.8% for TS. As a range of prevalence estimates for both OCD and TS are frequently reported, we conducted additional sensitivity analyses to examine the heritability estimates for TS and OCD across a range of reported prevalences (Table S3) [33], [34], [35], [36]. Additionally, we provide heritability results converted to the sibling relative risk scale for further interpretation (Table S4). We conducted three primary analyses (univariate TS heritability, univariate OCD heritability, joint OCD and TS bivariate analysis) and five exploratory analyses (partitioning by chromosome, MAF, genic annotation, brain eQTL annotation, age of onset). For each primary analysis, ten permutations of the phenotype were performed and GCTA was run on each permutation to observe the stability of the heritability estimate.
Bivariate OCD and TS Analysis
In addition, we calculated the genetic correlation between OCD and TS using the GCTA bivariate REML analysis. We split the shared control sample between the TS cases and the OCD cases in a manner that preserved the matched ancestry structure and the proportion of cases to controls for each disorder. An initial analysis included co-morbid TS and OCD cases assigned to either the TS or OCD samples based on their primary diagnosis as determined by the clinical team. We conducted a secondary bivariate analysis limiting the SNPs included to a subset of SNPs previously identified as regulators of gene expression in the brain. A final sensitivity analysis was conducted after removing all 316 case samples with known overlapping comorbidity (83 OCD samples with TS or chronic tics, and 233 TS samples with OCD) to assess the effect of co-morbidity on the cross-disorder genetic correlation. We then applied a likelihood ratio test (LRT) to determine the statistical significance of each genetic correlation.
Imputation Analysis
Imputation was performed using IMPUTE v2.1.2 and the 1000 Genomes Project data as a reference panel. Only imputed SNPs that were in strong linkage disequilibrium (LD) (info>0.6) with genotyped SNPs and had a high certainty (>90%) of the predicted genotypes were retained. Imputed SNPs that showed significant genotyping platform effects were excluded. Imputed results were converted to MaCH format (i.e., .mldose, .mlinfo) using an in-house script. MaCH dosage data was used to create GRMs for each chromosome. Chromosome specific GRMs were then merged as needed for additional analyses. The total number of imputed SNPs after QC included 7,657,106 SNPs in both the TS and OCD samples.
Partitioning Heritability
By chromosome
A separate GRM was generated for each chromosome. Each GRM was then run in separate REML analysis. An additional analysis was conducted in which all chromosomes were modeled jointly in a single REML analysis.
By minor allele frequency
We chose not to employ a minor allele frequency (MAF) cutoff in any of the heritability analyses. This decision was based on the observation that minor allele frequency cutoffs did not alter estimates of heritability for the control-control analysis after establishment of stringent differential missingness rates and call rate. We partitioned the directly genotyped and imputed variants according to MAF bin. For the directly genotyped variants we created six bins representing MAFs from 0.001–.05, >0.05–0.1, >.1–.2, >.2–.3, >.3–.4, and >.4–.5 and generated GRMs for each bin. For the imputed genotypes we created two bins representing MAF 0.001–0.05 and >0.05 to 0.5 and generated GRMs for each bin. For each set of variants (directly genotyped and imputed respectively) we then combined binned GRMs in a single joint REML analysis, allowing the effects of LD to be partitioned by the REML analytic approach.
By functional annotation
We annotated variants for genic and intergenic classification using ANNOVAR (hg18, refGene) [37]. Genic variants included all those variants annotated to exons, introns, UTRs and splice sites. Intergenic variants included those not otherwise annotated as genic. Additionally, we annotated directly genotyped and imputed SNPs that we had previously identified as significantly associated with gene expression (p<0.001) in parietal cortex, (GSE35977), cerebellum (GSE35974), and skeletal muscle (GSE40234). Details of the eQTL detection are described in supplementary methods and in previous publications [38]–[45]. Three sets of analyses were conducted using the eQTL annotations. The first analysis simply partitioned the parietal eQTLs and cerebellar eQTLs from their respective complements for all imputed SNPs. The second model included four partitions: 1) brain only eQTLs (those found in cerebellum or parietal tissues but not in muscle), 2) muscle only eQTLs (those found in muscle and not in either brain tissue), 3) eQTLs common to brain and muscle, and 4) a final partition with non-eQTL SNPs. The last analysis included four total partitions to accommodate eQTLs exclusive to each brain tissue (cerebellum and parietal) as well as eQTLs found in both brain tissues, and the remainder of all imputed SNPs. Annotations were applied to the TS and OCD case/control data and used to create partitions. This resulted in a total of four separate annotation-based REML analyses. For each analysis, we created a single GRM for each partition. Finally, for each analysis, we included the functional variant GRM(s) and the respective complement GRM together in one joint REML analysis.
Age of onset subset (OCD)
Multiple studies have reported significantly higher heritability for early-onset OCD than for adult onset OCD [16], [46]. Hanna and colleagues (2005) [47] suggested a possible threshold of 14 years to define early-onset OCD, however, as our data was collected retrospectively, potentially introducing a recall bias, we chose to employ a conservative threshold for early-onset of symptoms or diagnosis at age 16. We sought to test the hypothesis that early-onset OCD is more highly heritable than adult-onset OCD by dividing the OCD sample based on symptom onset or age at diagnosis (≤16 = early onset, >16 = adult-onset). A total of 732 cases were diagnosed or reported symptom onset prior to age 16 and were considered early onset. A total of 267 cases were diagnosed or exhibited symptoms later than age 16 and were classified as adult onset. Age of onset data was missing for 62 cases. GCTA analysis was performed on both subsets of samples.
Results
Univariate Heritability Analyses of TS and OCD
Analysis of the control datasets split by platform demonstrated no artifactual “cross-platform” heritability (h2 = 0.000001; se = 0.11, p = 0.5) (Table S2). The overall narrow-sense heritability for TS calculated using the directly genotyped data of 617 TS cases and 4,116 controls was 0.58 (se = 0.09, p = 5.64e-12) and for OCD (1,061 cases, 4,236 controls) was 0.37(se = 0.07, p = 1.5e-07) (Table 1). In order to test for possible inflation in the TS heritability point estimate due to small sample size, the OCD analysis was repeated using a random set of 617 OCD cases that matched the TS sample size. This experiment yielded a near-identical heritability point estimate for OCD with an expected increase in the standard error (h2 = 0.36; se = 0.12, p = 0.0009). For each primary analysis, ten permutations of the phenotype were conducted as an additional control, yielding on average no significant heritability (h2TS = 0.06, se = 0.07, p = 0.3; h2OCD = 0.06, se = 0.08, p = 0.3). Analyses were also conducted on imputed data, resulting in similar estimates of heritability for TS (0.48, se = 0.09, p = 3.0e-08) and OCD (0.32, se = 0.07, p = 7e-06).

Genetic Correlation between TS and OCD
A bivariate analysis of the TS and OCD samples using directly genotyped data yielded similar estimates for the heritability of TS (0.51, se = 0.10) and OCD (0.43, se = 0.08). The genetic correlation between the two disorders was 0.41 (se = 0.15), which was significantly different from zero (LRT = 7.98; p = 0.002). We conducted an exploratory bivariate analysis which limited the included SNPs to eQTLs identified in parietal cortex or cerebellum and found a genetic correlation of 0.31 (se = 0.17) which was also significantly different from zero (LRT = 3.62, p = 0.03). Our assessment of the impact of overlapping phenotypic co-morbidity on the estimate of genetic correlation resulted in a smaller, yet purer set of samples (after removing 316 samples with known TS/tic and OCD co-morbidity) and yielded a genetic correlation of 0.50 (se = 0.29; LRT = 4.08; p = 0.02).
Partitioned Analysis by Chromosome
For both the TS and OCD phenotypes, the summed total of individual “by chromosome” heritability estimates (h2TS = 0.61, h2OCD = 0.35) were not different than the global univariate heritability estimates (h2TS = 0.58, h2OCD = 0.37) (Table S5 and S6). These results suggest that population stratification was appropriately controlled in these analyses.
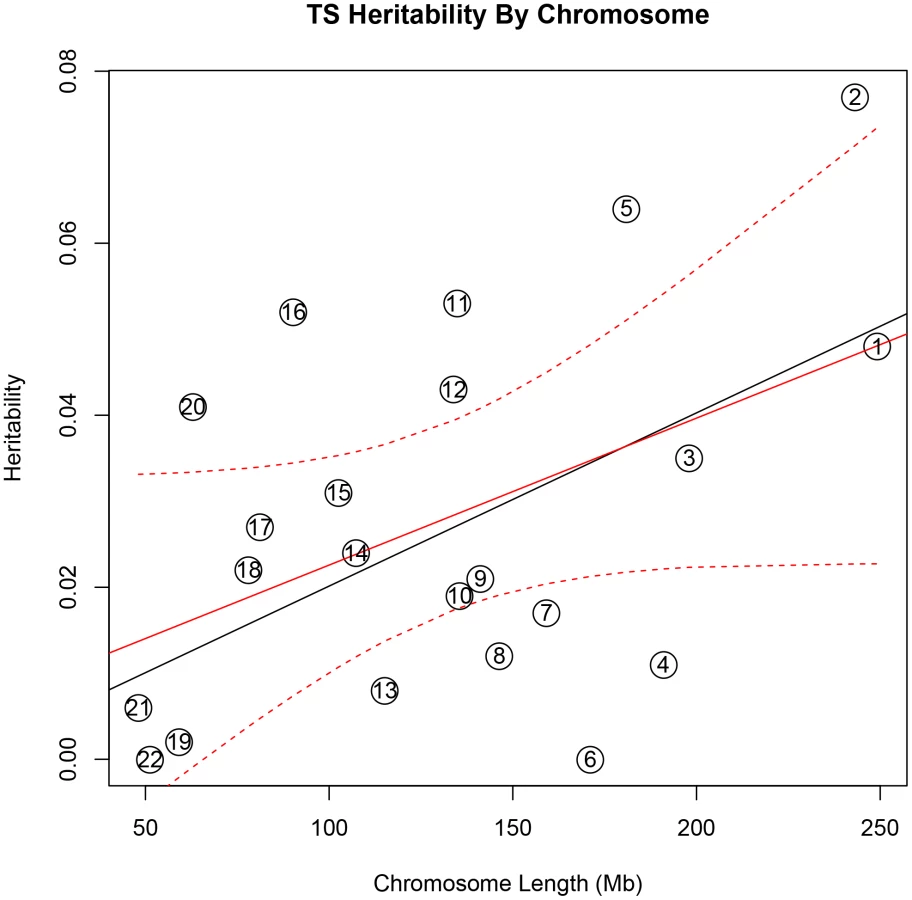
In addition, there was a significant correlation between both chromosome length and heritability (r = 0.46, p = 0.03), and number of genes per chromosome and heritability (r = 0.61, p = 0.002) in the TS data (Figure 1). The correlations detected between heritability and chromosome length (r = 0.35, p = 0.11) or between number of genes and heritability (r = 0.38, p = 0.08) for OCD did not reach statistical significance (Figure 2).

To test individual chromosomes for any significant concentration of heritability beyond that expected by chromosome length, SNP number, or gene number, we calculated the expected proportion of heritability for each chromosome based on the number of SNPs (in our data) as well as the number of genes (from SangerVega) on each chromosome, assuming a polygenic model with a uniform distribution of heritability across the genome. A comparative plot of observed “by chromosome” heritability relative to the expected heritability under the uniform distribution model demonstrated that chromosome 15 harbored a larger proportion of heritability for OCD than expected based on either the number of SNPs or number of genes represented on the chromosome (Figures S5 and S6). When chromosome 15 was removed, a significant correlation between chromosome length and heritability was recovered (r = 0.44, p = 0.05). Greater than expected heritability per chromosome was discovered in the TS data for chromosomes 2, 5, 11, 16 and 20 (Figures S7and S8). In addition, some chromosomes contributed less heritability to OCD than expected due to chromosome length alone. Notably chromosome 6, which houses the HLA locus, did not contribute to overall heritability estimates in OCD or TS.
Analysis by Minor Allele Frequency (MAF)
We identified a significant difference between TS and OCD in the proportion of heritability accounted for by variants with MAF<0.05 (Table 2, Figure 3). This result was observed in both the directly genotyped data and imputed data. Using the directly genotyped data, TS SNPs with MAF<0.05 (N = 20,316; 5.3% of all directly genotyped SNPs) represented 21% (0.13, se = 0.04) of the total calculated heritability, while OCD SNPs with MAF<0.05 (N = 19,605; 5.2% of all directly genotyped SNPs) represented 0% (0.000001, se = 0.01) of the total calculated heritability. Similar results were observed using the imputed data, with approximately 30% of the total heritability of TS captured by variants with MAF<0.05 (N = 2,243,744; 30% of all imputed SNPs) and 0% of the total heritability of OCD captured by variants with MAF<0.05 (2,357,568; 30% of all imputed SNPs).


Analysis by Annotation Classification
In the analysis of directly genotyped data, we found that genic variants accounted for 53% (0.30, se = 0.07; p = 0.008) of the total TS heritability and 40% (h2 = 0.15, se = 0.06, p = 0.003) of the total OCD heritability (Table S7). In the analysis of imputed data, parietal lobe eQTLs accounted for 28% (h2 = 0.13, se = 0.08; p = 0.03) of the total TS heritability and 29% (h2 = 0.09, se = 0.06; p = 0.1) of the total OCD heritability. Cerebellar eQTLs accounted for 35% (h2 = 0.11, se = 0.06; p = 0.02) of the total OCD heritability but only 19% (h2 = 0.09, se = 0.07; p = 0.1) of the total TS heritability (Table 3). When the brain eQTLs were further subdivided into parietal “only”, cerebellum “only” and those present in parietal lobe and cerebellum we found that ∼25% of both TS and OCD heritability was accounted for by parietal eQTLs, ∼10% of both TS and OCD heritability was accounted for by eQTLs found in both tissues, and that cerebellar eQTLs again accounted for more heritability (20%) in OCD than in TS (9%) (Table S8, Figure S9). We then tested a final model in which brain eQTLs from cerebellum and parietal tissues were combined into a single “brain-only” partition, and included in the same joint analysis with muscle eQTLs, eQTL found in both brain and muscle, and a non-eQTL partition. In this model, brain eQTLs accounted for 33% (h2 = 0.16, se = 0.10, p = 0.06) of the total TS heritability and 59% (h2 = 0.19, se = 0.08, p = 0.009) of the total heritability for OCD. Skeletal muscle eQTLs accounted for 25% (h2 = 0.12; se = 0.10; p = 0.1) of the total TS heritability and 25% (h2 = 0.08; se = 0.09; p = 0.2) of the total heritability for OCD. The overlapping set of eQTLs identified in both muscle and brain accounted for 8% heritability in TS (h2 = 0.04; se = 0.08; p = 0.3) and 0% (h2 = 0.0000001; se = 0.06; p = 0.5) of total OCD heritability. Finally, the remaining non-eQTL portion of SNPs accounted for only 34% (h2 = 0.16; se = 0.16; p = 0.2) of TS heritability and 16% (h2 = 0.05; se = 0.08; p = 0.3) of OCD heritability (Table S9, Figure S10).

Age of Onset (OCD only)
It has been observed that early-onset OCD is more heritable (h2 = 45–65%) than adult-onset OCD (h2 = 27–47%) [16], [46]. To test this hypothesis in our data, the OCD sample was divided by age of diagnosis into early-onset (<16 years), yielding 732 case samples with early-onset OCD, and 267 case samples with adult-onset OCD. The heritability for early-onset OCD was 0.43 (se = 0.10) and for adult-onset was 0.26 (se = 0.24)(Table 1).
Discussion
GCTA has now been applied to a number of complex traits, including TS and OCD (Table S10). Results from all of these analyses show that common interrogated variants account for a significant proportion of heritability estimated from twin and family studies [4]–[8], . Depending on the phenotype and original literature estimates, the proportion of heritability explained by common variation varies across different disorders from essentially all estimated heritability, as observed in autism, multiple sclerosis and von Willebrand's factor, to roughly half of the estimated heritability, as observed in height, schizophrenia, and type 1 diabetes. This study represents the first effort to use genome-wide genotype data to determine the heritability of two related neuropsychiatric disorders, OCD and TS. The narrow-sense heritability of each disorder (h2GCTA = 0.58 for TS and 0.37 for OCD) correspond well with previously reported heritability estimates from family and twin studies [17], [19], [20], [21], [22], [23]–[25], [26], [27], [28], [29], [49] suggesting that there is little, if any, heritability “missing” (i.e., unassayed). While previous TS and OCD GWAS have been underpowered to identify individual susceptibility variants with modest effect sizes, based on these results, future GWAS in much larger samples should identify a large number of true TS and OCD disease variants.
The difference between the heritability estimates calculated from imputed and directly genotyped data was not significant. However, the imputed heritability estimates were slightly but consistently lower compared to the estimates generated from the directly genotyped data. While we employed strict r2 thresholds, the dosage format of imputed data prevented it from being subjected to the same strict Hardy-Weinberg thresholds as the directly genotyped data. Therefore this small decrease in measured heritability may reflect additional noise in the imputed data contributed by lower quality SNPs. Alternatively, the decrease may reflect the possibility that even with very stringent QC some minor residual technical artifacts may have remained in the directly genotyped data. Perhaps most interesting though, is the observation that the imputed data did not show a significant increase in heritability, even with a substantial increase in the number of interrogated variants, suggesting that the directly genotyped data alone sufficiently captured the narrow-sense heritability present in SNP level data.
We identified a significant genetic correlation between TS and OCD of 0.41 (se = 0.15). This estimate of genetic overlap is smaller than that observed for schizophrenia/bipolar disorder (0.68±0.04), but similar to that of bipolar disorder/major depressive disorder (0.47±0.06) and schizophrenia/major depressive disorder (0.43±0.06) [50]. While this result suggests there is some degree of shared heritability between the two disorders, the standard error of the genetic correlation was large. In addition, the presence of overlapping co-morbidity between TS and OCD in both samples (13% co-morbid TS or tics in the OCD sample, 43% co-morbid OCD in the TS sample) may have inflated the correlation further. After removing all TS and OCD cases with documented co-morbid OCD or TS, respectively, the subsequent cleaner, but underpowered analysis yielded a genetic correlation of 0.50 (se = 0.29) which is very similar to the initial correlation of r = 0.41. It is important to note, however, that some cases with missing co-morbidity data may have contributed residual co-morbidity to this sensitivity analysis. Therefore, the bivariate genetic correlation may still be an overestimate, and should be interpreted with caution.
We went on to examine the genomic distribution of liability by partitioning the heritability by chromosome. We found that the additive heritability estimated by chromosome for either OCD or TS was not significantly different from the cumulative univariate heritability calculated by using all data together. This served as an additional quality control check and confirmed the absence of residual LD between chromosomes, which can arise in a sample with cryptic relatedness or population substructure [51]. We examined the relationship between chromosome length and proportion of heritability detected, which also provides insight into the distribution of risk alleles throughout the genome and helps to characterize the polygenic contribution to risk. We found evidence, in both TS and OCD, of a highly polygenic architecture, as demonstrated by the significant correlation between chromosomal length and heritability. In addition, the observation that individual chromosomes in both phenotypes contributed to heritability disproportionately suggest these chromosomes may harbor loci with larger effect sizes on a polygenic background of small effect susceptibility variants distributed equally throughout the genome.
The initial correlation between OCD heritability and chromosome length increased substantially after removal of chromosome 15 (Tables S5 and S6). This increase in correlation is quite similar to the increase in the correlation between chromosome length and heritability reported for multiple sclerosis (MS) [48] upon removal of chromosome 6 (r = 0.45), suggesting that chromosome 15 may contribute to the heritability of OCD much to the same degree that chromosome 6 contributes to the heritability of MS [48]. Regions of chromosome 15 have been identified as linkage signals for OCD across multiple populations [52], [53]. Additionally, genes within the imprinted genomic region chr15q11-13 have been reproducibly associated with repetitive behaviors, obsessive compulsive behaviors, and autism [54], [55], [56], [57]. Together these findings continue to implicate chromosome 15 in the development of OCD.
Of note, essentially no heritability for either OCD or TS was observed on chromosome 6, which encodes both the HLA and histone gene clusters. This absence of heritability within the MHC region is relevant to these two phenotypes, since an autoimmune etiology for both OCD and TS has been proposed, based on similarities between these two disorders and the acute neuropsychiatric presentation of patients with Sydenham chorea in the setting of acute rheumatic fever and triggered by Group A streptococcal infection [58]. While an immune-mediated mechanism could still arise from genetic loci outside of the HLA locus, our result is in stark contrast to schizophrenia, where the strongest GWAS signal is observed in HLA, suggesting this disorder has an immune-mediated component [59].
In an effort to further understand the genomic architecture of OCD and TS, we performed exploratory analyses of heritability across the MAF spectrum. By running all MAF bins together in a single REML analysis, we partitioned the effects of LD across each bin, as Lee et al (2012) previously demonstrated through simulation that this approach restricts the effects of LD between bins and reflects expected heritability per bin based on simulated risk allele distributions. For OCD, no heritability was captured by SNPs with MAF<5%, while the majority of the heritability detected was due to those SNPs with MAF>30%. In contrast, for TS, 21% of the total heritability was captured by SNPs with MAF less than 5% with the remaining bulk of the heritability shared approximately equally among alleles with MAF between 0.10–0.50. Analysis of imputed data confirmed these findings and showed that SNPs with MAF<0.05 accounted for 30% of the total TS heritability and 0% of the total OCD heritability. To ensure that the difference between TS and OCD rare SNP heritability estimates were not due to subtle population substructure in the TS sample, we conducted an additional analysis which further partitioned the MAF<5% bin by chromosome. We then compared the estimate of heritability calculated by summing each chromosome (h2 = 12.3, se = 0.08) to the estimate of heritability based on all MAF<5% SNPs in a single analysis (h2 = 12.7, se = 0.04) and found no significant difference. If population substructure was present in the TS sample and was a source of bias contributing to the increased heritability identified in the rare bin, we would have expected to see inflation of the heritability estimate due to LD between chromosomes when partitioned by chromosome and then summed [51]. We can therefore reject the hypothesis that the rare variant heritability in TS is due to population substructure.
The observation that TS and OCD have such different patterns for heritability estimated across the MAF spectrum points to the value that such analyses may provide for illuminating genetic architecture. There is clearly support for analysis of rare variants and follow-up sequencing in TS given the contribution to heritability observed for SNPs with MAF<0.05. The observations in OCD are also intriguing with respect to questions on the set of genetic models that would be consistent with heritability being concentrated among variants with high MAF. Are such patterns consistent with particular models for the age of a disorder, or perhaps with aspects of the evolutionary history of contributing risk alleles? It will also be important to investigate whether such analyses applied to other disorders will reveal a full continuum with respect to the proportion of phenotypic variance attributable to variants across the MAF spectrum or something more discrete with overall patterns more similar to OCD at one end and TS at the other. Replication analysis with larger samples and additional phenotypes will undoubtedly shed more light on the analysis presented here.
We partitioned SNPs annotated as brain (parietal and cerebellum) and muscle eQTLs in an effort to concentrate heritability within smaller putatively functional classes of testable variants [60]. Taken together, these results suggest a substantial contribution to overall heritability by SNPs annotated as brain eQTLs for both TS and OCD. However, it is important to note that several limitations of experimental power, including power to detect eQTLs across tissues, and power to estimate heritability within our samples, resulted in large standard errors. Cautious interpretation of these exploratory analyses finds that the “brain-only” eQTL partition in OCD provides the only statistically significant estimate of heritability (h2 = 0.19, se = 0.08, p = 0.009) in a joint analysis with an additional non-brain tissue (muscle), although the TS “brain-only” partition approaches significance (h2 = 0.16, se = 0.10, p = 0.06) (Table S9; Figure S8). The result is intriguing especially considering that the non-eQTL partition contained over 6.5 million SNPs, approximately twelve times the number of SNPs contained in the brain-only eQTL partition. These findings are preliminary and will require replication. Nevertheless, when interpreted in the context of additional recent studies showing specific enrichment of brain eQTLs in top GWAS signals from neuropsychiatric phenotypes, our results suggest that further study of the role of brain eQTLs in TS and OCD is warranted [61], [38].
Our results examining the heritability of childhood-onset OCD are in line with previous studies that suggest a higher heritability for childhood-onset OCD than for adult onset OCD. However, because of the smaller sample sizes due to splitting the OCD sample into two groups based on age of onset, the 95% confidence intervals for childhood-onset and adult-onset OCD overlap, and are not significantly different from each other. With increased sample sizes it may be possible to confirm these observed heritability differences and to obtain more precise estimates of the relative heritability of child and adult onset OCD.
Our results explain essentially all of the heritability of TS and a majority of the heritability of OCD established by twin and family studies. One factor that may have contributed to the significant proportion of heritability explained by our results is the ascertainment strategy employed to collect the samples. As Klei and colleagues (2012) elegantly demonstrated, heritability estimated from samples belonging to multiplex families can be greater than those generated by samples belonging to simplex families. This phenomenon is most likely a matter of increased polygenic load reflected in the multiplex samples, as opposed to differing allelic architectures [6]. Approximately 30% of the TS cases used in this analysis came from families with more than one affected individual. Replication of these results in other samples and populations will be needed to further confirm the heritability estimates and partition estimates presented here.
In conclusion, this study provides substantial evidence that both TS and OCD are highly heritable, polygenic, and that a significant majority of the heritability of both disorders is captured by GWAS SNP variants. Using both directly genotyped and imputed data, we also provide evidence of allelic architecture differences between TS and OCD. Specifically, we identified a significant contribution from rare variants in the genomic architecture of TS that appears to be absent from the architecture of OCD. Our results also provide additional evidence of a prominent role for chromosome 15 in OCD liability and possible concentration of TS liability on chromosomes 2, 5, 11, 12, 16 and 20. We also find that brain eQTLs concentrate a significant proportion of the heritability present in TS and OCD. It is unlikely that the differences in genetic architecture between TS and OCD are due to incomplete matching during QC or other, unknown, technical biases, as all cases were genotyped with identical technology, shared the same control set, and were imputed together. Taken together, these results advance our understanding of the overlapping and non-overlapping genomic architectures of TS and OCD and suggest that non-overlapping elements of the architecture of each phenotype may be a limiting factor in the genetic relationship between them. Moreover, these results may be used to inform priorities for future studies of both disorders. For example, given the apparent contribution of rare variants to the heritability of TS, DNA sequencing may be a particularly informative analysis, whereas larger sample sizes and additional GWAS is likely to identify the majority of susceptibility variants for both disorders. Future studies aimed at understanding the genetic control of shared neurocircuitry in TS and OCD may be most well powered by testing the association of shared genetic risk (i.e., common polygenic brain eQTLs) with a well-defined quantitative neurobiological endophenotype. Studies such as the one presented here continue to highlight the value of “big picture” analyses, which provide insight into the genetic landscape of a phenotype, as a necessary and intelligent complement to the mapping of specific risk variants.
Supporting Information
Zdroje
1. ManolioTA, CollinsFS, CoxNJ, GoldsteinDB, HindorffLA, et al. (2009) Finding the missing heritability of complex diseases. Nature 461 : 747–753.
2. ZukO, HechterE, SunyaevSR, LanderES (2012) The mystery of missing heritability: Genetic interactions create phantom heritability. Proc Natl Acad Sci U S A 109 : 1193–1198.
3. EichlerEE, FlintJ, GibsonG, KongA, LealSM, et al. (2010) Missing heritability and strategies for finding the underlying causes of complex disease. Nat Rev Genet 11 : 446–450.
4. LeeSH, WrayNR, GoddardME, VisscherPM (2011) Estimating missing heritability for disease from genome-wide association studies. Am J Hum Genet 88 : 294–305.
5. YangJ, LeeSH, GoddardME, VisscherPM (2011) GCTA: a tool for genome-wide complex trait analysis. Am J Hum Genet 88 : 76–82.
6. KleiL, SandersSJ, MurthaMT, HusV, LoweJK, et al. (2012) Common genetic variants, acting additively, are a major source of risk for autism. Mol Autism 3 : 9.
7. KellerMF, SaadM, BrasJ, BettellaF, NicolaouN, et al. (2012) Using genome-wide complex trait analysis to quantify ‘missing heritability’ in Parkinson's disease. Hum Mol Genet 21 : 4996–5009.
8. LeeSH, YangJ, GoddardME, VisscherPM, WrayNR (2012) Estimation of pleiotropy between complex diseases using single-nucleotide polymorphism-derived genomic relationships and restricted maximum likelihood. Bioinformatics 28 : 2540–2542.
9. MiguelEC, do Rosario-CamposMC, PradoHS, do ValleR, RauchSL, et al. (2000) Sensory phenomena in obsessive-compulsive disorder and Tourette's disorder. J Clin Psychiatry 61 : 150–156; quiz 157.
10. MiguelEC, BaerL, CoffeyBJ, RauchSL, SavageCR, et al. (1997) Phenomenological differences appearing with repetitive behaviours in obsessive-compulsive disorder and Gilles de la Tourette's syndrome. Br J Psychiatry 170 : 140–145.
11. FerraoYA, MiguelE, SteinDJ (2009) Tourette's syndrome, trichotillomania, and obsessive-compulsive disorder: how closely are they related? Psychiatry Res 170 : 32–42.
12. GraybielAM (2008) Habits, rituals, and the evaluative brain. Annu Rev Neurosci 31 : 359–387.
13. HarrisonBJ, PujolJ, CardonerN, DeusJ, AlonsoP, et al. (2013) Brain corticostriatal systems and the major clinical symptom dimensions of obsessive-compulsive disorder. Biol Psychiatry 73 : 321–328.
14. WangL, LeeDY, BaileyE, HartleinJM, GadoMH, et al. (2007) Validity of large-deformation high dimensional brain mapping of the basal ganglia in adults with Tourette syndrome. Psychiatry Res 154 : 181–190.
15. PaulsDL (1992) The genetics of obsessive compulsive disorder and Gilles de la Tourette's syndrome. Psychiatr Clin North Am 15 : 759–766.
16. van GrootheestDS, CathDC, BeekmanAT, BoomsmaDI (2005) Twin studies on obsessive-compulsive disorder: a review. Twin Res Hum Genet 8 : 450–458.
17. MathewsCA, GreenwoodT, WesselJ, AzzamA, GarridoH, et al. (2008) Evidence for a heritable unidimensional symptom factor underlying obsessionality. Am J Med Genet B Neuropsychiatr Genet 147B: 676–685.
18. GradosMA, MathewsCA (2008) Latent class analysis of gilles de la tourette syndrome using comorbidities: clinical and genetic implications. Biol Psychiatry 64 : 219–225.
19. KaterbergH, DelucchiKL, StewartSE, LochnerC, DenysDA, et al. (2010) Symptom dimensions in OCD: item-level factor analysis and heritability estimates. Behav Genet 40 : 505–517.
20. van GrootheestDS, CathD, HottengaJJ, BeekmanAT, BoomsmaDI (2009) Genetic factors underlie stability of obsessive-compulsive symptoms. Twin Res Hum Genet 12 : 411–419.
21. KiddKK, HeimbuchRC, RecordsMA, OehlertG, WebsterRL (1980) Familial stuttering patterns are not related to one measure of severity. J Speech Hear Res 23 : 539–545.
22. KiddKK, PrusoffBA, CohenDJ (1980) Familial pattern of Gilles de la Tourette syndrome. Arch Gen Psychiatry 37 : 1336–1339.
23. KanoY, OhtaM, NagaiY, PaulsDL, LeckmanJF (2001) A family study of Tourette syndrome in Japan. Am J Med Genet 105 : 414–421.
24. PaulsDL, RaymondCL, StevensonJM, LeckmanJF (1991) A family study of Gilles de la Tourette syndrome. Am J Hum Genet 48 : 154–163.
25. HebebrandJ, KlugB, FimmersR, SeuchterSA, Wettke-SchaferR, et al. (1997) Rates for tic disorders and obsessive compulsive symptomatology in families of children and adolescents with Gilles de la Tourette syndrome. J Psychiatr Res 31 : 519–530.
26. PriceRA, KiddKK, CohenDJ, PaulsDL, LeckmanJF (1985) A twin study of Tourette syndrome. Arch Gen Psychiatry 42 : 815–820.
27. BoltonD, RijsdijkF, O'ConnorTG, PerrinS, EleyTC (2007) Obsessive-compulsive disorder, tics and anxiety in 6-year-old twins. Psychol Med 37 : 39–48.
28. LichtensteinP, CarlstromE, RastamM, GillbergC, AnckarsaterH (2010) The genetics of autism spectrum disorders and related neuropsychiatric disorders in childhood. Am J Psychiatry 167 : 1357–1363.
29. O'RourkeJA, ScharfJM, YuD, PaulsDL (2009) The genetics of Tourette syndrome: a review. J Psychosom Res 67 : 533–545.
30. ScharfJM, YuD, MathewsCA, NealeBM, StewartSE, et al. (2012) Genome-wide association study of Tourette's syndrome. Mol Psychiatry 18 (6) 721–8.
31. StewartSE, YuD, ScharfJM, NealeBM, FagernessJA, et al. (2012) Genome-wide association study of obsessive-compulsive disorder. Mol Psychiatry 18 (7) 788–98.
32. PattersonN, PriceAL, ReichD (2006) Population structure and eigenanalysis. PLoS Genet 2: e190.
33. KarnoM, GoldingJM, SorensonSB, BurnamMA (1988) The epidemiology of obsessive-compulsive disorder in five US communities. Arch Gen Psychiatry 45 : 1094–1099.
34. KhalifaN, von KnorringAL (2003) Prevalence of tic disorders and Tourette syndrome in a Swedish school population. Dev Med Child Neurol 45 : 315–319.
35. WangHS, KuoMF (2003) Tourette's syndrome in Taiwan: an epidemiological study of tic disorders in an elementary school at Taipei County. Brain Dev 25 Suppl 1: S29–31.
36. LanziG, ZambrinoCA, TermineC, PalestraM, Ferrari GinevraO, et al. (2004) Prevalence of tic disorders among primary school students in the city of Pavia, Italy. Arch Dis Child 89 : 45–47.
37. WangK, LiM, HakonarsonH (2010) ANNOVAR: functional annotation of genetic variants from high-throughput sequencing data. Nucleic Acids Res 38: e164.
38. GamazonER, BadnerJA, ChengL, ZhangC, ZhangD, et al. (2012) Enrichment of cis-regulatory gene expression SNPs and methylation quantitative trait loci among bipolar disorder susceptibility variants. Mol Psychiatry 18 (3) 340–6.
39. ElbeinSC, KernPA, RasouliN, Yao-BorengasserA, SharmaNK, et al. (2011) Global gene expression profiles of subcutaneous adipose and muscle from glucose-tolerant, insulin-sensitive, and insulin-resistant individuals matched for BMI. Diabetes 60 : 1019–1029.
40. ElbeinSC, GamazonER, DasSK, RasouliN, KernPA, et al. (2012) Genetic risk factors for type 2 diabetes: a trans-regulatory genetic architecture? Am J Hum Genet 91 : 466–477.
41. JohnsonWE, LiC, RabinovicA (2007) Adjusting batch effects in microarray expression data using empirical Bayes methods. Biostatistics 8 : 118–127.
42. LeekJT, StoreyJD (2007) Capturing heterogeneity in gene expression studies by surrogate variable analysis. PLoS Genet 3 : 1724–1735.
43. PurcellS, NealeB, Todd-BrownK, ThomasL, FerreiraMA, et al. (2007) PLINK: a tool set for whole-genome association and population-based linkage analyses. Am J Hum Genet 81 : 559–575.
44. LiY, WillerCJ, DingJ, ScheetP, AbecasisGR (2010) MaCH: using sequence and genotype data to estimate haplotypes and unobserved genotypes. Genet Epidemiol 34 : 816–834.
45. LiY, WillerC, SannaS, AbecasisG (2009) Genotype imputation. Annu Rev Genomics Hum Genet 10 : 387–406.
46. NestadtG, SamuelsJ, RiddleM, BienvenuOJ3rd, LiangKY, et al. (2000) A family study of obsessive-compulsive disorder. Arch Gen Psychiatry 57 : 358–363.
47. HannaGL, HimleJA, CurtisGC, GillespieBW (2005) A family study of obsessive-compulsive disorder with pediatric probands. Am J Med Genet B Neuropsychiatr Genet 134B: 13–19.
48. LeeSH, HaroldD, NyholtDR, GoddardME, ZondervanKT, et al. (2013) Estimation and partitioning of polygenic variation captured by common SNPs for Alzheimer's disease, multiple sclerosis and endometriosis. Hum Mol Genet 22 : 832–841.
49. Scharf JM, Pauls D (2007) Genetics of tic disorders. In: D.L. R, M. CJ, R.E. P, R. KB, editors. Principles and Pracitices of Medical Genetics. 5th ed. New York: Elsevier. pp. 2737–2754.
50. Consortium C-DGotPG (2013) Genetic relationships between five psychiatric disorders estimated from genome-wide SNPs. Nature Genetics 45 (9) 984–94.
51. YangJ, ManolioTA, PasqualeLR, BoerwinkleE, CaporasoN, et al. (2011) Genome partitioning of genetic variation for complex traits using common SNPs. Nat Genet 43 : 519–525.
52. ShugartYY, SamuelsJ, WillourVL, GradosMA, GreenbergBD, et al. (2006) Genomewide linkage scan for obsessive-compulsive disorder: evidence for susceptibility loci on chromosomes 3q, 7p, 1q, 15q, and 6q. Mol Psychiatry 11 : 763–770.
53. RossJ, BadnerJ, GarridoH, SheppardB, ChaviraDA, et al. (2011) Genomewide linkage analysis in Costa Rican families implicates chromosome 15q14 as a candidate region for OCD. Hum Genet 130 : 795–805.
54. ShaoY, CuccaroML, HauserER, RaifordKL, MenoldMM, et al. (2003) Fine mapping of autistic disorder to chromosome 15q11-q13 by use of phenotypic subtypes. Am J Hum Genet 72 : 539–548.
55. DelahantyRJ, KangJQ, BruneCW, KistnerEO, CourchesneE, et al. (2011) Maternal transmission of a rare GABRB3 signal peptide variant is associated with autism. Mol Psychiatry 16 : 86–96.
56. DoornbosM, Sikkema-RaddatzB, RuijvenkampCA, DijkhuizenT, BijlsmaEK, et al. (2009) Nine patients with a microdeletion 15q11.2 between breakpoints 1 and 2 of the Prader-Willi critical region, possibly associated with behavioural disturbances. Eur J Med Genet 52 : 108–115.
57. NestadtG, WangY, GradosMA, RiddleMA, GreenbergBD, et al. (2012) Homeobox genes in obsessive-compulsive disorder. Am J Med Genet B Neuropsychiatr Genet 159B: 53–60.
58. SwedoSE, LeonardHL, GarveyM, MittlemanB, AllenAJ, et al. (1998) Pediatric autoimmune neuropsychiatric disorders associated with streptococcal infections: clinical description of the first 50 cases. Am J Psychiatry 155 : 264–271.
59. Genome-wide association study identifies five new schizophrenia loci. Nat Genet 43 : 969–976.
60. Gamazon E, Im H, Liu C, Nicolae D, Cox N (2012) The convergence of functional genomics, heritability estimation, and polygenic modeling: Emerging spectrum of alleleic variation in bipolar disorder. arXiv:submit/0682261.
61. DavisLK, GamazonER, Kistner-GriffinE, BadnerJA, LiuC, et al. (2012) Loci nominally associated with autism from genome-wide analysis show enrichment of brain expression quantitative trait loci but not lymphoblastoid cell line expression quantitative trait loci. Mol Autism 3 : 3.
Štítky
Genetika Reprodukční medicínaČlánek vyšel v časopise
PLOS Genetics
2013 Číslo 10
Nejčtenější v tomto čísle
- A GDF5 Point Mutation Strikes Twice - Causing BDA1 and SYNS2
- Dominant Mutations in Identify the Mlh1-Pms1 Endonuclease Active Site and an Exonuclease 1-Independent Mismatch Repair Pathway
- Eleven Candidate Susceptibility Genes for Common Familial Colorectal Cancer
- The Histone H3 K27 Methyltransferase KMT6 Regulates Development and Expression of Secondary Metabolite Gene Clusters