
Divergent Selection Drives Genetic Differentiation in an R2R3-MYB Transcription Factor That Contributes to Incipient Speciation in
Identifying the molecular genetic basis of traits contributing to speciation is of crucial importance for understanding the ecological and evolutionary mechanisms that generate biodiversity. Despite several examples describing putative “speciation genes,” it is often uncertain to what extent these genetic changes have contributed to gene flow reductions in nature. Therefore, considerable interest lies in characterizing the molecular basis of traits that actively confer reproductive isolation during the early stages of speciation, as these loci can be attributed directly to the process of divergence. In Southern California, two ecotypes of Mimulus aurantiacus are parapatric and differ primarily in flower color, with an anthocyanic, red-flowered morph in the west and an anthocyanin-lacking, yellow-flowered morph in the east. Evidence suggests that the genetic changes responsible for this shift in flower color have been essential for divergence and have become fixed in natural populations of each ecotype due to almost complete differences in pollinator preference. In this study, we demonstrate that a cis-regulatory mutation in an R2R3-MYB transcription factor results in differential regulation of enzymes in the anthocyanin biosynthetic pathway and is the major contributor to differences in floral pigmentation. In addition, molecular population genetic data show that, despite gene flow at neutral loci, divergent selection has driven the fixation of alternate alleles at this gene between ecotypes. Therefore, by identifying the genetic basis underlying ecologically based divergent selection in flower color between these ecotypes, we have revealed the ecological and functional mechanisms involved in the evolution of pre-mating isolation at the early stages of incipient speciation.
Published in the journal:
. PLoS Genet 9(3): e32767. doi:10.1371/journal.pgen.1003385
Category:
Research Article
doi:
https://doi.org/10.1371/journal.pgen.1003385
Summary
Identifying the molecular genetic basis of traits contributing to speciation is of crucial importance for understanding the ecological and evolutionary mechanisms that generate biodiversity. Despite several examples describing putative “speciation genes,” it is often uncertain to what extent these genetic changes have contributed to gene flow reductions in nature. Therefore, considerable interest lies in characterizing the molecular basis of traits that actively confer reproductive isolation during the early stages of speciation, as these loci can be attributed directly to the process of divergence. In Southern California, two ecotypes of Mimulus aurantiacus are parapatric and differ primarily in flower color, with an anthocyanic, red-flowered morph in the west and an anthocyanin-lacking, yellow-flowered morph in the east. Evidence suggests that the genetic changes responsible for this shift in flower color have been essential for divergence and have become fixed in natural populations of each ecotype due to almost complete differences in pollinator preference. In this study, we demonstrate that a cis-regulatory mutation in an R2R3-MYB transcription factor results in differential regulation of enzymes in the anthocyanin biosynthetic pathway and is the major contributor to differences in floral pigmentation. In addition, molecular population genetic data show that, despite gene flow at neutral loci, divergent selection has driven the fixation of alternate alleles at this gene between ecotypes. Therefore, by identifying the genetic basis underlying ecologically based divergent selection in flower color between these ecotypes, we have revealed the ecological and functional mechanisms involved in the evolution of pre-mating isolation at the early stages of incipient speciation.
Introduction
Revealing the specific genes and mutations that underlie reproductive isolation provides a window into the evolutionary and molecular mechanisms that drive speciation. Characterization of these genes allows us to explore several long-standing questions about the genetics of speciation, such as how many genetic changes underlie individual isolating traits and what are their relative effect sizes [1]? What role does genetic architecture play in speciation [2]? And, have the genetic changes been fixed due to natural selection [3], [4]?
Ecologically-based divergent selection appears to be a pervasive feature of speciation that leads to the evolution of reproductive isolation as a by-product of adaptation to different environments [5]–[7]. However, despite much evidence for natural selection's role in the evolution of reproductive isolation, the genetic changes that underlie these adaptive traits have been characterized in only a few cases [8]. On the other hand, signatures of positive selection have been detected at some of the genes contributing to reproductive isolation, but in these examples, the ecological mechanisms underlying this selection are rarely known [9]–[11]. Therefore, to understand how divergent selection has influenced the speciation process, it is necessary to integrate ecological studies of traits involved in reproductive isolation with molecular and population genetic techniques that can identify the evolutionary forces and genetic changes controlling variation in these traits. By connecting these approaches, it becomes possible to identify the functional and ecological mechanisms that guide the evolution of new species [8].
Most examples that describe the genetic basis of speciation involve retrospective analyses between completely isolated species [12]. However, because the traits contributing to reproductive isolation continue to accumulate after speciation is complete, it is difficult to determine which of these components of isolation were the drivers of divergence and which arose following speciation [13]. In addition, even though the genetic changes controlling intrinsic postzygotic barriers have been characterized among several species [14], [15], in many cases, these taxa are allopatric, which suggests that these barriers do not actively contribute to gene flow reductions in nature [16]. By contrast, regions of natural hybridization that develop between partially isolated incipient species are recognized as ‘natural laboratories’ because the efficacy of natural selection to maintain barriers is tested constantly in the face of ongoing gene flow [17], [18]. Moreover, because gene exchange persists, hybrid zones have the potential to reveal the genetic changes influencing divergence before they become confounded with other species differences. Nevertheless, despite the rich theoretical and empirical history of clines and hybrid zones [19]–[21], little is known about the form and intensity of selection acting on the specific genes affecting reproductive isolation between divergent taxa.
Relative to other forms of reproductive isolation, adaptations that reduce the frequency of mating among neighboring populations (i.e. pre-mating barriers) can have disproportionate effects on reducing gene flow, particularly if they arise during the early stages of divergence [5], [22]. However, comparatively few examples exist where the molecular genetic basis of a pre-mating isolating barrier has been characterized [12], [14]. Pollinator isolation is widely regarded as a common mechanism of adaptation and speciation in plants [23], [24], and flower color has been implicated as one of the primary traits involved [25]. However, of the most highly regarded examples describing the role of flower color in driving pollinator isolation, either the precise genetic changes have not yet been identified [26], the flower color shift occurred as a reinforcing mechanism to complete the speciation process [27], or it occurred after speciation was complete [28], [29]. In addition, while the genetic basis of flower color differences has been characterized in other cases [30], [31], there is no evidence from these studies that pollinator-mediated selection drove flower color change. Therefore, considerable interest lies in identifying the molecular basis of traits such as flower color that actively confer pre-mating isolation at the early stages of divergence.
In Mimulus aurantiacus (Phrymaceae), there is strong evidence that geographic variation in flower color contributes to reproductive isolation between two ecotypes distributed along an east-west gradient in Southern California (Figure 1). In this classic example of incipient speciation [24], [25], the ecotypes remain highly isolated due to differences in pollinator behavior, with hummingbirds showing greater than 95% preference for a red-flowered ecotype that occurs in the west and hawkmoths showing nearly complete preference for a yellow-flowered ecotype in the east [25], [32]. The incomplete nature of this barrier allows a hybrid zone to occur where the two ranges overlap, resulting in gene flow between ecotypes at neutral loci [33]. Moreover, intrinsic postzygotic barriers to gene flow are weak [34], suggesting that isolation occurs predominantly from divergent selection associated with differences in pollinator preference. Therefore, the genetic changes responsible for the shift in flower color appear to have been essential to the early stages of divergence in this system.

The red and yellow ecotypes both produce yellow, carotenoid pigments in their flowers, but only the red ecotype produces anthocyanins [35]. Thus, the major difference in flower color between the ecotypes is caused by the presence versus absence of anthocyanins. Anthocyanin floral pigments are synthesized by a well-characterized pathway that is highly conserved across angiosperms [36]. Anthocyanin biosynthesis requires the function of at least six enzymes, many of which are coordinately regulated by three interacting transcription factor proteins (Figure 2) [37]. Therefore, to generate the changes in anthocyanin pigment intensity that are responsible for red versus yellow flowers between the ecotypes, flux through this pathway must be altered. In principle, such alteration may be caused in any of four ways: (i) by cis-regulatory changes to enzyme-coding genes that directly affect enzymatic expression; (ii) by coding-sequence mutations in enzyme-coding genes; (iii) by cis-regulatory changes to anthocyanin transcription factors; or (iv) by coding-sequence mutations to anthocyanin transcription factors [38]. Despite these possibilities, the repeated evolution of flower color transitions among angiosperm species reveals a striking pattern of genetic convergence, with all known cases of shifts in floral anthocyanin intensity resulting from mutations in one class of pigment-regulating transcription factor [38].

We have shown previously that flower color variation in M. aurantiacus is a quantitative character resulting from mutations in at least two interacting loci that affect the expression levels of three essential pathway enzymes [35]. Allelic differences at one of these loci explained 45% of the phenotypic variation in floral anthocyanin content and contained the gene encoding the anthocyanin pathway enzyme, dihydroflavonol 4-reductase (MaDfr). Despite significantly higher MaDfr expression in red compared to yellow flowers, functional analyses suggested that an unknown genetic factor was responsible for these changes in gene expression and ecotypic differences in floral anthocyanin pigmentation [35]. Because this locus affects expression of multiple pathway enzymes including MaDfr, it was hypothesized to encode a transcription factor protein. Moreover, because flower color variation mapped to a genomic region of major effect containing MaDfr, this gene was presumed to be linked to MaDfr. However, the identity of this factor and the type of mutation (i.e. cis-regulatory or coding) affecting flower color differences were not determined.
With ample ecological motivation in place [32], [33], we take advantage of the resources available in the anthocyanin pathway and combine classic genetic techniques, gene expression analyses, and gene knockdown approaches to characterize the molecular genetic basis of incipient species differences in flower color. We then use molecular population genetic data to demonstrate how natural selection has driven the fixation of alleles at this gene between two ecotypes at the early stages of divergence. Our results reveal the power of combining ecological and molecular investigations to the study of speciation genetics, as we not only identify a major gene associated with the evolution of reproductive isolation, but we also demonstrate how natural selection can drive ecological divergence integral to the speciation process.
Results
Examination of congeneric M. guttatus reveals potential candidate regulators in the R2R3-MYB family of transcription factors
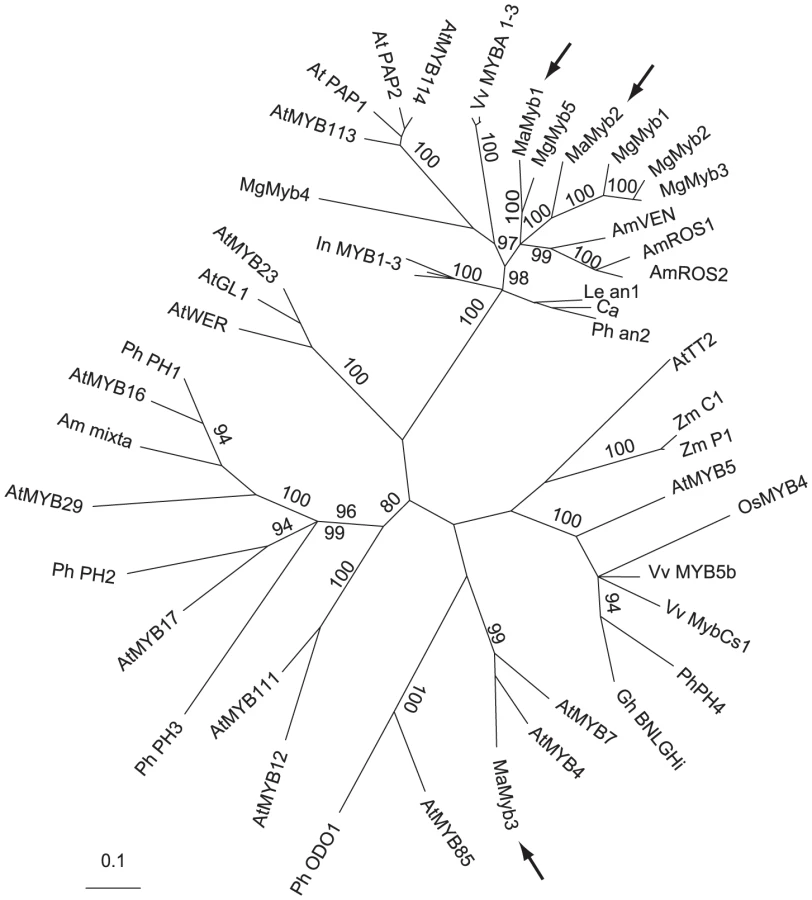
We used the genome sequence available from the closely related M. guttatus to search for putative pigment regulators linked to the single copy Dfr gene (MgDfr). No anthocyanin pigmentation candidates were located on the sequence scaffold containing MgDfr. However, three R2R3-MYB transcription factors (MgMyb1-3) homologous to known anthocyanin regulators from model species [39], were distantly linked to MgDfr. By screening M. aurantiacus floral complementary DNA (cDNA), we identified three R2R3-MYB-related genes expressed in M. aurantiacus floral tissue (MaMyb1-MaMyb3). The sequence of MaMyb1 was described previously [35]. To infer homology of these genes to other known anthocyanin regulators, we constructed gene trees, as described previously [35]. MaMyb1 and MaMyb2 grouped in a highly supported clade containing known anthocyanin regulators from subgroup six of the R2R3-MYB family [39] (Figure 3). By contrast, MaMyb3 did not group with the anthocyanin regulators, as it formed a clade with sequences from Arabidopsis subgroup four [41].
Genetic mapping identifies MaMyb2 as a prime candidate controlling the flower color shift
While mutations in at least two loci are involved in flower color differences between the ecotypes [35], we focus here only on the genetic basis of the locus explaining the greatest variation in flower color. Because our previous data suggested that this major regulator should be linked to MaDfr in M. aurantiacus, we established linkage relationships among MaMyb1, MaMyb2, MaMyb3, and MaDfr in 359 F2 hybrids derived from a cross between the ecotypes. Among the three floral-expressed R2R3-MYB genes, MaMyb1 and MaMyb3 were unlinked to MaDfr, but MaMyb2 was located approximately 11 cM from MaDfr (Table S1). Genotypes at these and all subsequent markers used in this study (see below) were classified as RR, RY, or YY depending on whether alleles were derived from the red-ecotype (R) or the yellow-ecotype (Y) parents in the cross. Consistent with these patterns of linkage, genotype at MaMyb2 was significantly associated with total anthocyanin content in the flowers of these same F2 plants, with MaMyb2 explaining approximately 50% of the phenotypic variation in flower color (Table S2; F(2,357) = 176.33; P<0.0001). Among the 79 observed recombinants between MaMyb2 and MaDfr in this F2 cross, MaMyb2 genotype significantly predicted differences in floral anthocyanins, but MaDfr genotype did not (Figure 4A), suggesting that the major flower color locus resides in the genomic region containing MaMyb2. While additive or epistatic effects of mutations in MaDfr may still account for a small percent of the variation in flower color between the ecotypes, linkage between the genes precluded a formal analysis of these potential minor effects in this study.

Genetic variation in MaMyb2 is associated with flower color in natural hybrid zones
To more precisely characterize the major genetic locus contributing to flower color evolution, we harnessed the power of natural hybrid zones for genotype-phenotype association studies. Ample opportunity for recombination in hybrid zones breaks down linkage disequilibrium, such that positive associations likely represent tight linkage with functional mutations. We genotyped five single nucleotide polymorphisms (SNPs) spanning a distance of 1383 bp within MaMyb2 (M1–M5) and four additional SNPs in genes surrounding MaDfr (D1–D4) (Table S3) from 168 plants from eight hybrid populations where flower color variation segregated (Figure 1; Table S4). Genetic variation at markers M3–M5 had a remarkably tight association with flower color in the hybrid zone (range P = 10−43 to P = 10−55) (Figure 4B; Table S5), with nearly perfect agreement between the phenotype and that predicted by genotype. Genotypes at D1–D4 and M1–M2 were also significantly associated with flower color (range P = 10−5 to P = 10−9), but these associations were an order of magnitude weaker than those for M3–M5. Variation in the strength of these associations among markers likely reflects the quantitative nature of this trait and the impact of one or more factors that influence the maintenance of linkage disequilibrium between loci, including the distance to the causal mutation, the strength, timing, and evolutionary history of natural selection, and the local recombination rate [42]. Regardless, these data provide robust support for the hypothesis that genetic variation in MaMyb2 contributes to ecotype differences in flower color.
Gene expression is associated with genotype at MaMyb2
The genetic association between flower color and MaMyb2 genotype also corresponds to strong differences in gene expression. In flowers collected from natural populations, MaMyb2 expression was consistently associated with elevated floral anthocyanin content (Figure 5A). Moreover, among F3 hybrids, genotype at MaMyb2 segregated significantly with its own expression and the expression levels of three anthocyanin pathway enzymes essential for pigment production [35] (Figure 5B).

MaMyb2 is necessary for floral anthocyanin pigmentation
The concurrence of genetic mapping and differential regulation of anthocyanin pathway enzymes firmly point to altered expression of MaMyb2 as the major genetic change responsible for adaptive flower color evolution. Therefore, as a first step to establish that genetic variation in MaMyb2 was responsible for the differences in flower color between the ecotypes, we post-transcriptionally silenced MaMyb2 in plants of the red ecotype using Virus-Induced Gene Silencing (VIGS) [43]. As expected for a regulator of the anthocyanin pathway, petal cells containing the MaMyb2 silencing construct produced no anthocyanins, which caused the usually hidden yellow carotenoid pigment to become visible in the red ecotype flowers (Figure 6A). Furthermore, significantly reduced MaMyb2 expression among silenced flowers relative to negative controls led to concomitant reductions in the expression levels of MaF3h, MaDfr, and MaAns, suggesting that these genes were regulated by MaMyb2 (Figure 6B).

While it is possible that the recovered VIGS phenotype is caused by the unintended silencing of additional R2R3-MYB genes by our VIGS construct, this situation is unlikely. In particular, we engineered the silencing construct to contain little sequence similarity between MaMyb2 and the other two R2R3-MYB genes known to be expressed in flowers (Figure S1). Furthermore, gene expression of MaMyb2, MaF3h, MaDfr, and MaAns co-segregated with genotype at MaMyb2 in F3 lines (Figure 5B), suggesting that variation in MaMyb2 expression (or something linked to it) regulates these enzymes. However, because MaMyb1 and MaMyb3 are not linked to MaMyb2, they cannot account directly for gene expression differences explained by MaMyb2 genotype. Therefore, these results indicate that MaMyb2 is necessary for the proper synthesis of red pigmentation in flowers via its effect on the expression of the anthocyanin enzymes.
A cis-regulatory mutation in MaMyb2 controls floral color
Despite confirmation that MaMyb2 is an integral component of the floral anthocyanin regulatory network in M. aurantiacus, it is necessary to examine whether MaMyb2 is a downstream target of a linked transcription factor that is directly responsible for flower color change. To determine whether differences in MaMyb2 floral expression could be attributed to cis - or trans-acting mutations, we examined variation in allele-specific expression among F1 heterozygotes. A significant allelic imbalance would indicate cis-regulation, whereas equal expression of both alleles would demonstrate a mutation acting in trans [44]. In five independent F1 hybrids, both R and Y alleles were amplified in genomic DNA samples. By contrast, the R allele was expressed in floral cDNA samples at significantly higher levels than the Y allele (Figure 6C), suggesting that differences in MaMyb2 expression between the ecotypes are due to a cis-acting mutation in MaMyb2 and not a linked trans-factor.
While these data support the hypothesis that flower color differences are primarily attributed to a cis-regulatory mutation in MaMyb2, full-length sequencing of the MaMyb2 coding region from red and yellow ecotypes revealed nine non-synonymous and two in-frame insertion-deletion substitutions (Figure S2). Any or all of these coding mutations could have altered the function of the MaMyb2 protein prior to the cis-regulatory change that affects gene expression. To address this possibility, we sequenced the MaMyb2 coding region from Mimulus aridus and M. clevelandii (sensu [45]), two closely-related, yellow-flowered taxa that co-occur with the red and yellow ecotypes in San Diego County, California. These taxa are members of the section Diplacus, a clade of several closely related, perennial shrubs distributed across California. Even though the phylogenetic relationships among Diplacus taxa are unclear at this time [46], the flowers of M. aridus and M. clevelandii lack anthocyanins. Thus, if any of the variable sites in the red ecotype are shared with these yellow-flowered taxa, this suggests it is unlikely for these sites to be functionally related to differences in floral anthocyanin production between the ecotypes.
Only one of the coding changes occurred in the conserved R2R3 DNA binding domain that is responsible for contacting the promoter of its target genes [41]. At this site (site 22; Figure S2, which is also SNP marker M2, see above), the M. aridus and M. clevelandii sequences were the same as the red ecotype sequences. In addition, 41 yellow-flowered plants from the natural hybrid zone were homozygous for the R allele at this SNP (Table S3), further suggesting that it is not responsible for differences in flower color. Moreover, with the exception of only one of the remaining coding changes (position 203), none of the sites were unique to the red ecotype (Figure S2), suggesting that they are unlikely to be functionally associated with floral anthocyanin production. While we cannot directly rule out the coding change at position 203 as being important for MaMyb2 function, it is worth noting that it involves a conservative change between two polar, uncharged amino acids (threonine and asparagine). Therefore, the combination of allele-specific expression and comparative sequencing data suggests that a cis-regulatory mutation in MaMyb2 is directly responsible for the major genetic change in floral anthocyanin pigmentation between the red and yellow ecotypes.
Elevated allelic differentiation across the flower color locus
Locus-specific patterns of elevated genetic differentiation between populations are indicative of positive selection [42]. We genotyped the nine SNPs described above (M1–M5 and D1–D4) in an additional 374 individuals from 22 populations outside of the hybrid zone (Figure 1; Table S4). Alleles at all five markers across MaMyb2 (M1–M5) were highly differentiated between ecotypes (FST>0.808) (Table 1). In particular, SNP M5 was differentially fixed in western and eastern populations for R and Y alleles, respectively. We also found very high allelic differentiation at D1–D4 (FST range: 0.658–0.711) even though genetic variation in MaDfr did not appear to be responsible for ecotypic differences in flower color. By contrast, the mean between-ecotype FST calculated previously from 100 polymorphic AFLP loci at many of these same populations was an order of magnitude lower (FST = 0.081), with no one locus having an FST greater than 0.39 [33].

Analysis of cline shape reveals signatures of divergent selection
To more precisely evaluate the spatial patterns of genetic variation across both ecotypes and their natural hybrid zone, we used maximum likelihood to estimate six parameters that together defined the shape and geographic position of the allele frequency clines from each of the nine markers [47], [48]. While clines are influenced by a number of factors including drift, selection, and gene flow [49], comparisons of cline shape and position across loci have the potential to distinguish among these processes. For example, clines at neutral loci can be due to recent contact among previously isolated populations, but introgression following contact will tend to widen and eventually flatten clines [20]. On the other hand, steep clines at particular loci can be maintained in the face of gene flow due to selection.
We observed characteristic sigmoidal cline shapes for all nine SNPs. However, little or no clinal variation was detected in a previous study investigating geographic variation of allele frequencies at randomly selected nuclear and chloroplast DNA markers from a similar set of populations that spanned the geographic range of both ecotypes and the hybrid zone [33]. This suggests that clines at all nine markers examined here have been maintained due to selection despite gene flow. In accordance with their positions on the chromosome, likelihood ratio tests (LRTs) described three groups of markers that differed significantly from each other in shape and position (M1–M2, M3–M5, and D1–D4) (Figure 7). Maximum likelihood estimates of cline width revealed significantly steeper clines for M3–M5 (0.9–7.5 km) and D1–D4 (3.9–4.8 km) compared to M1–M2 (13.8–15.2 km) (Table S6), suggesting that similar patterns of intense selection contribute to the observed genetic variation at M3–M5 and D1–D4. Moreover, SNPs M3–M5 exhibit nearly complete fixation of alternate alleles at the tails of the distribution, which is consistent with our ecological expectations of divergent selection in alternate habitats due to different pollinators. Alternatively, even though D1–D4 are almost completely fixed for the Y-allele in eastern habitats, these markers display extensive variation in the western part of the range (Figure 8).


When the phenotypic cline in flower color estimated from these same populations was super-imposed on the allele frequency clines at these nine markers, the cline shapes for M1–M2 and D1–D4 were highly discordant with flower color (Figure 8). In particular, the centers of the M1–M2 and D1–D4 clines were shifted significantly to the east relative to flower color (Table S6). Moreover, LRTs revealed that only the clines at M3–M5 were not significantly different in shape and position compared to the phenotypic cline in flower color (Figure 7), resulting in nearly identical patterns of clinal variation between the phenotype and these genetic markers (Figure 8).
Discussion
A cis-regulatory change in MaMyb2 confers pre-mating isolation during incipient speciation
While mutations in several genes are capable of generating the observed change in floral pigmentation between the ecotypes [38], our previous work in this system has shown that flower color differences are caused primarily by mutations in two genes likely encoding transcription factors that are responsible for differential regulation of the anthocyanin pathway enzymes in flowers [35]. At least one of these genes appears to be linked to MaDfr. Therefore, two lines of evidence were responsible for our initial hypothesis that MaMyb2 was the major locus contributing to flower color differences between M. aurantiacus ecotypes: 1) sequence homology between MaMyb2 and anthocyanin-regulating R2R3-MYB genes from other species (Figure 3), and 2) MaMyb2 and MaDfr are genetically linked (Table S1). Three additional results obtained in this study provide consistent support for this hypothesis: 3) MaMyb2 is integral to the regulatory network controlling floral anthocyanins; 4) MaMyb2 regulates expression of MaF3h, MaDfr, and MaAns, which significantly alters floral pigmentation; and 5) a cis-acting mutation in MaMyb2 is responsible for differences in MaMyb2 gene expression.
Data obtained from genotype-phenotype associations from both a genetic cross in the laboratory and natural genetic variation in admixed hybrid zones consistently implicate MaMyb2 in this phenotypic transition. Additionally, gene knock-down experiments provide compelling evidence that MaMyb2 is necessary for the production of red flowers and is thus integral to the regulatory network controlling floral anthocyanins. Specifically, in both VIGS-silenced flowers (Figure 6B) as well as segregating F3 lines (Figure 5B), MaMyb2 appears to regulate the expression of at least three enzymes (MaF3h, MaDfr, and MaAns) essential for anthocyanin biosynthesis. Furthermore, by demonstrating that MaMyb2 expression differences between the ecotypes are due to a mutation (or mutations) that act in cis and not trans, we have established that genetic variation in MaMyb2 itself and not a linked trans-factor is responsible for flower color differences. By contrast, both alleles at MaDfr are expressed at equivalent levels in F1 flowers [35], further suggesting that MaDfr is a regulatory target of MaMyb2. Finally, we have essentially ruled out coding mutations in MaMyb2 as functionally related to the phenotype, providing further support that changes in cis to MaMyb2 are responsible for ecotypic differences in flower color. While we have not yet identified the causal mutation (or mutations) responsible for this cis-acting expression change, it likely resides in a promoter or enhancer element that may be difficult to identify. Moreover, the remarkably tight genotype-phenotype associations in the hybrid zone at SNPs M3–M5 suggest that they are in linkage disequilibrium with the causal mutation. Therefore, functional tests in transgenic flowers will be necessary to determine which mutations are capable of activating MaMyb2 expression.
It is worth noting that our initial results suggested that MaDfr could be responsible for the major flower color change [35]. While mutations of small effect in MaDfr acting additively or epistatically with MaMyb2 cannot be ruled out from our current data, we show here that the major mutation lies within the linked MaMyb2 gene and not MaDfr. Our data thus serve as a cautionary note of the potential to be misled by candidate genes and highlight the utility and necessity of collecting multiple pieces of corroborating genetic evidence to characterize the molecular basis of this trait. In doing so, we provide consistent support for a genetic model that explains the evolution of pre-mating isolation between two ecotypes at the early stages of divergence: a cis-regulatory mutation in MaMyb2 is responsible for ecotypic differences in MaMyb2 expression, which subsequently affects the regulation of MaF3h, MaDfr, and MaAns in flowers and leads to concomitant changes in floral anthocyanin pigmentation between the ecotypes.
Divergent selection contributes to incipient species differences
Because MaMyb2 contributes to adaptive flower color differences that appear to act as a partial barrier to gene flow between ecotypes, genetic variation in this locus is expected to exhibit a pattern of intense, spatially-structured differentiation across the geographic range of both ecotypes [21], [50], [51]. By taking complementary molecular population genetic approaches to test this hypothesis, our results provide support for this scenario and suggest that divergent selection on flower color has shaped the geographic distribution of MaMyb2 alleles during these early stages of incipient species formation.
Theory suggests that population divergence can occur despite gene flow when divergent selection is strong. This is expected to result in a heterogeneous pattern of genomic differentiation, such that genetic variation at selected loci contributing to reproductive isolation will become highly differentiated, but genomic regions not affecting isolation will be permeable to gene flow (e.g. [52]). Although estimates of FST between the ecotypes are low at presumed neutral loci [33], we identified substantially elevated FST at all five genetic markers in MaMyb2 (M1–M5) (Table 1). Thus, despite historically high levels of gene flow across the hybrid zone, ongoing selection appears to maintain genetic differentiation at MaMyb2. Surprisingly, although our genetic experiments have refuted MaDfr's major involvement in flower color change, we also found very high allelic differentiation at D1–D4 (Table 1).
While these locus-specific patterns of elevated FST are indicative of positive selection, we further dissected the patterns of differential selection affecting the ecotypes by estimating the shape and geographic position of the allele frequency clines at these markers [47], [48]. Cline shape and position are directly related to the interaction between selection, which acts to maintain and steepen clines, and gene flow, which acts to widen or eliminate them [19], [20]. Thus, variation in the form and intensity of selection is expected to generate heterogeneity in introgression among loci, resulting in different cline shapes [49], [51]. For example, genetic incompatibilities that render hybrids unfit typically result in coincident clines across the majority of loci [50]. On the other hand, differences in the environment may favor alternate alleles at a locus, resulting in clines that vary in position and width according to the location and scale of the underlying environmental gradients [17]. Consequently, when intrinsic crossing barriers are absent, comparison of cline shapes and positions can describe the form and intensity of selection among loci.
The allele frequency clines among the nine SNPs group into three categories that differ significantly in shape, geographic position, and patterns of introgression (Figure 7), and these differences provide insight into the evolutionary processes that have generated these patterns.
For example, M1 and M2 are nearly fixed for R alleles in the west, but both R and Y alleles segregate in eastern populations (Figure 8). Indeed, among 267 red ecotype plants sampled from 16 populations, no YY homozygotes were found, resulting in a R allele frequency >0.996 (Table 1). By contrast, in 107 yellow ecotype individuals sampled from six populations, markers M1 and M2 segregated for all three genotypes, with the R allele frequency ranging between 0.158 (M1) and 0.256 (M2) (Table 1). Even though M1 and M2 are located within the MaMyb2 gene, these patterns of genetic variation result in significantly wider clines that are east-shifted relative to the flower color cline (Figure 8), suggesting that these markers may have experienced a different evolutionary history that does not completely track the geographic variation in flower color.
Despite this apparent eastward introgression of R alleles at M1 and M2, we see the opposite pattern at D1–D4 (Table 1). Specifically, in the red ecotype populations, substantial genetic variation exists, with frequencies of the R allele ranging between 0.764 (D4) and 0.806 (D1) (Table 1). However, in the yellow ecotype populations, the R allele is nearly absent (<0.051) at all four markers (Table 1), with the Y allele achieving complete fixation in the most eastern populations (Figure 8). These patterns suggest asymmetries in the direction that alleles introgress at different loci. Moreover, they demonstrate that the opportunity for bi-directional gene flow exists across the hybrid zone. Nevertheless, R and Y alleles at M3–M5 are fixed or nearly fixed in their respective habitats, suggesting that introgression of non-native alleles at these loci is prevented due to selection. For markers M3–M5 only a single RR homozygote was found in yellow ecotype populations and no YY homozygotes were found in the red ecotype populations (Table 1), leading to exceptionally high allelic differentiation (e.g. FST at M5 is 1). We also detected tight concordance between the clines at M3–M5 and the phenotypic cline in flower color (Figure 7). This is consistent with the combined effect of strong divergent selection exerted by pollinators in alternate environments, an additive mode of gene action at MaMyb2 (Figure 4A), and a series of three genetic markers in MaMyb2 each in extremely tight linkage disequilibrium with the causal mutation. As a consequence, the resulting allele frequencies of markers M3–M5 almost perfectly track the geographic shift in flower color, reflecting the impact of divergent natural selection on this gene.
Variation in the shape and geographic position of clines among loci in M. aurantiacus contrasts with examples of clinal variation across other well-known hybrid zones. For example, in the classic house mouse hybrid zone between Mus domesticus and M. musculus across Europe, reproductive isolation arises mostly from intrinsic post-zygotic isolation due to genetic incompatibilities that evolved while in allopatry [53]. As a consequence of recent secondary contact and a balance between dispersal and hybrid unfitness, clines at most loci are concordant in shape and geographic position. In contrast, previous data on the Mimulus aurantiacus hybrid zone do not support a role for recent secondary contact following a long period of allopatry [33]. Instead, the hybrid zone appears to be maintained in the face of gene flow due primarily to divergent selection on traits such as flower color that confer strong, but incomplete pre-mating barriers. Therefore, if environmental heterogeneity exists across the hybrid zone, loci are likely to respond independently to multiple gradients of selection. This would explain the discord in patterns of introgression and cline center that we observe between markers M3–M5 and D1–D4 despite both sets of clines being very steep.
The recombination distance separating MaMyb2 and MaDfr (11 cM) probably translates to a physical distance of several hundred kb or more. While the potential exists that epistasis and linkage lead to complex patterns of genetic variation across this region, it seems unlikely that the observed signatures of selection at D1–D4 are driven by hitch-hiking with MaMyb2. More likely, a single chromosomal region containing two candidate anthocyanin pathway genes appears to harbor independently selected loci, only one of which is directly related to incipient species differences in flower color. Future efforts will attempt to characterize the molecular basis of the interaction between MaMyb2 and other loci that control flower color [35], as well as to characterize the genetic basis of other floral traits potentially involved in pollinator isolation. These and other population genomic analyses may help to ascertain the precise genetic target of selection being tracked by SNPs D1–D4 in order to determine its role in maintaining ecotypic differences.
Conclusions
In this study, we genetically characterized an ecologically important transition in flower color between M. aurantiacus ecotypes that confers pre-mating isolation due to differences in pollinator preference. The combination of genetic mapping in the lab and field, differential gene expression, gene knockdowns, and allelic imbalance demonstrates consistent and compelling support that genetic variation in the form of a cis-acting mutation in MaMyb2 is responsible for the major genetic transition in flower color between the red and yellow ecotypes. Our results also support the remarkable pattern of genetic convergence of flower color transitions identified previously among species [38]. Even though mutations in multiple genes can cause pigmentation differences, there is a significant fixation bias favoring mutations in R2R3-MYB genes, such that all documented transitions between species involve allelic differences in this family of transcription factor. Our results demonstrate that MaMyb2 alleles have fixed differentially between ecotypes, providing further support for the prediction that natural selection has preferentially targeted these mutations because they have fewer deleterious pleiotropic effects relative to other mutations that cause similar changes in flower color [38], [40].
In addition, we used molecular population genetics to show that spatial variation in flower color across a natural hybrid zone was accompanied by concordant spatial variation of alleles in MaMyb2, reflecting a history of divergent selection on flower color. Our focus on a trait that diverged due to differential selection between two partially isolated ecotypes has provided us with a powerful opportunity to demonstrate the ecological and functional mechanisms controlling the evolution of reproductive isolation at the early stages of incipient speciation between these ecotypes. Ecologically based divergent selection is a pervasive feature of speciation [5]–[7], and the functional role of MaMyb2 in pollinator isolation, coupled with the pattern of strong divergent selection indicated here, provides a rare example of a ‘speciation gene’ affecting pre-mating isolation during incipient species formation.
Materials and Methods
Identification of R2R3-MYB genes
Our previous work in M. aurantiacus suggested that a transcription factor linked to MaDfr was the major contributor of ecotypic differences in flower color. Therefore, we screened the M. guttatus genome (v. 1.1) to search for candidate anthocyanin genes linked to MgDfr. MgDfr occurs on linkage group 8 in M. guttatus [54] and is found on the third largest sequence scaffold (4.38 Mbp). No candidate anthocyanin genes were located on this scaffold. However, three floral anthocyanin regulators in the R2R3-MYB family of transcription factors (MgMyb1-3) were also shown to map to linkage group 8 but scaffold 11 (2.97 Mbp) [31]. Based on the known physical location of mapped markers on scaffold 11 in M. guttatus and the genetic map presented in [54], we deduced that MgDfr was approximately 101 cM from MgMyb1-3.
To identify the homologous R2R3-MYB genes in M. aurantiacus, we used 3′ Rapid Amplification of Complementary DNA (cDNA) Ends (3′ RACE) (Invitrogen). Total RNA was isolated from flower buds using the Spectrum Plant Total RNA kit (Sigma), followed by on-column DNase digestion. First-strand cDNA was synthesized using the Promega M-MLV reverse transcriptase. Two nested degenerate PCR primers were designed based on conserved regions of MgMyb1-3. PCR products were ligated into the pGEM-T-Easy vector (Promega) and inserts were sequenced from 14 plasmids. PCR primers for these and all subsequent experiments can be found in Table S7.
Genetic mapping
MaMyb1 was shown previously to be unlinked to MaDfr [35]. We genetically mapped MaMyb2, MaMyb3 and MaDfr in 384 F2 hybrids. The details of the cross, development of the MaDfr genetic marker, DNA isolation, and flower color phenotyping (i.e. anthocyanin content) all have been described previously [35]. We identified SNPs from MaMyb2 and MaMyb3 that varied in the parents of this cross. Allelic differences were assayed using restriction digestion of PCR products followed by size separation with agarose gel electrophoresis. We tested the null hypothesis that segregation of each gene occurred independently.
MaMyb2 sequencing
To obtain the complete coding sequence of MaMyb2, we performed 5′ RACE (Invitrogen) from floral cDNA. We then sequenced the entire gene from genomic DNA (gDNA) using species-specific primers from individuals from three different red and yellow ecotype populations (Table S4). In addition, we sequenced two individuals from different M. aridus populations (32.6538°, −116.1001°; and 32.6526°, −116.2449°) and one individual from M. clevelandii (33.1589°, −116.8122°) using the same primers. Gene trees of R2R3-MYB-related genes were constructed as described previously [35].
Gene expression
We harvested flower buds from a red ecotype plant at 16 developmental stages. Total RNA was isolated and cDNA synthesized from eight stages from 250 ng RNA (Figure S3). PCR was carried out with varying cycle numbers using iProof High-Fidelity DNA polymerase (Bio-Rad) with primers designed using Primer Express v. 3.0 (Applied Biosystems). Ef1a controlled for cDNA quality, as described previously [35]. We qualitatively assayed for differences in MaMyb2 floral expression using plants grown from seed in the University of Oregon greenhouses. Two flower buds per plant were harvested at stage 14 for RNA isolation and cDNA synthesis. PCR was carried out as described above. Strong and consistent differences in expression between the ecotypes at MaF3h, MaDfr, and MaAns were demonstrated previously [35], and were not replicated here. We performed quantitative real time PCR (QPCR) in 18 F3 hybrids of known genotype at MaMyb2, as described previously [35].
Virus-induced gene silencing (VIGS)
We amplified a 324-bp fragment of MaMyb2 using iProof High-Fidelity DNA polymerase from the full-length cDNA clone. The fragment was subcloned into the BamHI/XhoI sites of the pTRV2 vector (as described [43]) to generate the pTRV2-MaMyb2 silencing construct. This construct shared little sequence similarity with MaMyb1 and MaMyb3 (Figure S1), indicating that, among the floral-expressed R2R3-MYBs, this silencing construct is likely specific for MaMyb2. The pTRV2-MaMyb2, pTRV2 (without the silencing construct) and pTRV1 (necessary for viral replication) vectors were transformed into Agrobacterium tumefasciens (strain GV3101). Single colonies containing each construct were used to inoculate 5 ml LB media plus antibiotics with shaking at 30°C. 4 ml pTRV1 and 3 ml pTRV2 and pTRV2-MaMyb2 cultures were used to inoculate 500 ml LB+ antibiotics +10 mM MES +20 µM acetosyringone until OD600 = 1.0–1.2. Cells were harvested by centrifugation and pellets resuspended in infiltration solution (10 mM MES, 200 µM acetosyringone, 10 mM MgCl2,) to an OD600 = 2. Cells were incubated at room temperature for 4 hours before vacuum infiltration.
Seeds from the red ecotype were germinated on moist potting soil under artificial light in plug trays. At the 2–4 leaf stage, 384 seedlings were submerged in infiltration medium containing pTRV1 and pTRV2-MaMyb2 mixed in a 1∶1 ratio with 0.005% Silwet L-70 and infiltrated under vacuum (20 in-Hg) for 3 min. As a negative control, 96 seedlings were treated with pTRV1 and pTRV2. Seedlings were re-potted and placed in a growth room at 25°C and sub-irrigated as necessary.
We collected entire corollas at stage 14 from nine plants treated with pTRV2-MaMyb2 and four from pTRV2-treated negative control plants. As additional controls, corollas from four treated plants not showing altered flower colors and four plants not treated or vacuum infiltrated were collected. Total RNA was isolated and DNase-treated as described above. Validation of viral gene expression was detected using PCR from cDNA with primers specific for pTRV1 and pTRV2 plasmids (Figure S1). We used QPCR as described above to compare expression of MaMyb2, MaF3h, MaDfr, and MaAns between pTRV2-MaMyb2 (N = 8) and pTRV2 (N = 4) treatments.
Allelic imbalance
To compare expression of individual alleles, we determined the relative frequency that the R and Y MaMyb2 alleles were cloned from PCR products of F1 cDNA and gDNA. Five F1 heterozygotes were generated from independent crosses between red and yellow ecotype individuals from separate populations. A single F1 from each cross was grown to flowering, and two flower buds were collected from each plant for RNA isolation and cDNA synthesis. In addition, gDNA was isolated from leaf tissue from each plant. We then used PCR to amplify a 198-bp region of the MaMyb2 5′ untranslated region containing a SNP that introduces an HhaI restriction site (marker M1; see Table S3 for details). PCR products were ligated into the pGem T-easy vector (Promega) and transformed into chemically competent E. coli. We performed a PCR using M13F and M13R vector-specific primers to amplify alleles from transformed colonies, followed by HhaI restriction digestion of the PCR product and agarose gel electrophoresis to count the relative frequency of R and Y alleles obtained from cDNA and gDNA. The following number of colonies were genotyped for each family (gDNA/cDNA): Family A, 80/70; Family B, 45/92; Family C, 45/92; Family D, 86/71; Family E, 37/22. We then used Fisher's exact test in each family to determine whether allele counts in gDNA and cDNA differed from each other and from equal representation.
Natural population genotyping
Markers M1–M5 were identified from MaMyb2 gDNA sequences. D1–D4 were designed by screening the annotated M. guttatus genome sequence (v. 1.1) on Phytozome v. 8.0 (www.phytozome.net). The Dfr gene in M. guttatus maps to scaffold 3, position: 4,218,020–4,220,275. We scanned 10 kb upstream and 10 kb downstream on scaffold 3 and identified four genes (including MaDfr) suitable for marker development (D1–D4). D1–D4 span four genes and 15-kb in M. guttatus and were identified from sequencing gDNA of homologous regions from M. aurantiacus. PCR primers and genotyping protocols for each marker are listed in Table S3. We confirmed that markers D1–D4 were linked to each other (as assumed based on their physical location in M. guttatus) by genotyping a panel of 24 F2s at markers D1–D4. No recombinants with MaDfr were identified. Genotypes from naturally occurring individuals were classified as RR, RY, or YY depending on whether alleles were derived from the red-ecotype (R-allele) or the yellow-ecotype (Y-allele) parents in these F2s.
We collected leaf tissue from 542 M. aurantiacus plants from 30 populations of both ecotypes and their hybrids (Table S4). Within the hybrid zone, we scored plants as red, red-orange, orange, or yellow. To confirm that these categories accurately reflected differences in anthocyanin content, we scored flowers from 66 plants from two hybrid populations (BS and WM) using the four categories and by quantitatively assaying anthocyanin content of each flower as described [35]. A one-way ANOVA was used to demonstrate that category significantly predicted quantitative anthocyanin content in each population (FBS(3,61) = 105.6, P<0.0001, R2 = 0.84; FWM(3,62) = 232.4, P<0.0001, R2 = 0.92;). FST between ecotypes was calculated for each of the nine markers from an analysis of molecular variance, as implemented in GenoDive version 2.0b22 [55].
Hybrid zone associations
Genotype-phenotype association studies were conducted in SAS using Fisher's exact test of flower color category vs. marker in the pooled hybrid dataset from the eight hybrid populations (Table S5).
Estimation of cline shape parameters
We used an approach developed by Szymura and Barton [47] and modified by Porter et al. [48] to describe the relationship between allele frequency at the nine SNPs and geography. Cline shape is directly related to the interaction between selection, which acts to maintain and steepen clines, and gene flow, which acts to widen them. The model we used relates allele frequency (p) and geographic distance (x) by three equations:


These equations provide information on the shape, position, and patterns of introgression across the cline. Equation 1 provides the characteristic sigmoidal shape in the center of the cline, and equations 2 and 3 describe the exponential change in allele frequency on either side of the cline. The equations are related by the fact that as θ and z approach 1 and 0, respectively, equations 2 and 3 approach the shape of equation 1. Allele frequency was estimated for each SNP in each of the 30 populations. Because populations were sampled in two dimensions (north/south and east/west), but the major shift in flower color occurs in one dimension (east/west), population localities were assigned geographic distances along the east/west gradient based on the shortest, straight line distance of each population to the coast. Allele frequencies and geographic distance for each population and SNP are listed in Table S8. Distance metrics based on longitude provide qualitatively similar results. The six parameters described in the above equations were estimated using maximum likelihood (ML), as implemented in the program ClineFit v. 0.2 (http://people.umass.edu/aporter/software/index.html) and described by Porter et al. [48].
For each of the nine SNPs, we used an eight parameter model with default settings to jointly estimate the above parameters along with the asymptotic allele frequencies on the left and right sides of the cline (pL and pR). For all SNPs except M1, the eight parameter model fit the data significantly better than a two parameter model that only estimates c and w (likelihood ratio tests of the full (eight-parameter) vs. reduced (two-parameter) model; M2–M5, D1–D4: P<0.05; M1: P = 0.053; 6 d.f.). Additional runs using either different random seeds or a greater number of sampling iterations provided similar outcomes. In addition to the nine SNP markers, we also obtained parameter estimates for the flower color cline from these same populations. Individuals were coded as one of three genotypes based on flower color: 1) red (RR); 2) red-orange and orange (RY); and 3) yellow (YY). Maximum likelihood estimates and 2-log-likelihood support values (analogous to 95% confidence intervals) for all parameters are presented in Table S6.
We then compared cline shapes among each SNP and the flower color cline using likelihood ratio tests (LRT). Because we estimated eight parameters, but only six parameters are necessary to define cline shape, we first fixed pL and pR to the ML estimates obtained from SNP i and then re-estimated the likelihood of observing the data at SNP i by constraining the six shape parameters to the ML estimates from SNP j. Thus, only the six shape parameters differed between the two models. Two times the differences in log-likelihood values for the freely estimated vs. constrained model were compared to a χ2 distribution with six degrees of freedom. LRTs were performed for all pairwise comparisons among the ten markers (nine SNPs and the flower color data), and statistical significance was determined after controlling for multiple comparisons using a Bonferroni-corrected α = 0.00056.
Supporting Information
Zdroje
1. CoyneJA, OrrHA (1998) The evolutionary genetics of speciation. Phil Trans Royal Soc London B 353 : 287–305.
2. Coyne JA, Orr HA (2004) Speciation. Sunderland, MA: Sinauer Associates.
3. SchluterD (2001) Ecology and the origin of species. Trends Ecol Evol 16 : 372–380.
4. OrrHA (2005) The genetic basis of reproductive isolation: Insights from Drosophila. Proc Natl Acad Sci USA 102 : 6522–6526.
5. SobelJM, ChenGF, WattLR, SchemskeDW (2010) The biology of speciation. Evolution 64 : 295–315.
6. Schluter D (2000) The Ecology of Adaptive Radiation. Oxford: Oxford University Press.
7. RundleHD, NosilP (2005) Ecological speciation. Ecology Letters 8 : 336–352.
8. SchluterD (2009) Evidence for ecological speciation and its alternative. Science 323 : 737–741.
9. NoorMAF (2003) Evolutionary biology - Genes to make new species. Nature 423 : 699–700.
10. WuCI, TingCT (2004) Genes and speciation. Nat Rev Genet 5 : 114–122.
11. BarbashDA, SiinoDF, TaroneAM, RooteJ (2003) A rapidly evolving MYB-related protein causes species isolation in Drosophila. Proc Natl Acad Sci USA 100 : 5302–5307.
12. NosilP, SchluterD (2011) The genes underlying the process of speciation. Trends Ecol Evol 26 : 160–167.
13. ViaS (2009) Natural selection in action during speciation. Proc Natl Acad Sci USA 106 : 9939–9946.
14. RiesebergLH, BlackmanBK (2010) Speciation genes in plants. Annals of Botany 106 : 439–455.
15. NoorMAF, FederJL (2006) Speciation genetics: evolving approaches. Nat Rev Genet 7 : 851–861.
16. RiceWR, HostertEE (1993) Laboratory experiments on speciation: What have we learned in 40 years? Evolution 47 : 1637–1653.
17. HewittGM (1988) Hybrid zones - natural laboratories for evolutionary studies. Trends Ecol Evol 3 : 158–167.
18. HarrisonRG (1990) Hybrid zones: windows on evolutionary process. Oxford Surveys in Evolutionary Biology 7 : 69–128.
19. HaldaneJBS (1948) The theory of a cline. Heredity 56 : 337–349.
20. Endler JA (1977) Geographic Variation, Speciation, and Clines. Princeton: Princeton University Press.
21. BartonNH, HewittGM (1985) Analysis of hybrid zones. Ann Rev Ecol Syst 16 : 113–148.
22. LowryDB, ModliszewskiJL, WrightKM, WuCA, WillisJH (2008) The strength and genetic basis of reproductive isolating barriers in flowering plants. Phil Trans Royal Soc B 363 : 3009–3021.
23. GrantV (1949) Pollination systems as isolating mechanisms in Angiosperms. Evolution 3 : 82–97.
24. Grant V (1981) Plant Speciation. New York: Columbia University Press.
25. GrantV (1993) Origin of floral isolation between ornithophilous and sphingophilous plant-species. Proc Natl Acad Sci USA 90 : 7729–7733.
26. BradshawHD, SchemskeDW (2003) Allele substitution at a flower colour locus produces a pollinator shift in monkeyflowers. Nature 426 : 176–178.
27. HopkinsR, RausherMD (2012) Pollinator-mediated selection on flower color allele drives reinforcement. Science 335 : 1090–1092.
28. QuattrocchioF, WingJ, van der WoudeK, SouerE, de VettenN, et al. (1999) Molecular analysis of the anthocyanin2 gene of petunia and its role in the evolution of flower color. Plant Cell 11 : 1433–1444.
29. HoballahME, GubitzT, StuurmanJ, BrogerL, BaroneM, et al. (2007) Single gene-mediated shift in pollinator attraction in Petunia. Plant Cell 19 : 779–790.
30. WhibleyAC, LangladeNB, AndaloC, HannaAI, BanghamA, et al. (2006) Evolutionary paths underlying flower color variation in Antirrhinum. Science 313 : 963–966.
31. CooleyAM, ModliszewskiJL, RommelML, WillisJH (2011) Gene duplication in Mimulus underlies parallel floral evolution via independent trans-regulatory changes. Current Biology 21 : 700–704.
32. StreisfeldM, KohnJ (2007) Environment and pollinator-mediated selection on parapatric floral races of Mimulus aurantiacus. J Evol Biol 20 : 122–132.
33. StreisfeldM, KohnJ (2005) Contrasting patterns of floral and molecular variation across a cline in Mimulus aurantiacus. Evolution 59 : 2548–2559.
34. BeeksRM (1962) Variation and hybridization in southern California populations of Diplacus (Scrophulariaceae). El Aliso 5 : 83–122.
35. StreisfeldM, RausherM (2009) Altered trans-regulatory control of gene expression in multiple anthocyanin genes contributes to adaptive flower color evolution in Mimulus aurantiacus. Mol Biol Evol 26 : 433–444.
36. Rausher MD (2006) The evolution of flavonoids and their genes. In: Grotewold E, editor. The Science of Flavonoids. New York: Springer. pp. 175–212.
37. Quattrocchio F, Baudry A, Lepiniec L, Grotewold E (2006) The regulation of flavonoid biosynthesis. In: Grotewold E, editor. The Science of Flavonoids. New York: Springer. pp. 97–122.
38. StreisfeldMA, RausherMD (2011) Population genetics, pleiotropy, and the preferential fixation of mutations during adaptive evolution. Evolution 65 : 629–642.
39. StrackeR, WerberM, WeisshaarB (2001) The R2R3-MYB gene family in Arabidopsis thaliana. Curr Op Plant Biol 4 : 447–456.
40. SchwinnK, VenailJ, ShangYJ, MackayS, AlmV, et al. (2006) A small family of MYB-regulatory genes controls floral pigmentation intensity and patterning in the genus Antirrhinum. Plant Cell 18 : 831–851.
41. DubosC, StrackeR, GrotewoldE, WeisshaarB, MartinC, et al. (2010) MYB transcription factors in Arabidopsis. Trends Plant Sci 15 : 573–581.
42. StorzJF (2005) Using genome scans of DNA polymorphism to infer adaptive population divergence. Mol Ecol 14 : 671–688.
43. LiuYL, SchiffM, MaratheR, Dinesh-KumarSP (2002) Tobacco Rar1, EDS1 and NPR1/NIM1 like genes are required for N-mediated resistance to tobacco mosaic virus. Plant J 30 : 415–429.
44. WittkoppPJ, HaerumBK, ClarkAG (2004) Evolutionary changes in cis and trans gene regulation. Nature 430 : 85–88.
45. Munz PA, Keck DD (1973) A California Floral and Supplement. Berkeley, CA: University of California Press.
46. BeardsleyPM, SchoenigSE, WhittallJB, OlmsteadRG (2004) Patterns of evolution in Western North American Mimulus (Phrymaceae). Am J Bot 91 : 474–489.
47. SzymuraJM, BartonNH (1986) Genetic analysis of a hybrid zone between the fire-bellied toads, Bombina bombina and Bombina variegata, near Cracow in Southern Poland. Evolution 40 : 1141–1159.
48. PorterAH, WengerR, GeigerH, SchollA, ShapiroAM (1997) The Pontia daplidice-edusa hybrid zone in northwestern Italy. Evolution 51 : 1561–1573.
49. PayseurBA (2010) Using differential introgression in hybrid zones to identify genomic regions involved in speciation. Mol Ecol Res 10 : 806–820.
50. BartonNH, HewittGM (1989) Adaptation, speciation and hybrid zones. Nature 341 : 497–503.
51. Barton NH, Gale KS (1993) Genetic analysis of hybrid zones. In: Harrison RG, editor. Hybrid Zones and the Evolutionary Process. New York: Oxford University Press. pp. 13–45.
52. NosilP, EganSR, FunkDJ (2008) Heterogeneous genomic differentiation between walking-stick ecotypes: “Isolation by adaptation” and multiple roles for divergent selection. Evolution 62 : 316–336.
53. PayseurBA, KrenzJG, NachmanMW (2004) Differential patterns of introgression across the X chromosome in a hybrid zone between two species of house mice. Evolution 58 : 2064–2078.
54. LowryDB, HallMC, SaltDE, WillisJH (2009) Genetic and physiological basis of adaptive salt tolerance divergence between coastal and inland Mimulus guttatus. New Phytologist 183 : 776–788.
55. MeirmansPG, Van TienderenPH (2004) GENOTYPE and GENODIVE: two programs for the analysis of genetic diversity of asexual organisms. Mol Ecol Notes 4 : 792–794.
Štítky
Genetika Reprodukční medicínaČlánek vyšel v časopise
PLOS Genetics
2013 Číslo 3
Nejčtenější v tomto čísle
- Fine Characterisation of a Recombination Hotspot at the Locus and Resolution of the Paradoxical Excess of Duplications over Deletions in the General Population
- Molecular Networks of Human Muscle Adaptation to Exercise and Age
- Recurrent Rearrangement during Adaptive Evolution in an Interspecific Yeast Hybrid Suggests a Model for Rapid Introgression
- Genome-Wide Association Study and Gene Expression Analysis Identifies as a Predictor of Response to Etanercept Therapy in Rheumatoid Arthritis