
A Stress-Induced Small RNA Modulates Alpha-Rhizobial Cell Cycle Progression
Microorganisms frequently encounter adverse conditions unfavorable for cell proliferation. They have evolved diverse mechanisms, including transcriptional control and targeted protein degradation, to adjust cell cycle progression in response to environmental cues. Non-coding RNAs are widespread regulators of various cellular processes in all domains of life. In prokaryotes, trans-encoded small non-coding RNAs (trans-sRNAs) contribute to a rapid cellular response to changing environments, but so far have not been directly related to cell cycle regulation. Here, we report the first example of a trans-sRNA (EcpR1) with two experimentally confirmed targets in the core of cell cycle regulation and demonstrate that in the plant-symbiotic alpha-proteobacterium Sinorhizobium meliloti the regulatory mechanism involves base-pairing of this sRNA with the dnaA and gcrA mRNAs. Most trans-sRNAs are restricted to closely related species, but the stress-induced EcpR1 is broadly conserved in the order of Rhizobiales suggesting an evolutionary advantage conferred by ecpR1. It broadens the functional diversity of prokaryotic sRNAs and adds a new regulatory level to the mechanisms that contribute to interlinking stress responses with the cell cycle machinery.
Published in the journal:
. PLoS Genet 11(4): e32767. doi:10.1371/journal.pgen.1005153
Category:
Research Article
doi:
https://doi.org/10.1371/journal.pgen.1005153
Summary
Microorganisms frequently encounter adverse conditions unfavorable for cell proliferation. They have evolved diverse mechanisms, including transcriptional control and targeted protein degradation, to adjust cell cycle progression in response to environmental cues. Non-coding RNAs are widespread regulators of various cellular processes in all domains of life. In prokaryotes, trans-encoded small non-coding RNAs (trans-sRNAs) contribute to a rapid cellular response to changing environments, but so far have not been directly related to cell cycle regulation. Here, we report the first example of a trans-sRNA (EcpR1) with two experimentally confirmed targets in the core of cell cycle regulation and demonstrate that in the plant-symbiotic alpha-proteobacterium Sinorhizobium meliloti the regulatory mechanism involves base-pairing of this sRNA with the dnaA and gcrA mRNAs. Most trans-sRNAs are restricted to closely related species, but the stress-induced EcpR1 is broadly conserved in the order of Rhizobiales suggesting an evolutionary advantage conferred by ecpR1. It broadens the functional diversity of prokaryotic sRNAs and adds a new regulatory level to the mechanisms that contribute to interlinking stress responses with the cell cycle machinery.
Introduction
Non-coding RNAs (ncRNAs) have shot to prominence as significant and ubiquitous regulators that are involved in the control of various cellular processes in most eukaryotic and prokaryotic organisms. Although the development of deep-sequencing technologies has allowed for the identification of an ever-growing number of ncRNAs the biological functions and regulatory mechanisms of the vast majority remain veiled. In eukaryotes, short-interfering RNAs (siRNA) and microRNAs (miRNAs) have emerged as a priority research area in biomedicine [1] since they control crucial cellular processes, such as cell development, differentiation and oncogenic transformation [2]. For instance, the miR-34 family mimics p53 activity, inducing cell-cycle arrest and apoptosis [3]. Plant ncRNAs have been reported to regulate stress adaptation and defence responses, but also cell differentiation, such as miR169 that was associated with nodule development in legumes [4,5]. In the fission yeast Schizosaccharomyces pombe, meiRNA plays a role in recognition of homologous chromosomes for pairing and thus is essential for progression of meiosis [6,7].
Prokaryotic trans-encoded small RNAs (trans-sRNAs) may be considered functional analogs of eukaryotic siRNAs and miRNAs in their ability to post-transcriptionally control gene expression by modulating mRNA translation and stability. The canonical regulatory mechanism of bacterial trans-sRNAs involves pairing with a single short binding site within the 5’-untranslated region (UTR) of the target mRNA, which results in formation of an sRNA-mRNA duplex blocking the ribosome binding site (RBS) and/or promoting degradation by RNases [8]. Expression of bacterial sRNAs is commonly stimulated under stress conditions and contributes to the rapid cellular response and adaptation to changing environments. The majority of functionally characterized bacterial sRNAs controls crucial physiological processes like metabolism, transport, chemotaxis, virulence, and quorum sensing [9].
Regulation of DNA replication and cell cycle progression in response to environmental cues is critical to ensure cell survival. Mechanisms involving small molecule-based signaling, protein-protein interactions or regulated proteolysis have been implicated with a delay of replication initiation or septum formation upon facing hostile factors [10]. It is tempting to speculate that trans-sRNA-mediated post-transcriptional regulation may also contribute to rapid adaptive stress responses of the cell cycle control circuit in bacteria.
The α-proteobacterium Caulobacter crescentus is an important model organism for studying cell cycle regulation. In this bacterium, replication is initiated only once per cell cycle [11,12]. This tight control and exact timing is governed by oscillating concentrations of at least three master regulators, DnaA, GcrA, and CtrA that coordinate the spatio-temporal pattern of phase-specific events ultimately leading to asymmetric cell division [13,14]. DnaA mediates replication initiation and activates gcrA expression. GcrA controls components of the replication and segregation machinery and finally induces expression of ctrA. CtrA blocks replication initiation by binding to the origin of replication and regulates more than 100 genes. Among these are genes involved in cell division, cell wall metabolism, and motility [15,16]. CtrA activation is driven by the essential CckA-ChpT phosphorelay, which further inactivates CpdR-mediated CtrA proteolysis by phosphorylating this response regulator. When activated by its principal kinase DivJ, DivK silences the CckA-ChpT relay through DivL, allowing for CtrA degradation and replication initiation. Subsequently, DivK is inactivated by dephosphorylation through its primary phosphatase PleC [17].
In the class of α-proteobacteria, several surveys of the non-coding RNome delivered a plethora of trans-sRNAs [18–20]. The most comprehensive inventories were performed for members of the Rhizobiaceae including Sinorhizobium meliloti [21,22]. S. meliloti exists either in a free-living lifestyle in the soil or in root nodule symbiosis with a leguminous host plant [23,24]. It has emerged as model organism to study adaptation to stress conditions and switching between complex lifestyles. The cell cycle of C. crescentus and free-living S. meliloti shows striking similarities that include initiation of replication only once per cell cycle and asymmetric cell division. In spite of species-specific rearrangements of the α-proteobacterial cell cycle regulon, a transcriptional analysis of synchronized S. meliloti cells has recently identified a conserved core of cell cycle regulated transcripts shared with C. crescentus [25] and confirmed previous computational comparisons of cell cycle-related genes in α-proteobacteria [26].
Taking advantage of the comprehensive data resource of trans-sRNAs in S. meliloti and related α-proteobacteria, we aimed at identifying riboregulators that post-transcriptionally affect bacterial cell cycle progression. Here, we report on the functional analysis of the stress-induced trans-sRNA EcpR1 that is conserved in several members of the Rhizobiales. We present evidence for EcpR1 negatively regulating dnaA and gcrA at the post-transcriptional level mediated by base-pairing between a strongly conserved loop of this sRNA and the target mRNAs. Our data suggests that EcpR1 contributes to a regulatory network connecting stress adaptation and cell cycle progression.
Results
EcpR1 target prediction shows enrichment of cell cycle-related genes
Hypothesizing that riboregulators affecting cell cycle control are more likely to be found among phylogenetically conserved trans-sRNAs we performed mRNA target predictions for 27 previously defined RNA families with members in at least two species [27] applying CopraRNA [28]. The predicted targets were screened for an enrichment of cell cycle-related genes. The CopraRNA algorithm considers base pairing strength, hybridization free energy and accessibility of the interaction sites, and integrates phylogenetic information to predict conserved sRNA-mRNA interactions. Many sRNAs base pair at the RBS, however, translation can also be blocked when the pairing region is located 50 or more nucleotides (nt) upstream the RBS or in the open reading frame [29,30]. As suggested by Wright et al. [28], predictions were therefore based on sequences 200 nt upstream and 100 nt downstream of the annotated start codons.
Targets predicted for the sRNA family established by the S. meliloti trans-sRNA SmelC291 show a significant enrichment (P-value = 2.5*10-5) of cell cycle-related mRNAs (n = 7) among the top-ranked candidates (P≤0.01, n = 89; S1 Table) [27]. The 23 family members are broadly distributed among the Rhizobiales including members in the Rhizobiaceae, Phyllobacteriaceae, Xanthobacteriaceae, Beijerinckaceae, and Hyphomicrobiaceae. SmelC291, previously named SmrC10 or Sra33, was first identified by comparative genomic predictions of sRNAs [31] and confirmed by RNAseq [21]. In this study we renamed it EcpR1 (elongated cell phenotype RNA1) according to the phenotype induced by its overproduction (see below). In S. meliloti, ecpR1 is located in the intergenic region between the divK-pleD operon coding for an essential cell cycle response regulator and a diguanylate cyclase, respectively [32] and rpmG encoding the 50S ribosomal protein L33 (Fig 1A). In the Rhizobiacea, this genomic locus is highly microsyntenic [27]. Northern blot hybridizations confirmed ecpR1 expression from an independent transcription unit [33] and RNAseq coverage data suggested variants of different length with a dominant 101 nt sRNA [21] which is predicted to form a stable structure with two defined stem-loop domains, SL1 and SL2 (Fig 1A, S1A Fig). SL1 is strongly conserved and positions C16 to G36 (according to the numbering of EcpR1 nucleotides in Fig 1A) including the loop sequence are identical in all species with EcpR1 homologs analyzed by Reinkensmeier et al. [27]. The 3’-region harbors a putative Rho-independent terminator and 4 terminal U residues (S1A Fig).

In the Rhizobiaceae, gcrA, dnaA, and pleC mRNAs appeared among the five top predicted targets (positions 1, 3 and 5, respectively). Furthermore, the two ftsZ homologs (ftsZ1 and ftsZ2), ctrA and minD encoding a close homolog of the Escherichia coli cell division inhibitor [34] were in the top 40 list (P<0.005) of EcpR1 targets (S1 Table). Although there was less agreement with targets predicted in more distantly related members of the Rhizobiales, gcrA and minD mRNAs were also assessed as highly probable targets when predictions included Mesorhizobium strains belonging to the Phyllobacteriaceae (P<0.001) or members of the Xanthobacteriaceae (P<0.007). Finally, the pleC mRNA was still among the top target candidates (P<0.0001) when members of the Xanthobacteriaceae, Beijerinckiaceaceae, and Hyphomicrobiaceae were analyzed.
The GC-rich conserved region within SL1 of EcpR1 was predicted to base pair with all cell cycle-related target mRNA candidates (Fig 1A, S1B Fig). The interacting sequences predicted by CopraRNA were found in different positions of the S. meliloti mRNAs: for gcrA, a 13 nt stretch from position -109 to -95 relative to the start codon (S9D Fig); for ctrA, a 8 nt sequence from position -21 to -12 located close to the RBS; and for pleC and minD, discontinuous base-pairing over a 13 nt stretch overlapping the start codon and the minC-minD intergenic region, respectively (S7A–S7C Fig). The putative binding sites in the dnaA (S1C Fig; BS5) and ftsZ mRNAs (S7D Fig) map to positions about 60 to 70 nt downstream of the start codon. Additionally, the mRNA sequences ranging from the mapped S. meliloti transcriptional start site (TSS) [22] to 100 nt downstream of the annotated start codon were scanned for further sequences that may interact with EcpR1 applying IntaRNA [35]. This approach suggested three additional putative EcpR1 binding sites in the dnaA mRNA with E <-10 kcal/mol (S1C Fig): two at positions -140 and -70 relative to the AUG (BS1 and BS2), and a sequence overlapping the start codon region (BS3). The RNAup webserver [36] also identified these putative EcpR1 binding sites together with a sequence overlapping the RBS (BS4) (S1C Fig).
ecpR1 is expressed upon entry into stationary phase and under stress conditions
Microarray-based transcriptome profiling detected EcpR1 upon heat, cold, acidic, alkaline, salt, and oxidative stresses [21,37]. In the S. meliloti Rm2011 wild type, Northern blots revealed a dominant ~100 nt EcpR1 transcript and two less abundant larger variants corresponding to the prevalent 101 nt species, a 142 nt transcript, and the full length 171 nt variant deduced from the RNAseq data (Fig 1A and 1C; S1A Fig). In TY rich medium EcpR1 was barely detected in exponentially growing bacteria (OD600 of 0.2 to 0.9), and levels increased during early and late stationary phases (OD600 of 1.2 to 2.8) (Fig 1C, S2A Fig). The amount of EcpR1 also increased after shifting exponential phase cultures for one hour to 40°C, 20°C, or microoxic conditions, and after adding salt or hydrogen peroxide (~1.5 to 2 fold induction) (Fig 1C). qRT-PCR quantification of EcpR1 transcripts including the sequence region of the 101 nt variant even suggested higher induction levels (up to ~5-fold upon temperature upshift) (Fig 1C). EcpR1 levels also increased when exponential phase cells growing in MOPS minimal medium were shifted to carbon or nitrogen depleted medium for one hour (~3.5-fold induction) (Fig 1C). Higher induction rates were observed in MOPS and nutrient-limited MOPS (MOPSlim) stationary phase cultures (up to ~8.5-fold, Fig 1C). Under these conditions, the stationary phase was reached at OD600 of 8.5 and 2.5, respectively. EcpR1 was not detected in total RNA isolated from 28 days old mature symbiotic nodules of Medicago sativa (S2B Fig).
RNAseq identified two distinct 5’-ends of the ecpR1 mRNA varying by 29 nt [22] (Fig 1A). Although these 5’-ends were associated to σ70 - (ATTGAT-N17-CAATGC) (Fig 1B) and σ54-type (AGGAAGG-AAAC-TTCCA) promoter motifs (S2C Fig), the alternative 5’2-end may either be generated by the activity of the putative σ54-dependent promoter or by post-transcriptional processing of the EcpR1 primary transcript. To determine promoter activities associated with ecpR1, different DNA fragments from the ecpR1 upstream region including up to 12 nt downstream of the TSS were fused to egfp in a replicative low copy plasmid (Fig 1B). Matching the results from the Northern hybridizations and qRT-PCR, the pPecpR1_5’2 construct showed very low activities, just surpassing background fluorescence in the exponential growth phase of Rm2011 cultures in TY rich medium, while in stationary phase activities strongly increased (S2D Fig). Microscopy of Rm2011 single cells carrying pPecpR1_5’2 showed that overall fluorescence homogeneously increased in stationary phase (S2E Fig), further confirming the growth phase-dependent pattern of ecpR1 expression. All constructs including the σ70 promoter motif (pPecpR1_5’1, pPecpR1_5’2, and pPecpR1_5’1–204) showed similar activities in stationary phase (Fig 1B). Mutations in the -10 region of the σ70-type promoter abolished fluorescence activity of the reporter plasmid pPecpR1_5’2-Pσ70 (Fig 1B) and EcpR1 was not detected by Northern hybridizations in stationary growing and oxygen depleted 2011Pσ70ecpR1 bacteria carrying these promoter mutations in the genome (S2F Fig). Furthermore, in stationary cultures an rpoN mutation did not reduce the reporter gene activity mediated by the pPecpR1_5’2 construct including both putative promoters (Fig 1B). This suggests that the predicted σ54-type promoter is non-functional under the conditions tested and implies that the prominent 5’-end of EcpR1 was probably generated by ribonucleolytic activity. ecpR1 was not required for stimulation of ecpR1 promoter activity in the stationary phase excluding a positive feedback involving the EcpR1 sRNA (Fig 1B). In trans overproduction of PleD or DivK, encoded upstream of ecpR1 (Fig 1A), did not affect activity of any of the reporter gene constructs (S2G Fig).
Since the predicted promoter motifs provide no hints to extracytoplasmic function sigma factors being involved in stress-induced stimulation of ecpR1 expression, we assayed the role of the stringent response alarmone ppGpp in regulation of ecpR1. Previously reported transcriptome data of cultures shifted to nitrogen or carbon starvation indicated a 20-fold and 4-fold increase in EcpR1 levels in the wild type and relA mutant, respectively [38]. Compared to the wild type, stimulation of ecpR1 expression was reduced more than two-fold in a relA mutant that is unable to synthesize ppGpp and was fully restored by ectopic relA expression driven by the basal activity of the non-induced lac promoter [38] (Fig 1B). This result is in agreement with comparable levels of EcpR1 in the relA mutant under nutrient-sufficient and nitrogen - or carbon-limiting conditions as inferred from Northern hybridizations (Fig 1C) suggesting that EcpR1 is part of the stringent response regulon in S. meliloti.
Overexpression of ecpR1 leads to cell cycle defects in several related α-proteobacteria
To study the biological function of EcpR1, growth and morphology phenotypes were monitored in S. meliloti either overexpressing ecpR1 or lacking a functional copy of this sRNA gene.
IPTG-induced overexpression of ecpR1 was mediated by construct pSKEcpR1+ in strain Rm4011 carrying mutations that prevent background activity of the applied inducible expression system (see materials and methods). Northern hybridizations verified IPTG-driven overexpression of ecpR1 from plasmid pSKEcpR1+. Due to the overall stronger signals, the three less abundant EcpR1 variants matching the RNAseq data [21] were clearly detected in addition to the dominant 101 nt EcpR1 transcript (Figs 1A and 2A; S1A Fig, S2A Fig). IPTG-driven overexpression of the SmelC812 RNA gene from plasmid pSKControl+ served as control in all ecpR1 overexpression assays because it did not affect the overall integrity of the cell, as growth phenotype and transcriptome profiles did not significantly deviate from the wild type properties. SmelC812, an antisense RNA of insertion sequence ISRm19, was postulated to prevent translation of its associated TRm19 transposase mRNA [21].

Induced overexpression of ecpR1 led to abnormal cell elongation (Fig 2B). The mean cell length progressively increased after exposure to IPTG (Fig 2D). 30 hours post-induction 90% of the ecpR1 overexpressing cells were abnormally long and 3% of the population additionally showed a branched morphology (sampling of 1000 cells). Similar abnormal cell morphologies have previously been reported in response to a variety of cell cycle perturbations that inhibit or overstimulate either DNA replication or cell division [32,34,39–41]. ecpR1 overexpressing cells showed a ~2-fold decrease in generation time (~4 hours) compared to those overproducing the control sRNA (~2 hours), measured as the average time between two cell divisions monitored by time-lapse microscopy on TY rich medium (S3A Fig). Time-lapse microscopy also showed that after 30 hours of growth in presence of IPTG 38% of the elongated cells (n = 500) were not able to proceed to cell division and to resume growth after transfer to fresh medium lacking the inductor, compared to 4% of equally treated pSKControl+ cells (S3B Fig). Furthermore, after three cycles of regrowing EcpR1 overproducing cultures on TY rich medium supplemented with IPTG, a 64% decrease in viable cells was observed (S3C Fig). Cells overproducing EcpR1 spread to a smaller halo (diameter 8 ± 2 mm) than the control (16 ± 1 mm) on soft agar (Fig 2C), but were still motile compared to a visN mutant incapable of swimming [42]. Finally, we checked alterations of the DNA content by fluorescence-activated cell sorting (FACS) analysis. 4 hours post-induction, cells with two genome copies started to accumulate in comparison to the control, and after 20 hours the majority of cells contained 2 or more genome equivalents (Fig 2E), further suggesting perturbations of the cell cycle.
Because homologs of EcpR1 and cell cycle-related target candidates were also found in other members of the Rhizobiales, we asked whether overproduction of S. meliloti EcpR1 also leads to cell cycle defects in related species. This phenotype was conserved in the genera Sinorhizobium and Rhizobium, as IPTG-induced overexpression of ecpR1 in S. medicae, S. fredii, R. tropicii, and R. radiobacter carrying plasmid pSKEcpR1+ led to a similar proportion of elongated and branched cells as observed in S. meliloti (S4A Fig). In R. etli and A. tumefaciens, cell cycle associated defects were less abundant but FACS analysis confirmed an increased proportion of cells with more than two genome copies (S4B Fig).
Deletion of ecpR1 attenuates competitiveness
The markerless 2011ecpR1 mutant, missing the sequence of the full length 171 nt ecpR1 variant, did not show distinct phenotypes in that it grew similarly to the wild type, even under the stress conditions which stimulated ecpR1 expression (S5A–S5D Fig). After growth in rich medium or defined nutrient-limited minimal media until late stationary phase or after application of stress conditions growth recovery and cell viability (CFU/ml) were also not significantly affected compared to the wild type. Furthermore, the ecpR1 deletion mutant was not impaired in symbiosis with its host plant M. sativa (S5E–S5H Fig).
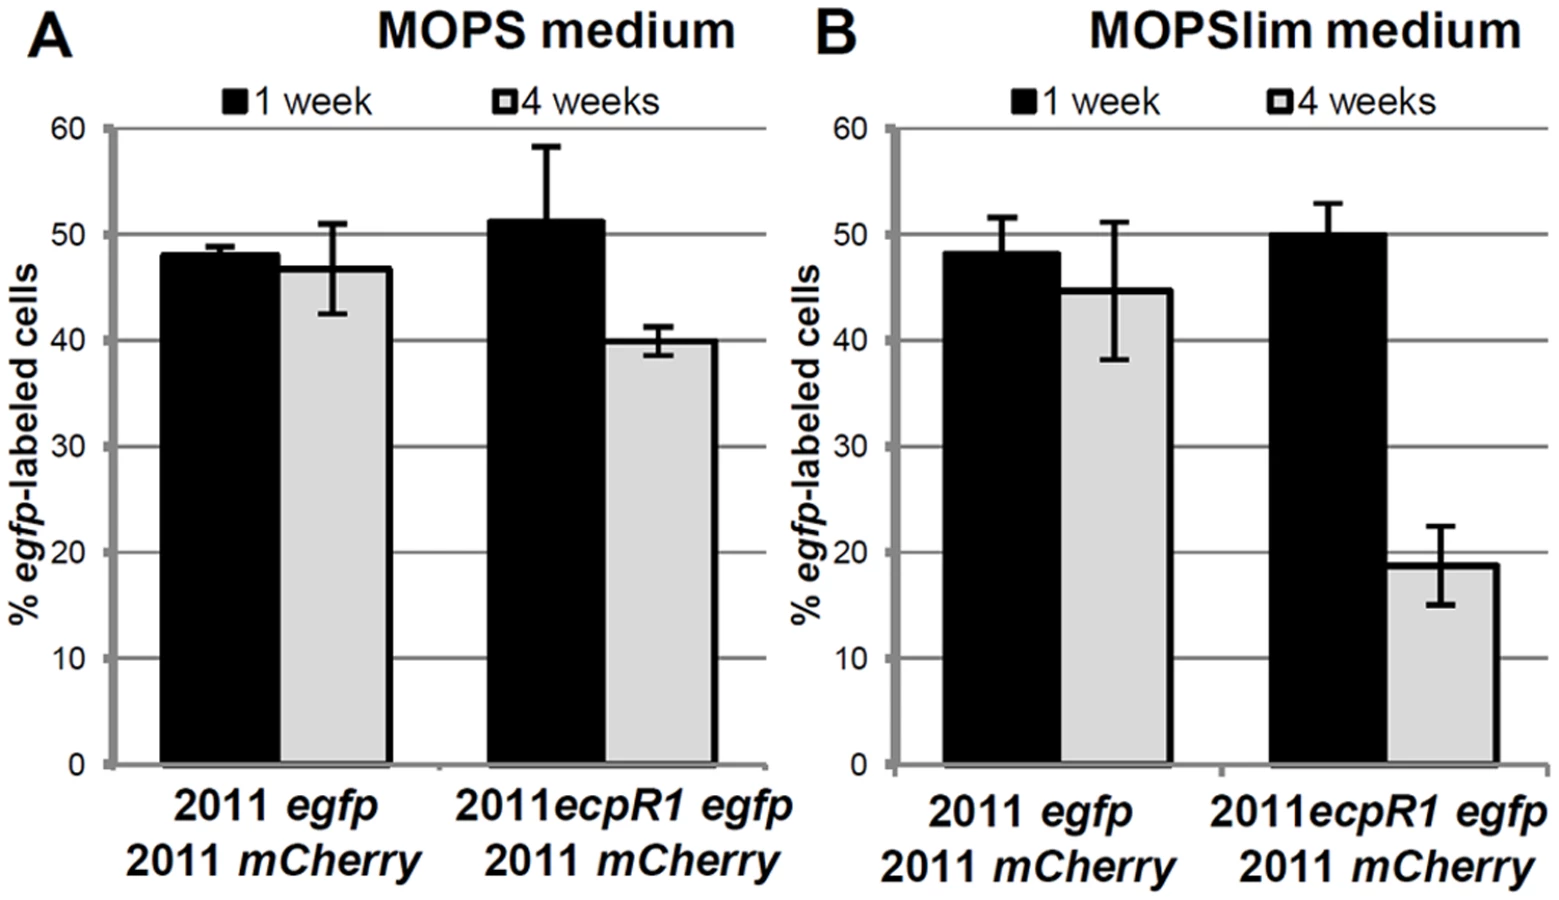
The strong conservation and microsynteny suggests an evolutionary advantage conferred by the ecpR1 locus. To support this hypothesis we determined whether the Rm2011 wild type has a fitness advantage over the ecpR1 mutant. For this competitive growth assay, strains were labeled by a stable genomic integration of plasmids carrying either egfp or mcherry driven by a constitutive promoter. MOPS or Nutrient-limiting MOPS (MOPSlim) minimal media were inoculated with 2011 mCherry cells and either 2011 egfp or 2011ecpR1 egfp cells in a ratio of 1 : 1. eGFP:mCherry fluorescence ratios of the mixed cultures were measured and microscopy images were taken to determine the percentage of egfp-labeled bacteria (Fig 3, S6 Fig). After 7 days of cultivation, the 1 : 1 ratio was maintained indicating that all strains grew similarly, as we have previously observed when single-strain liquid cultures were grown in these conditions (S5 Fig). However, after the 7 days-old mixed cultures were diluted in fresh media, the proportion of the 2011ecpR1 egfp strain progressively decreased in the MOPSlim medium (S6C and S6D Fig). The mixture of 2011egfp and 2011mCherry cultures further on maintained the ~1 : 1 ratio, confirming that the fluorescence markers are neutral in the conditions tested (Fig 3). After three consecutive sub-cultivations, the ecpR1 mutant only reached ~40% and ~20% of the population in MOPS and MOPSlim media, respectively (Fig 3). This implies a disadvantage of the ecpR1 deletion mutant in recovery from late stationary cultures as compared to the wild type, particularly under nutrient limitation.
ecpR1 overexpression or deletion alters expression of genes related to cell cycle regulation
To obtain further clues to putative target genes of EcpR1 the cellular responses of the S. meliloti EcpR1 overproducing strain and the ecpR1 deletion mutant (2011ecpR1) were characterized by microarray-based transcriptome profiling.
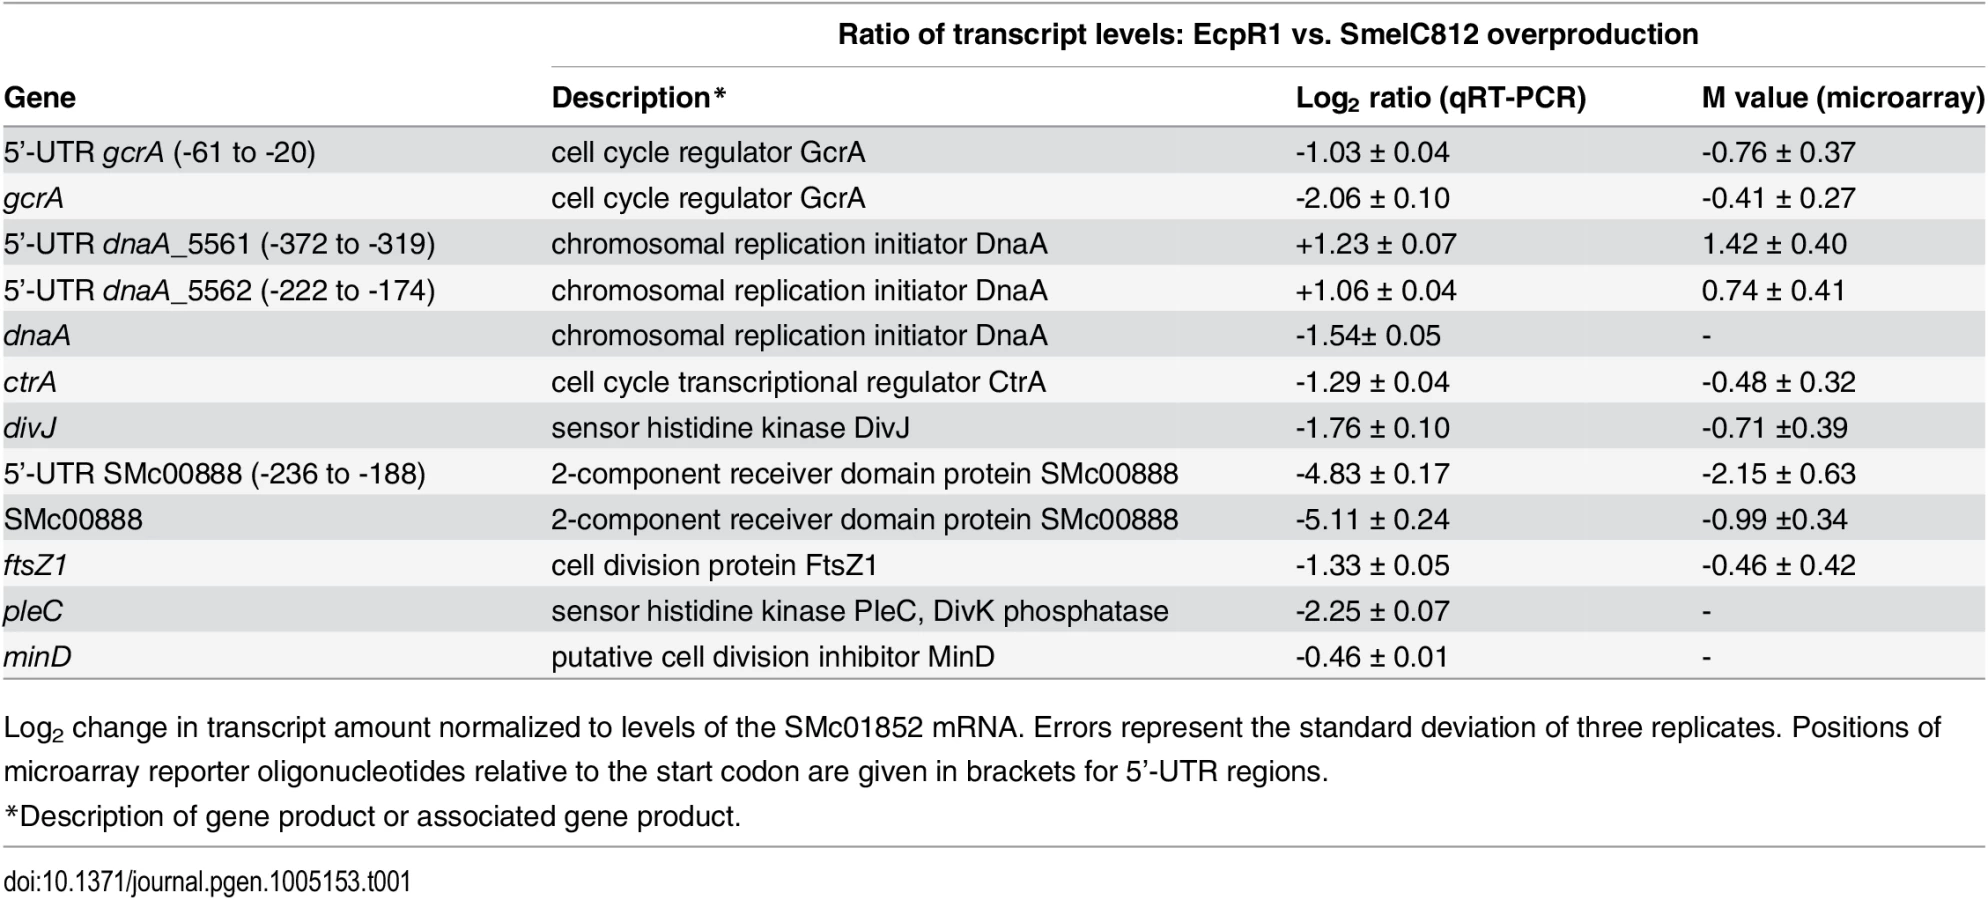
Differential gene expression upon EcpR1 overproduction: Genes displaying differential expression 15 minutes, 1 hour, and 4 hours post-induction of ecpR1 overexpression in TY medium are listed in S2–S6 Tables. Only reporter oligonucleotides associated to the open reading frame or UTRs of 6 (15 minutes post-induction) and 20 (1 hour post-induction) protein-coding genes indicated transcript levels at least 1.6-fold lower than in the control. No genes were found to be upregulated after 15 minutes (except for ecpR1 that was overexpressed) whereas RNA levels associated to 35 coding regions or UTRs including a number of ribosomal genes were upregulated after 1 hour. 4 hours post-induction, which corresponds to completion of one cell cycle in EcpR1 overproducing cells, transcript levels of 77 protein-coding genes were found to be changed (25 increased and 51 decreased). Several downregulated genes were related to cell cycle regulation and motility, which is in accordance with the observed phenotypes (Fig 2B–2E). Among these were divJ as well as the SMc00887-SMc00888 operon of unknown function that shares similarities with the pleD-divK operon located upstream of the ecpR1 gene (Table 1). Previously, a decrease in SMc00887 and SMc00888 transcript levels was also found to be caused by mutation of podJ encoding a polarity factor [43]. The putative cell cycle-related SMc00888 gene was among the predicted EcpR1 targets (Table 1, position 22). Our transcriptome study also indicated lower representation of the gcrA 5’-UTR and increased levels of the long putative dnaA 5’-UTR region upstream of the predicted EcpR1 binding sites (Table 1 and Fig 4, vertical arrows), both among the top three ranked candidates of the computational EcpR1 target predictions (S1 Table). Most of the genes strongly differentially expressed upon EcpR1 overproduction are related to metabolism. We also found reduced levels of the 5’-UTR sequence of the ribonuclease gene rne 1 hour (M = -0.77) and 4 hours (M = -1.78) after ecpR1 overexpression. Moreover, the 5’-UTR sequence of xerC (M = +2.40), probably involved in chromosome segregation, and mepA (M = +1.15) encoding a homolog of peptidoglycan hydrolases, stood out among the upregulated transcripts 4 hours post-induction. qRT-PCR confirmed the observed changes in transcript levels of dnaA, gcrA, divJ, and SMc00888 in response to EcpR1 overproduction. Although not detected as differentially expressed in the microarray hybridizations, qRT-PCR showed reduced levels of the ctrA, ftsZ1, pleC, and minD transcripts in EcpR1 overproducing cells (Table 1).

Differential gene expression in the ecpR1 deletion mutant compared to the wild type: The transcriptomes of Rm2011 and Rm2011ecpR1 cells were compared during stationary growth in MOPS and MOPSlim media (S7–S10 Tables) since ecpR1 expression is stimulated in the wild type under these conditions (Fig 1C, right panel). Reporter oligonucleotides associated to the open reading frame or UTRs of 18 (MOPS medium) and 17 (MOPSlims medium) protein-coding genes indicated transcript levels at least 1.6-fold lower than in the wild type control. Among them were reporters for the dnaA 5’-UTR region (positions -158 to -121 in MOPS and -222 to -174 in MOPSlim media), and mepA, both upregulated 4 hours after ecpR1 overexpression.
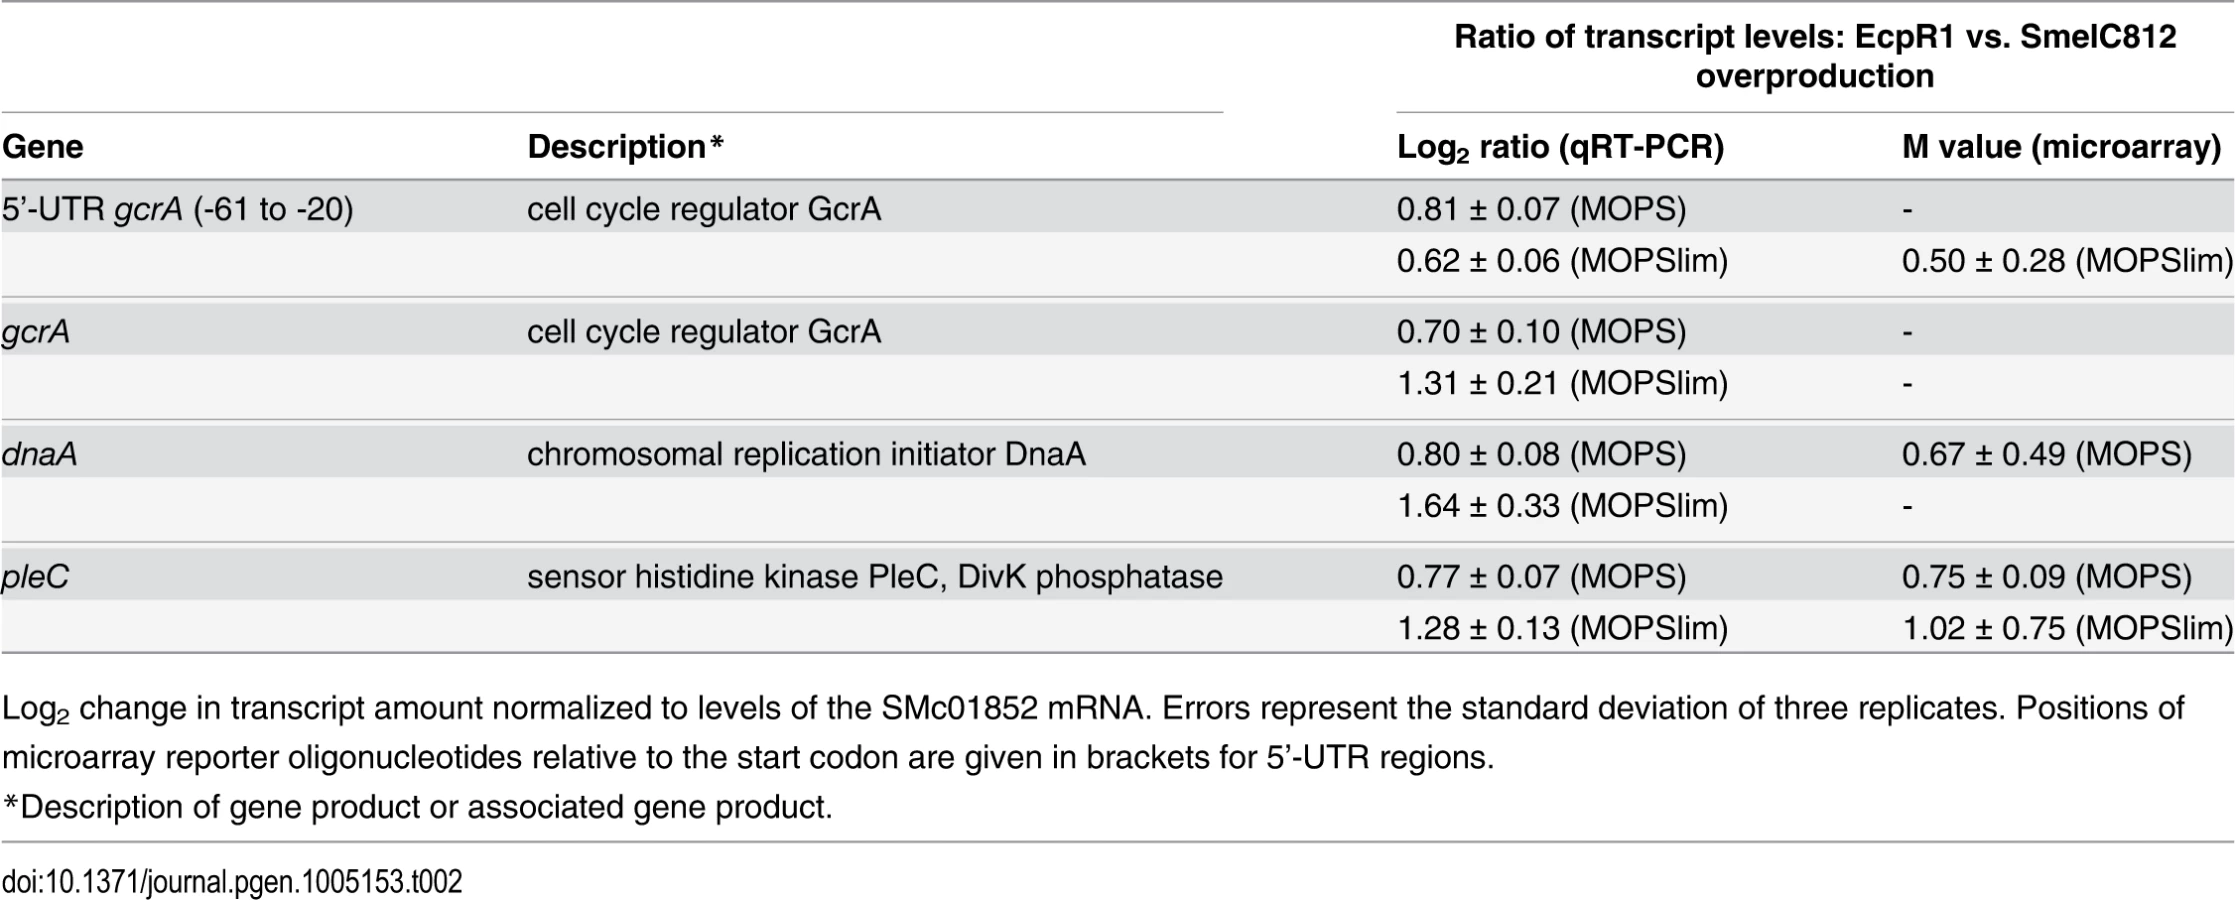
In contrast, transcript levels of 27 (MOPS medium) and 44 (MOPSlims medium) protein-coding genes were found to be upregulated. Under both conditions pleC, ranking in the 5th position of the computationally predicted EcpR1 targets (S1 Table), displayed significantly higher transcript levels and was downregulated in EcpR1 overproducing cells (Table 1). Although gcrA, dnaA, and pleC microarray reporter signals did not pass all criteria set for the identification of differentially expressed genes, qRT-PCR indicated higher transcript levels of these genes in 2011ecpR1 compared to the wild type (Table 2). This is in agreement with downregulation of these cell cycle-related genes upon ecpR1 overexpression (Table 1).
In MOPSlim medium, several upregulated genes were related to cell division and cell wall degradation. Among those involved in cell division we found the mraZ-mraW genes (M = +1.30; +1.34) forming an operon with ftsI. The first gene of the dll-ftsQ-ftsA operon upstream of ftsZ (dll; M = +1.16) and mltB2 (M = +1.18), both encoding homologs of peptidoglycan hydrolases, also appeared among the upregulated genes. Interestingly, several differentially expressed genes in the 2011ecpR1 mutant harbour CtrA binding sites upstream the coding region, like pleC, mraZ, mltB2, and the genes coding for the PilZ-like protein SMc00999, the adenosylhomocystein hydrolase SMc02755, the putative transcriptional regulator SMc01842 and the hypothetical protein SMc03149. Beside this, in both media most of the differentially expressed genes with known functions were also related to metabolism. Among the strongly upregulated genes were the SMb20155-8 operon encoding the components of an ABC transporter (M = +2.57 to +3.22) and SMc03253 coding for an l-proline hydroxylase (M = +2.31). The latter was downregulated 15 min and 1 hour after induction of EcpR1 overproduction (M = -2.98 and -0.84, respectively).
However, looking for an overlap between the top target mRNA predictions (P<0.005) (S1 Table) and genes differentially expressed in the ecpR1 overexpression or deletion strain (S2–S10 Tables) only genes related to cell cycle were identified.
EcpR1 post-transcriptionally represses the cell cycle master regulatory genes gcrA and dnaA
For experimental investigations, we restricted the set of EcpR1 target candidates to genes that fulfilled the following two criteria: (i) prediction by CopraRNA in the Rhizobiaceae with P<0.005 and (ii) decrease in transcript abundance upon ecpR1 overexpression. These included gcrA, dnaA, pleC, ftsZ, ctrA, minD, and SMc00888. To this set we added divK, situated in the vicinity of the ecpR1 locus (Fig 1A), and divJ. The corresponding mRNA sequences contain putative thermodynamically favored antisense interactions regions (S8 Fig).
To validate target mRNA candidates of EcpR1 in vivo, a double plasmid reporter assay was employed [44]. Target fragments comprising the native 5’-UTR [22] extended by the start codon or by a short 5’-part of the coding region were translationally fused to egfp in plasmid pR_EGFP and placed under the control of the constitutive synthetic PSyn promoter [45]. All selected fragments contained the predicted EcpR1 interaction sequences. These plasmids were applied as reporter constructs to determine the post-transcriptional effect of induced EcpR1 overproduction on target mRNAs, while overexpression of the antisense RNA gene SmelC812 was used as control. This approach revealed EcpR1-induced down-regulation of reporter constructs corresponding to the top ranked predicted targets gcrA and dnaA (P<0.0001, Fig 4) but did not confirm the predicted regulatory effect of EcpR1 on the other cell cycle related target candidates (S7 Fig and S8 Fig). Since fluorescence mediated by the pSMc00888-235+57-egfp reporter construct did not exceed the background level derived from the empty vector, we were unable to test this gene for EcpR1-induced regulation.
The EcpR1 binding region within the gcrA mRNA is located 13 nt downstream the TSS (position -122 relative to the AUG) (Fig 4A). The regulatory effect of EcpR1 on gcrA was assessed applying two different reporter constructs comprising the complete 5’-UTR fused to egfp either under the control of the constitutive PSyn (plasmid pgcrA-122+3- egfp) or the native gcrA promoter (plasmid pPgcrA-122+3-egfp) (Fig 4A). Compared to the control, induced overexpression of ecpR1 reduced pgcrA-122+3-egfp and pPgcrA-122+3-egfp mediated fluorescence to 34% and 42%, respectively (Fig 4A). Furthermore, activity of a chromosomally integrated gcrA 3’-egfp translational fusion [46] was reduced to 75% in response to ecpR1 overexpression, validating the two-plasmid assay and confirming that posttranscriptional repression of EcpR1 results in reduction of GcrA protein level.
Five putative EcpR1 binding sites were identified within the dnaA mRNA (S1C Fig). Since different alternative ATG start codons have been assigned to dnaA in various rhizobial genomes, we affirmed the annotated ATG as translational start of dnaA in the Rm1021 genome [47]. None of the alternative start codons were functional when translationally fused to egfp. To test the post-transcriptional effect of EcpR1 overproduction on dnaA expression various fragments including all predicted binding sites or different subsets were translationally fused to egfp under the control of the constitutive PSyn promoter (Fig 4B). Compared to the control, EcpR1 overproduction resulted in decreased activity of all reporter constructs, even when the shortest fragment was tested that only included the putative binding sites 3 and 4, overlapping the RBS and the start codon (Fig 4B).
A conserved GC-rich loop motif is essential for the regulatory function of EcpR1
Typically, sRNA sequences involved in mRNA base pairing are highly conserved, especially when binding multiple targets [48]. EcpR1 is predicted to fold into a secondary structure consisting of two hairpins (Fig 1A, S1A Fig): the 5’ SL1 domain has a structurally conserved stem loop and a strongly conserved GC-rich loop motif (UCCGCCGCAUCU), which is predicted to be unpaired, while the SL2 domain includes a highly variable stem and a loop that contains the less conserved motif UCCUCG [27]. The predicted interaction region of EcpR1 mapped to the strongly conserved loop motif of SL1 which is part of the prevalent processed 101 nt transcript (Fig 1A, S1A Fig). Overproduction of an EcpR1 version starting from its second 5’-end (EcpR15’2) caused accumulation of this 101 nt core variant and the 142 nt version including the transcription termination sequence, and resulted in cell elongation (S9A and S9C Fig). This indicates that the 29 nt 5’-sequence of the full-length version is not required for provoking this phenotype.
Furthermore, overexpression of ecpR1-2, a full-length mutant variant carrying changes in 2 nt in the first loop sequence SL1, did not cause the alterations in cell morphology and DNA content previously observed upon overproduction of EcpR1 (Figs 2B–2D and 5A–5E). As EcpR1-2 conserved the predicted secondary structure of EcpR1 and Northern hybridizations confirmed the same level of overproduction of the mutant and the wild type variant (Fig 2A), we exclude that instability of the mutant RNA was responsible for the regulatory deficiency of EcpR1-2. This implies that the GC-rich loop motif is responsible for the cell cycle progression defects observed upon ecpR1 overexpression. The single substitution G23 to C23 in EcpR1 (EcpR1-1) was not sufficient to destroy the regulatory activity of this sRNA (S9D Fig).

Moreover, overexpression of ecpR1-2 did not post-transcriptionally repress gcrA and dnaA in the same strain background and culture conditions previously applied for EcpR1 (Fig 5E). Concordantly, 2 nt changes in the predicted target region within the gcrA 5’-UTR of the reporter fusion construct pPgcrA-122+3-egfp, leading to construct pPgcrA-122+3-BS-egfp, abolished fluorescence diminution caused by EcpR1 overproduction (Fig 5C and 5E). Introduction of 3 to 5 nt changes into the predicted binding sites 3, 4, or 5 within the dnaA mRNA only slightly mitigated the ecpR1 overexpression-induced repression of reporter construct activities (Fig 5F). In the reporter constructs, substitutions in binding sites 3 and 4 (S1C Fig) were designed to avoid severe effects on translation of the mRNA because these binding sites overlapped the RBS and the start codon. Combined mutations of binding sites 3 and 4 abolished the negative regulatory effect of EcpR1 overproduction on the reporter construct activity (Fig 5F). This implies that the predicted interaction sites 1, 2 and 5 are not required for EcpR1-mediated repression of dnaA under the conditions tested.
Combination of the changes in the EcpR1 binding sites within the gcrA or dnaA 5’-UTRs and EcpR1-2 carrying the compensatory changes in the proposed interaction region partially restored the regulatory function of EcpR1-2. This further confirms the identified interaction regions in sRNA and mRNA (Fig 5B–5E). However, changing CCG to AAT in loop 1 of EcpR1 (EcpR1-3) destroyed its regulatory activity as expected, but the compensatory changes of GGC to TTA in the gcrA 5’-UTR did not restore it (S9F Fig). Northern blots showed that levels of EcpR1-3+ and EcpR1+ are similar (S9A Fig). Lack of restored regulation by compensatory mutations has already been reported for other sRNA-mRNA pairs [49–52] implying that both sequence and structure of the two RNAs are important for their interactions. The changes introduced affect not only the E score of the interaction, which dropped from -19.1 to -14.1, but also the nature of EcpR1 pairing at this position, which probably constitutes the sRNA seed region. This suggests that the binding strength mediated by the GC-rich sequence composition is important for the sRNA-mRNA interaction. Altogether, these data validate gcrA and dnaA as targets of EcpR1 and strongly suggests that this regulation is mediated through base pairing of the conserved GC-rich, single stranded region of EcpR1 with complementary GC-rich sequences of the target mRNAs.
EcpR1 function is Hfq-independent and requires RNase E to fully regulate dnaA
To further characterize the functional mechanism of EcpR1-dependent post-transcriptional regulation we tested the involvement of the RNA chaperone Hfq and the ribonuclease RNase E in this regulatory mechanism. Hfq is an RNA binding protein that canonically facilitates direct interaction of sRNAs and their mRNA targets and protects them from degradation in the absence of base pairing [53,54]. However, co-immunoprecipitation with epitope-tagged Hfq only detected 14% of the S. meliloti trans-sRNAs, excluding EcpR1, in cells grown under different stress conditions [55]. Accordingly, absence of Hfq did not compromise EcpR1 stability even 45 min after transcriptional arrest with rifampicin (Rf) as suggested by detection of similar levels of EcpR1 by Northern quantification in the Rm2011 wild type strain and the 2011hfq mutant (Fig 6A). In S. meliloti, knockout of hfq compromises growth, metabolism, motility, and stress adaptation in free-living bacteria [56,57]. In our study, microscopy analyses further showed abnormalities in cell morphology with some cells being filamentous and branched. Nevertheless, overexpression of ecpR1 in 2011hfq caused cell elongation that was more severe than in the control (Fig 6B), suggesting that binding to Hfq is not required for EcpR1-mediated regulation of target mRNAs.

sRNAs associate with the C-terminal scaffold region of RNase E and other ribonucleases forming the so-called degradosome, which is recruited through base-pairing to the target mRNA to mediate its cleavage [58]. While the N-terminal catalytic domain of E. coli RNase E is essential for growth, the C-terminal region is dispensable and its deletion allows for testing the requirement of RNase E in sRNA-induced target mRNA degradation [58]. In S. meliloti, the C-terminal domain of RNase E is also non-essential, as either a mini-Tn5 transposon insertion or a plasmid integration into codon 675 of rne led to viable cells, though moderately impaired in growth [59]. The 2011rne::Tn5 mutant showed wild type morphology and displayed an elongated phenotype upon overexpression of ecpR1 (Fig 6B). The same observation was made when comparing EcpR1 overproduction in strain 4011ecpR1 versus 4011ecpR1 rne675. To further investigate whether this endoribonuclease is involved in EcpR1-mediated post-transcriptional regulation, the full-length reporter constructs pPgcrA122+3-egfp and pdnaA154+162-egfp were introduced to 4011ecpR1 rne675 containing a plasmid either driving overproduction of EcpR1 or the control RNA SmelC812. A ~20% decrease in gcrA and dnaA reporter construct-mediated fluorescence was observed in Rm4011 ecpR1 rne675 overexpressing ecpR1 as compared to overproduction of SmelC812. In the 4011ecpR1 strain carrying the complete rne gene the difference caused by EcpR1 overproduction was more pronounced for the dnaA reporter construct that showed a 39% lower reporter activity (Fig 6C). EcpR1-dependent decay of gcrA and dnaA mRNAs upon transcriptional arrest was assessed in 4011ecpR1 either overexpressing ecpR1 or the control RNA. Whereas decay of the dnaA mRNA was ~5-fold higher in the EcpR1 overproducing strain compared to the control strain after transcription inhibition, only a slight ~1.25-fold decrease in gcrA transcript levels was observed (Fig 6D). In summary, these data suggest that dnaA mRNA-EcpR1 interaction promotes RNase E-dependent mRNA degradation whereas EcpR1-mediated negative post-transcriptional regulation of gcrA is mostly independent of mRNA degradation and more likely due to translation inhibition of gcrA.
Altered morphology caused by depletion of GcrA matches the elongated cell phenotype observed after EcpR1 overproduction
Recently, methylation-dependent binding of specific DNA motifs by orthologous GcrA proteins has been reported in several α-proteobacteria including S. meliloti, suggesting that this transcription regulator is functionally conserved in these bacteria [60]. Attempts to interrupt the S. meliloti 2011 gcrA coding region at the 98th codon by plasmid integration failed to produce any colonies. To further investigate the role of gcrA, a deletion mutant was constructed in presence of a plasmid allowing for IPTG-induced expression of an ectopic copy of gcrA (2011gcrA-PlacgcrA) since we also failed to obtain a S. meliloti gcrA deletion mutant. Strain 2011gcrA-PlacgcrA was unable to divide in the absence of IPTG, suggesting that gcrA may be essential in S. meliloti.
To study the GcrA depletion phenotype, two independent clones of 2011gcrA-PlacgcrA were grown in TY rich medium supplemented with 0.5 mM IPTG until early logarithmic phase. Cells were washed and subsequently cultured with different IPTG concentrations leading to lower gcrA transcript levels compared to the wild type (Fig 7A). Wild type-like growth was restored at ≥0.2 mM IPTG while lower concentrations hampered growth and cell viability (Fig 7A and 7B). The majority of 2011gcrA-PlacgcrA cells grown with ≥0.2 mM IPTG displayed wild type-like morphology and harboured one or two genome equivalents. However, bacteria grown with 0.1 mM IPTG became elongated and the DNA content of the cells increased (Fig 7B and 7C). In contrast to the linear filamentous growth of a C. crescentus temperature sensitive gcrA mutant [60], 2011gcrA-PlacgcrA cells cultured with ≤0.05 mM IPTG showed a tree-shaped morphology characterized by multiple branches (Fig 7C). Interestingly, the decrease in gcrA transcript level and the linear filamentous cell morphology observed in the mid-range of the tested IPTG concentrations resembled the phenotypic effects of induced EcpR1 overproduction.

Discussion
Microorganisms are often facing detrimental conditions unfavorable for cell proliferation such as biotic and abiotic stress factors or nutrient limitation. Therefore regulatory mechanisms adjusting replication initiation and cell cycle progression in response to environmental conditions are crucial for survival. Bacteria have evolved diverse mechanisms to couple perception of stress conditions to a cellular response that triggers a slow down or arrest of cell cycle progression [10]. The most prominent regulatory route for cell cycle control in response to nutrient deprivation involves the stringent response common to diverse bacteria. The stringent response second messenger ppGpp was shown to cause a G1 arrest in E. coli, C. crescentus, and Bacillus subtilis by modulating abundance or activity of proteins involved in DNA replication, such as DnaA or the primase DnaG. However, the underlying mechanisms are largely unknown. Recently, accumulation of unfolded proteins upon abiotic stress was reported to induce targeted degradation of DnaA resulting in cell cycle arrest in C. crescentus [61]. Inhibition of cell division mediated by the SOS response was observed in response to DNA damage gaining time for repair. Targeting of divisome components has been shown to be inherent to this DNA damage response in E. coli and C. crescentus.
In this study, we add trans-sRNA mediated regulation as another layer contributing to these diverse mechanisms linking stress factor sensing to the cell cycle engine. To the best of our knowledge, EcpR1 constitutes the first example of a trans-sRNA directly post-transcriptionally modulating expression of two cell cycle related genes in prokaryotes. Despite the effort invested in the model organism C. crescentus to identify sRNAs exhibiting cell cycle-dependent expression profiles [19], the connection between them and the cell cycle engine remained unproven.
To date, two antisense RNAs related to bacterial cell cycle genes have been identified: the defective prophage-encoded DicF RNA in E. coli, and asDnaA in Salmonella enterica. DicF inhibits translation of the cell-division protein FtsZ when overexpressed [62], while asdnaA is expressed in stationary phase and under other stress conditions and seems to increase stability of the dnaA mRNA by an unknown mechanism [63]. A few sRNAs have been reported to be involved in bacterial cell differentiation processes that may include modulation of cell cycle control. trans-sRNA Pxr negatively regulates fruiting body formation in Myxococcus [64]. In Chlamydia, the conserved IhtA sRNA translationally inhibits the histone-like protein Hc1 that is involved in compaction of the chromatin into metabolically inert forms during host infection [65,66]. In E. coli, the plasmid-encoded Rcd RNA indirectly regulates cell growth to ensure plasmid maintenance by binding to a protein involved in indole metabolism [67].
Quick responses to suddenly arising adverse conditions provide an adaptive advantage to the cell. Riboregulators have the potential to act faster as regulatory proteins since RNA is the first product of gene expression. The most prevalent mechanisms of trans-sRNA mediated riboregulation affect mRNA translation and stability, which also are most likely the modes of action of EcpR1 on the gcrA and dnaA target mRNAs in the α-proteobacterium S. meliloti. We speculate that affecting synthesis of cell cycle master regulators at this post-transcriptional level is an advantageous complementary mechanism to stress-stimulated proteolysis as reported for DnaA in the distantly related α-proteobacterium C. crescentus [61].
Most sRNAs are conserved only among closely related species, but EcpR1 shows a broad distribution within the Rhizobiales, including organisms with different lifestyles, such as pathogens (e.g. Agrobacterium) and diazotrophic plant endosymbionts. EcpR1 overproduction-induced perturbations of cell cycle progression in several species harboring members of the SmelC291 (EcpR1) RNA family also imply functional conservation of this sRNA. However, deletion of ecpR1 did not cause significant differences in cell growth or viability, but attenuated competitiveness with the wild type. Since sRNAs primarily act to fine-tune stress responses that commonly rely on redundant bacterial pathways [8] sRNA mutants frequently do not show significant phenotypes under laboratory conditions.
The majority of the bacterial sRNAs characterized so far accumulate under stress conditions [68] as does EcpR1, suggesting that this sRNA likely constitutes an adaptive factor that contributes to prevent cell-cycle progression when cells must slow down proliferation. Tight control of EcpR1 levels are likely to be crucial since an excessive amount resulted in a considerable proportion of cells that were not able to resume growth after ecpR1 overexpression had been stopped. This is in agreement with a more moderate induction of EcpR1 production under stress conditions in the native situation. We obtained evidence that transcription of ecpR1 driven by an RpoD-type promoter is stimulated by ppGpp, placing EcpR1 in the stringent response regulon of S. meliloti. This finding is intriguing in light of the role of the stringent response in coupling nutrient status to cell cycle control.
Interestingly, the elongated phenotype of cells overexpressing ecpR1 resembles that of differentiated nitrogen fixing bacteroids inside plant root nodules and recently, it has been found that nodule-specific cysteine-rich (NCR) peptides triggering rhizobial genome endoreduplication perturbed expression of dnaA, gcrA, and ctrA [69]. In our study, EcpR1 was not detected in M. sativa mature root nodules implying that ecpR1 is not expressed in bacteroids. This is in agreement with a transcriptome study of individual zones of the root nodule which determined only low levels of EcpR1 in the symbiotic zone containing mature bacteroids and found the highest concentration of EcpR1 in the interzone where bacteroid differentiation occurs [70].
The confirmed target genes of EcpR1, dnaA and gcrA, encode key regulators of a complex regulatory circuit governing replication initiation and cell cycle progression. Despite subtle differences, the architecture of this regulatory circuit displays a high degree of similarity in S. meliloti and C. crescentus [25,26]. In C. crescentus, DnaA activates gcrA expression [13]. However, computational comparisons did not predict a significant DnaA binding motif in the promoter sequence of the S. meliloti gcrA gene, but upstream of divJ encoding a kinase/phosphatase involved in control of CtrA activity and upstream of SMc00888 encoding a DivK homolog [25,26]. GcrA controls expression of a multitude of target genes including ctrA. CtrA-binding motifs have been identified in the promoter regions of pleC, minD, SMc00888 and fts, and the fla genes [26]. In S. meliloti, transcriptome profiling and qRT-PCR assays suggest a direct or indirect effect of EcpR1 overproduction on a number of genes that are core components or known to be under control of this regulatory circuit, further supporting the modulating effect of EcpR1 in the regulatory context of cell cycle control. The enhanced levels of the dnaA 5’UTR caused by EcpR1 overproduction may be explained by mechanisms favoring accumulation of the 5’UTR (such as stabilization or attenuation) in conjunction with DnaA autoregulation as reported for E. coli [71] and feedback regulation increasing levels of DnaA in GcrA-depleted C. crescentus cells [72]. Such mechanisms may compensate for EcpR1-mediated negative post-transcriptional regulation of dnaA. Although significant, transcriptional changes of the cell cycle-related genes were rather low. In the non-synchronized cultures, this might have been due to heterogeneous expression of such genes dependent on the cell cycle state as has been described for gcrA in S. meliloti and other cell cycle-dependent genes whose transcription varies during cell cycle progression [25,46].
Computational target predictions for EcpR1 suggested several cell cycle related target mRNAs among the top 50 candidates (P<0.005), albeit transcriptome and in vivo interaction studies only provided evidence for a direct interaction with gcrA and dnaA mRNAs, ranking in positions 1 and 3, respectively. Still, we cannot exclude that further interactions occur which the two-plasmid assay failed to detect. Similarities between phenotypes caused by EcpR1 overproduction and modest GcrA depletion suggest that a decrease in GcrA concentration contributed to this perturbation of cell cycle progression. DnaA-depletion has been reported to go along with an increase in cell length, while DNA synthesis is arrested [16]. These elongated cells contained only one chromosome, in contrast to the ecpR1 overexpressing cells that showed an increase in cell length and DNA content.
Although gcrA and dnaA promoter regions have been extensively studied in C. crescentus [13,72,73], the functions of the long 5’-UTRs are still unknown in both organisms. Here, we obtained evidence that these 5’-UTRs are involved in trans-sRNA mediated post-transcriptional regulation in S. meliloti. Our experiments indicate that degradation of the gcrA mRNA was not significantly promoted by ecpR1 overexpression. Yet, the output of a reporter gene fused to the gcrA 5’-UTR was considerably reduced. This is indicative of EcpR1 rather affecting translational efficiency than stability of the gcrA mRNA. However, the single binding site for EcpR1 was identified close to the TSS far upstream of the RBS. sRNA-mediated translational control mostly involves its binding to sequences surrounding the RBS, preventing the ribosome from initiating translation. So far, alternative mechanisms of translational control have been poorly studied, but other models of sRNA repression, such as competing with a “RBS standby site” or pairing with a translation enhancer element have been proposed [74]. In contrast, stability of the dnaA mRNA was negatively affected by enhanced levels of EcpR1 and the regulatory effect of this sRNA was significantly alleviated by a C-terminal truncation of RNase E, suggesting that EcpR1 promotes dnaA mRNA degradation. Assuming that EcpR1-induced cell cycle perturbation is mainly due to translational inhibition of gcrA, these data are in agreement with maintaining this phenotype in the background of the RNase E truncation.
Computational analysis predicted five sequence motifs in the dnaA mRNA that are likely to form a stable duplex with EcpR1, which is an exceptionally high number for these types of interactions. Our data strongly suggests that the two binding sites overlapping the RBS and the start codon are sufficient for and synergistically enhance the regulatory effect of EcpR1 on the dnaA mRNA under the conditions tested. A conserved GC-rich sequence in loop 1 of EcpR1 was consistently found to be involved in the interactions with these two binding sites in the dnaA and one binding site in the gcrA mRNA. In bacteria and plants, multiple binding of a target mRNA by a trans-sRNA mediated by the same interaction region is a rare finding, although frequently observed for regulatory non-coding RNAs in animals. Binding of multiple target sequences in bacterial mRNAs has been reported, but usually involves different interaction regions of the sRNA. Examples are the MicF sRNA that binds to the lpxR mRNA both at the RBS and in the coding sequence [75], as well as the polycistronic mRNA manXYZ which is targeted at the RBS and in the intergenic region through overlapping interaction regions of the sRNA SgrS [76].
EcpR1 broadens the unprecedented discovery of prokaryotic sRNA functions of the last two decades. Although additional biological roles of EcpR1 remain to be investigated, stress-induced stimulation of EcpR1 production and its posttranscriptional effect on gcrA and dnaA suggest an additional level of regulation contributing to a rapid and robust response of the cell cycle machinery to adverse environmental conditions.
Materials and Methods
Bacterial strains, plasmids and growth conditions
Bacterial strains and plasmids are listed in S11 Table. E. coli strains were routinely grown at 37°C in LB medium and rhizobial strains at 30°C in complex tryptone yeast (TY) medium [77] or in modified MOPS-buffered minimal medium [78] (MOPS-MM: MOPS, 10 g l-1; mannitol, 10 g l-1; NH4Cl, 1 g l-1; NaCl, 0.1 g l-1; MgSO4, 0.246 g; CaCl2, 250 mM; FeCl3•6H2O, 10 mg l-1; H3BO3, 3 mg l-1; MnSO4•4H2O, 2.23 mg l-1; biotin, 1 mg l-1; ZnSO4•7H2O, 0.3 mg l-1; NaMoO4•2H2O, 0.12 mg l-1; CoCl2•6H2O, 0.065 mg l-1, pH 7.2). Nutrient-limiting MOPS (MOPSlim) was modified as follows: mannitol, 2 g l-1; NH4Cl, 0.3 g l-1; NaCl, 0.05 g l-1; MgSO4, 0.1 g l-1. MOPS-C and -N lack mannitol or ammonium chloride, respectively. Antibiotics were added to solid media when required to the following final concentrations (mg/ml): streptomycin (Sm) 100 for Rhizobium and 600 for Sinorhizobium strains; nalidixic acid (Nx) 10; ampicillin (Ap) 200; tetracycline (Tc) 10; gentamycin (Gm) 40; rifampicin (Rf) 50; chloramphenicol 20; and kanamycin (Km) 50 for E. coli and Rhizobium and 180 for Sinorhizobium strains. For liquid cultures, the antibiotic concentration was reduced to 50%. IPTG was added to a final concentration of 0.5 mM to exponential phase cultures (OD600 of 0.3 to 0.4), unless other conditions are indicated. For stress induction, media of exponentially growing cultures were modified as described [22] and harvested 1 hour later. Motility assays, were carried out by dispensing 3 μl aliquots of the corresponding bacterial suspension (OD600 of 0.9 to 1) on soft agar plates and incubating at 30°C for 5 days. Plant nodulation assays were basically performed as described before [79].
RNA isolation and northern hybridization
RNA was isolated from bacterial cultures and from 28 days old M. sativa cv. Eugenia root nodules with the miRNeasy Mini Kit (Qiagen). Nodules covered with liquid nitrogen were ground to powder in a mortar before RNA isolation. For Northern blot detection of RNAs, 4 μg total RNA was separated on 10% polyacrylamide gels containing 7 M urea and transferred onto nylon membranes by semi-dry electroblotting. An EcpR1-specific DIG-labeled DNA probe was used for hybridization (50°C) and detection was performed using the DIG Luminescent Detection Kit (Roche) following the manufactures instructions. Size was determined in relation to an RNA molecular weight marker (NEB).
Construction of the S. meliloti mutants and derivative strains
GeneSOEing was used to construct the marker-free deletion of the chromosomal ecpR1 locus and the strain with mutations in the ecpR1 σ70-dependent promoter -10 region using the internal complementary primers listed in S12 Table. The digested PCR fusion product containing ecpR1 flanking sequences or the ecpR1 locus region carrying changes in the promoter -10 region were cloned into suicide vector pK18mobsacB, respectively. Double cross-over events were selected as previously described [80] and checked for the targeted deletion by PCR, sequencing and Northern analyses. To create a conditional depletion mutant, the gcrA locus was also deleted by geneSOEing, but this deletion was introduced to S. meliloti harbouring plasmid pSRKGm containing the gcrA gene under control of the IPTG inducible Plac promoter (PlacgcrA). Double recombinants were selected on medium supplemented with IPTG and subsequently grown on agar with and without IPTG. Strains exhibiting IPTG-dependent growth were selected and the chromosomal gcrA deletion was checked by PCR amplification and sequencing of the gcrA chromosomal locus.
For IPTG induced overexpression of ecpR1 an indirect sinR-sinI based system was applied. In S. meliloti, the LuxR-type transcription regulator SinR strongly activates the promoter of the N-acyl homoserine lactone synthase encoding gene sinI [81]. The complete sequence of the sinR gene and the sinR-sinI intergenic region containing the sinI promoter were fused to the TSS of the control sRNA gene SmelC812 or the corresponding 5’-end of ecpR1 by geneSOEing. The resulting fragments were inserted into pSRKKm to generate the expression plasmids that were transferred by conjugation to Rm4011 (expR- sinI-) to minimize background expression. A PCR-based mutation strategy was used to replace specific nucleotides within the corresponding plasmid constructs as described before [82] using the internal complementary primers listed in S12 Table.
eGFP-mediated fluorescence constructs and assays
For construction of ecpR1 promoter-egfp fusions the corresponding genomic fragments (Fig 1B) were amplified and cloned into plasmid pPHUtrap, a derivative of pPHU231 [83] containing a promoterless sinI 5’-UTR fused to egfp. S. meliloti cells carrying the ecpR1 promoter fusions were grown until stationary phase and 100 μl of the cultures were transferred to a 96 well microtiter plate and measured as described below. To accurately compare the activities of the promoter fusions at different OD600 values (0.6, 1.2, and 2.8), cells harvested at OD600 of 1.2 and 2.8 were diluted to OD600 of 0.6 before being transferred to the 96 well microtiter plate for measurement.
To determine EcpR1 target mRNA regulation in vivo, plasmid pR_EGFP [44] was used to constitutively express 5’-UTR translational fusions of the predicted target genes from its native TSS [22]. The reporter plasmids were transferred by conjugation to Rm4011ecpR1 harboring plasmids pSKControl+ or pSKEcpR1+. Three double transconjugants for each RNA-target fusion combination were grown to mid-exponential phase (OD600 of 0.3 to 0.4) and 100 μl aliquots of IPTG treated and untreated cultures were transferred to a 96 well microtiter plate and incubated at 30°C with shaking for 8 hours.
OD600, eGFP and mCherry-mediated fluorescence were measured in the Infinite M200 Pro microplate reader (Tecan). Fluorescence values were normalized to the culture OD600, and background F/OD ratios from strains harboring the corresponding empty plasmid (pPHUtrap or pR_EGFP) were subtracted from those mediated by each reporter construct.
Competitive growth assay
For estimation of the relative fitness, Rm2011 and 2011ecpR1 were labeled with mCherry or egfp by single integration of either plasmid pKOSm or pKOSe, both pK18mobII derivatives carrying PT5:mCherry or PT5:egfp cassettes follow by a T7 terminator site and a 800 bp fragment from recG. Strains were individually grown in MOPS or MOPSlim media starter cultures overnight and bacteria were then diluted in the same fresh media to OD600 of 0.005 and mixed at a ratio of 1 : 1 in a final volume of 30 ml. During a 4 weeks period, every seven days of incubation eGFP and mCherry fluorescence of the cultures were measured and the mixed population was diluted 1000-fold in fresh media. One and four weeks after the first mixed inoculation microscopy images were taken to determine the percentage of eGFP - and mCherry-labeled bacteria.
Microarray-based gene expression profiling
Four independent bacterial cultures of Rm4011 carrying pSKEcpR1+ or pSKControl+ or either Rm2011 or 2011ecpR1 were grown in 100 ml of the corresponding medium for each experiment. Cells were harvested in the indicated conditions (15 minutes, 1 hour, and 4 hours after IPTG induction or in the stationary phase of growth) and RNA was isolated. cDNA synthesis, Cy3 - and Cy5 labeling, hybridization, image acquisition and data analysis were performed as previously described [84]. Normalization and t-statistics were carried out using the EMMA 2.8.2 microarray data analysis software [85]. Genes and 5’-/3’-UTRs with P-value≤0.05 and M≥0.7 or ≤−0.7 were included in the analysis. The M value represents the log2 ratio of both channels. Transcriptome data are available at ArrayExpress (Accession No. E-MTAB-3389).
Quantitative RT-PCR analysis
qRT-PCR was carried out in a qTOWER Thermal Cycler (Analytik Jena, Germany) using the KAPA SYBR FAST One-Step qRT-PCR Kit and 50 ng of RNA per reaction (5 μl). The ratios of transcript abundance were calculated as the 2–ΔCT mean average of 3 replicates, where CT indicates the level of gene expression in the specified strain relative to the expression in the control strain. The uniformly expressed gene SMc01852 [86] was used to normalize the gene expression data.
Microscopy
Bacteria were visually examined by differential interference contrast and epifluorescence or highly inclined laminated optical sheet microscopy (Tokunaga) using a Nikon Eclipse Ti-E equipped with 100x CFI Apo TIRF Oil objective (numerical aperture of 1.49) with AHF HC filter sets F36-513 DAPI (excitation band pass 387/11 nm, beam splitter 409 nm, emission band pass 447/60 nm), F36-504 TxRed (ex bp 562/40 nm, bs 593 nm, em bp 624/40 nm) and F36-525 eGFP (exc bp 472/30 nm, beam splitter 495 nm, em bp 520/35 nm). Living cells grown to the desired condition were directly placed on 1% TY agarose pads. Images were acquired with an Andor iXon3 885 EMCCD camera. Image acquisition, measurements and adjustment were done with Nikon NIS elements 4.0 software. For time-lapse analysis images were acquired every 15 minutes at 30°C.
Fluorescence-activated cell sorting (FACS)
To identify DNA content of single cells, 200 μl of culture grown to the desired condition was harvested and fixed in 70% cold ethanol. For examination, fixed cells were washed twice and resuspended in 200 μl of 50 mM sodium citrate buffer, and DNA was stained with 50 μg/ml Hoechst 33342. Acquisition was done on a BD Biosciences LSRII flow cytometer and analyzed using FlowJo 10 software. Each histogram represents the analysis of 50,000 cells.
Bioinformatics tools
sRNA secondary structures were predicted with RNAfold [36] and represented with VARNA [87]. The full-length EcpR1 sequence was scanned for antisense interactions within several genomes using CopraRNA with standard parameters [28]. S. meliloti (NC_003047) was included as organism of interest in all rounds of genome-wide target predictions, first together with seven closely related Rhizobiaceae species belonging to the genera Sinorhizobium (NC_009636, NC_012587), Agrobacterium (NC_011985, NC_003063, NC_011988), and Rhizobium (NC_007761 and NC_008380). The second group included NC_008254, NC_014923, and NC_002678 from the genus Mesorhizobium (Phyllobacteriaceae) and the third group representatives of the Xanthobacteriaceae belonging to the genera Starkeya (NC_014217), Xanthobacter (NC_009720), and Azorhizobium (NC_009937). Finally, predictions included the same Xanthobacteriaceae representatives together with Methyocella (NC_011666) and Beijerinckia (NC_010581) (Beijerinckiaceaceae), and Rhodomicrobium (Hyphomicrobiaceae). Predicted individual sRNA-mRNA duplexes were further confirmed with IntaRNA [88] and RNAup [36]. Functional enrichment of EcpR1 top target candidates was assessed applying Fisher’s exact test. For this, the fisher.test function from R statistics [89] was employed with the “alternative” parameter set to “greater”. Based on homology search, 53 S. meliloti genes are cell cycle related. Of these, 50 are present in the total CopraRNA prediction list (length = 4962) and seven of these 50 are in the top predicted target list (length = 89) at P< = 0.01. In R notation, this leads to the following matrix for fisher.test function: matrix(c(7,43,82,4830),nrow = 2,ncol = 2). The S. meliloti ecpR1–100 region was BLASTed with default parameters against all currently available bacterial genomes and several regions exhibiting significant similarities (80–100% similarity) were used to generate automated alignments.
Supporting Information
Zdroje
1. Deng G, Sui G (2013) Noncoding RNA in oncogenesis: a new era of identifying key players. Int J Mol Sci 14 : 18319–18349. doi: 10.3390/ijms140918319 24013378
2. Bartel DP (2009) MicroRNAs: target recognition and regulatory functions. Cell 136 : 215–233. doi: 10.1016/j.cell.2009.01.002 19167326
3. He L, He X, Lim LP, de Stanchina E, Xuan Z, et al. (2007) A microRNA component of the p53 tumour suppressor network. Nature 447 : 1130–1134. 17554337
4. Combier JP, Frugier F, de Billy F, Boualem A, El-Yahyaoui F, et al. (2006) MtHAP2-1 is a key transcriptional regulator of symbiotic nodule development regulated by microRNA169 in Medicago truncatula. Genes Dev 20 : 3084–3088. 17114582
5. Bustos-Sanmamed P, Bazin J, Hartmann C, Crespi M, Lelandais-Brière C (2013) Small RNA pathways and diversity in model legumes: lessons from genomics. Front Plant Sci 4 : 236. doi: 10.3389/fpls.2013.00236 23847640
6. Ding DQ, Okamasa K, Yamane M, Tsutsumi C, Haraguchi T, et al. (2012) Meiosis-specific noncoding RNA mediates robust pairing of homologous chromosomes in meiosis. Science 336 : 732–736. doi: 10.1126/science.1219518 22582262
7. Yamashita A, Watanabe Y, Nukina N, Yamamoto M (1998) RNA-assisted nuclear transport of the meiotic regulator Mei2p in fission yeast. Cell 95 : 115–123. 9778252
8. Waters LS, Storz G (2009) Regulatory RNAs in bacteria. Cell 136 : 615–628. doi: 10.1016/j.cell.2009.01.043 19239884
9. Storz G, Vogel J, Wassarman KM (2011) Regulation by small RNAs in bacteria: expanding frontiers. Mol Cell 43 : 880–891. doi: 10.1016/j.molcel.2011.08.022 21925377
10. Jonas K (2014) To divide or not to divide: control of the bacterial cell cycle by environmental cues. Curr Opin Microbiol 18 : 54–60. doi: 10.1016/j.mib.2014.02.006 24631929
11. Tsokos CG, Laub MT (2012) Polarity and cell fate asymmetry in Caulobacter crescentus. Curr Opin Microbiol 15 : 744–750. doi: 10.1016/j.mib.2012.10.011 23146566
12. Curtis PD, Brun YV (2010) Getting in the loop: regulation of development in Caulobacter crescentus. Microbiol Mol Biol Rev 74 : 13–41. doi: 10.1128/MMBR.00040-09 20197497
13. Collier J, Murray SR, Shapiro L (2006) DnaA couples DNA replication and the expression of two cell cycle master regulators. EMBO J 25 : 346–356. 16395331
14. McAdams HH, Shapiro L (2009) System-level design of bacterial cell cycle control. FEBS Lett 583 : 3984–3991. doi: 10.1016/j.febslet.2009.09.030 19766635
15. Laub MT, Chen SL, Shapiro L, McAdams HH (2002) Genes directly controlled by CtrA, a master regulator of the Caulobacter cell cycle. Proc Natl Acad Sci U S A 99 : 4632–4637. 11930012
16. Marczynski GT, Shapiro L (2002) Control of chromosome replication in Caulobacter crescentus. Annu Rev Microbiol 56 : 625–656. 12142494
17. Biondi EG, Reisinger SJ, Skerker JM, Arif M, Perchuk BS, et al. (2006) Regulation of the bacterial cell cycle by an integrated genetic circuit. Nature 444 : 899–904. 17136100
18. Berghoff BA, Glaeser J, Sharma CM, Vogel J, Klug G (2009) Photooxidative stress-induced and abundant small RNAs in Rhodobacter sphaeroides. Mol Microbiol 74 : 1497–1512. doi: 10.1111/j.1365-2958.2009.06949.x 19906181
19. Landt SG, Abeliuk E, McGrath PT, Lesley JA, McAdams HH, et al. (2008) Small non-coding RNAs in Caulobacter crescentus. Mol Microbiol 68 : 600–614. doi: 10.1111/j.1365-2958.2008.06172.x 18373523
20. Becker A, Overlöper A, Schlüter JP, Reinkensmeier J, Robledo M, et al. (2014) Riboregulation in plant-associated α-proteobacteria. RNA Biol 11.
21. Schlüter JP, Reinkensmeier J, Daschkey S, Evguenieva-Hackenberg E, Janssen S, et al. (2010) A genome-wide survey of sRNAs in the symbiotic nitrogen-fixing alpha-proteobacterium Sinorhizobium meliloti. BMC Genomics 11 : 245. doi: 10.1186/1471-2164-11-245 20398411
22. Schlüter JP, Reinkensmeier J, Barnett MJ, Lang C, Krol E, et al. (2013) Global mapping of transcription start sites and promoter motifs in the symbiotic α-proteobacterium Sinorhizobium meliloti 1021. BMC Genomics 14 : 156. doi: 10.1186/1471-2164-14-156 23497287
23. Gibson KE, Kobayashi H, Walker GC (2008) Molecular determinants of a symbiotic chronic infection. Annu Rev Genet 42 : 413–441. doi: 10.1146/annurev.genet.42.110807.091427 18983260
24. Jones KM, Kobayashi H, Davies BW, Taga ME, Walker GC (2007) How rhizobial symbionts invade plants: the Sinorhizobium-Medicago model. Nat Rev Microbiol 5 : 619–633. 17632573
25. De Nisco NJ, Abo RP, Wu CM, Penterman J, Walker GC (2014) Global analysis of cell cycle gene expression of the legume symbiont Sinorhizobium meliloti. Proc Natl Acad Sci U S A.
26. Brilli M, Fondi M, Fani R, Mengoni A, Ferri L, et al. (2010) The diversity and evolution of cell cycle regulation in alpha-proteobacteria: a comparative genomic analysis. BMC Syst Biol 4 : 52. doi: 10.1186/1752-0509-4-52 20426835
27. Reinkensmeier R, Schluter JP, Giegerich R, Becker A (2011) Conservation and occurrence of trans-encoded sRNAs in the Rhizobiales. Genes 2 : 925–956 doi: 10.3390/genes2040925 24710299
28. Wright PR, Richter AS, Papenfort K, Mann M, Vogel J, et al. (2013) Comparative genomics boosts target prediction for bacterial small RNAs. Proc Natl Acad Sci U S A 110: E3487–3496. doi: 10.1073/pnas.1303248110 23980183
29. Bouvier M, Sharma CM, Mika F, Nierhaus KH, Vogel J (2008) Small RNA binding to 5' mRNA coding region inhibits translational initiation. Mol Cell 32 : 827–837. doi: 10.1016/j.molcel.2008.10.027 19111662
30. Sharma CM, Darfeuille F, Plantinga TH, Vogel J (2007) A small RNA regulates multiple ABC transporter mRNAs by targeting C/A-rich elements inside and upstream of ribosome-binding sites. Genes Dev 21 : 2804–2817. 17974919
31. del Val C, Rivas E, Torres-Quesada O, Toro N, Jiménez-Zurdo JI (2007) Identification of differentially expressed small non-coding RNAs in the legume endosymbiont Sinorhizobium meliloti by comparative genomics. Mol Microbiol 66 : 1080–1091. 17971083
32. Pini F, Frage B, Ferri L, De Nisco NJ, Mohapatra SS, et al. (2013) The DivJ, CbrA and PleC system controls DivK phosphorylation and symbiosis in Sinorhizobium meliloti. Mol Microbiol 90 : 54–71. doi: 10.1111/mmi.12347 23909720
33. Ulvé VM, Sevin EW, Chéron A, Barloy-Hubler F (2007) Identification of chromosomal alpha-proteobacterial small RNAs by comparative genome analysis and detection in Sinorhizobium meliloti strain 1021. BMC Genomics 8 : 467. 18093320
34. Cheng J, Sibley CD, Zaheer R, Finan TM (2007) A Sinorhizobium meliloti minE mutant has an altered morphology and exhibits defects in legume symbiosis. Microbiology 153 : 375–387. 17259609
35. Wright PR, Georg J, Mann M, Sorescu DA, Richter AS, et al. (2014) CopraRNA and IntaRNA: predicting small RNA targets, networks and interaction domains. Nucleic Acids Res 42: W119–123. doi: 10.1093/nar/gku359 24838564
36. Gruber AR, Lorenz R, Bernhart SH, Neuböck R, Hofacker IL (2008) The Vienna RNA websuite. Nucleic Acids Res 36: W70–74. doi: 10.1093/nar/gkn188 18424795
37. Valverde C, Livny J, Schlüter JP, Reinkensmeier J, Becker A, et al. (2008) Prediction of Sinorhizobium meliloti sRNA genes and experimental detection in strain 2011. BMC Genomics 9 : 416. doi: 10.1186/1471-2164-9-416 18793445
38. Krol E, Becker A (2011) ppGpp in Sinorhizobium meliloti: biosynthesis in response to sudden nutritional downshifts and modulation of the transcriptome. Mol Microbiol 81 : 1233–1254. doi: 10.1111/j.1365-2958.2011.07752.x 21696469
39. Sibley CD, MacLellan SR, Finan T (2006) The Sinorhizobium meliloti chromosomal origin of replication. Microbiology 152 : 443–455. 16436432
40. Latch JN, Margolin W (1997) Generation of buds, swellings, and branches instead of filaments after blocking the cell cycle of Rhizobium meliloti. J Bacteriol 179 : 2373–2381. 9079925
41. Kahng LS, Shapiro L (2001) The CcrM DNA methyltransferase of Agrobacterium tumefaciens is essential, and its activity is cell cycle regulated. J Bacteriol 183 : 3065–3075. 11325934
42. Bahlawane C, McIntosh M, Krol E, Becker A (2008) Sinorhizobium meliloti regulator MucR couples exopolysaccharide synthesis and motility. Mol Plant Microbe Interact 21 : 1498–1509. doi: 10.1094/MPMI-21-11-1498 18842098
43. Fields AT, Navarrete CS, Zare AZ, Huang Z, Mostafavi M, et al. (2012) The conserved polarity factor podJ1 impacts multiple cell envelope-associated functions in Sinorhizobium meliloti. Mol Microbiol 84 : 892–920. doi: 10.1111/j.1365-2958.2012.08064.x 22553970
44. Torres-Quesada O, Millán V, Nisa-Martínez R, Bardou F, Crespi M, et al. (2013) Independent activity of the homologous small regulatory RNAs AbcR1 and AbcR2 in the legume symbiont Sinorhizobium meliloti. PLoS One 8: e68147. doi: 10.1371/journal.pone.0068147 23869210
45. Giacomini A, Ollero FJ, Squartini A, Nuti MP (1994) Construction of multipurpose gene cartridges based on a novel synthetic promoter for high-level gene expression in gram-negative bacteria. Gene 144 : 17–24. 8026755
46. Greif D, Pobigaylo N, Frage B, Becker A, Regtmeier J, et al. (2010) Space - and time-resolved protein dynamics in single bacterial cells observed on a chip. J Biotechnol 149 : 280–288. doi: 10.1016/j.jbiotec.2010.06.003 20599571
47. Galibert F, Finan TM, Long SR, Puhler A, Abola P, et al. (2001) The composite genome of the legume symbiont Sinorhizobium meliloti. Science 293 : 668–672. 11474104
48. Gottesman S, Storz G (2011) Bacterial small RNA regulators: versatile roles and rapidly evolving variations. Cold Spring Harb Perspect Biol 3.
49. Rice JB, Vanderpool CK (2011) The small RNA SgrS controls sugar-phosphate accumulation by regulating multiple PTS genes. Nucleic Acids Res 39 : 3806–3819. doi: 10.1093/nar/gkq1219 21245045
50. Desnoyers G, Morissette A, Prévost K, Massé E (2009) Small RNA-induced differential degradation of the polycistronic mRNA iscRSUA. EMBO J 28 : 1551–1561. doi: 10.1038/emboj.2009.116 19407815
51. Majdalani N, Cunning C, Sledjeski D, Elliott T, Gottesman S (1998) DsrA RNA regulates translation of RpoS message by an anti-antisense mechanism, independent of its action as an antisilencer of transcription. Proc Natl Acad Sci U S A 95 : 12462–12467. 9770508
52. Guillier M, Gottesman S (2008) The 5' end of two redundant sRNAs is involved in the regulation of multiple targets, including their own regulator. Nucleic Acids Res 36 : 6781–6794. doi: 10.1093/nar/gkn742 18953042
53. Brennan RG, Link TM (2007) Hfq structure, function and ligand binding. Curr Opin Microbiol 10 : 125–133. 17395525
54. Folichon M, Arluison V, Pellegrini O, Huntzinger E, Régnier P, et al. (2003) The poly(A) binding protein Hfq protects RNA from RNase E and exoribonucleolytic degradation. Nucleic Acids Res 31 : 7302–7310. 14654705
55. Torres-Quesada O, Reinkensmeier J, Schlüter JP, Robledo M, Peregrina A, et al. (2014) Genome-wide profiling of Hfq-binding RNAs uncovers extensive post-transcriptional rewiring of major stress response and symbiotic regulons in Sinorhizobium meliloti. RNA Biol 11.
56. Torres-Quesada O, Oruezabal RI, Peregrina A, Jofré E, Lloret J, et al. (2010) The Sinorhizobium meliloti RNA chaperone Hfq influences central carbon metabolism and the symbiotic interaction with alfalfa. BMC Microbiol 10 : 71. doi: 10.1186/1471-2180-10-71 20205931
57. Gao M, Barnett MJ, Long SR, Teplitski M (2010) Role of the Sinorhizobium meliloti global regulator Hfq in gene regulation and symbiosis. Mol Plant Microbe Interact 23 : 355–365. doi: 10.1094/MPMI-23-4-0355 20192823
58. Morita T, Maki K, Aiba H (2005) RNase E-based ribonucleoprotein complexes: mechanical basis of mRNA destabilization mediated by bacterial noncoding RNAs. Genes Dev 19 : 2176–2186. 16166379
59. Baumgardt K, Charoenpanich P, McIntosh M, Schikora A, Stein E, et al. (2014) RNase E affects the expression of the acyl-homoserine lactone synthase gene sinI in Sinorhizobium meliloti. J Bacteriol 196 : 1435–1447. doi: 10.1128/JB.01471-13 24488310
60. Fioravanti A, Fumeaux C, Mohapatra SS, Bompard C, Brilli M, et al. (2013) DNA binding of the cell cycle transcriptional regulator GcrA depends on N6-adenosine methylation in Caulobacter crescentus and other Alphaproteobacteria. PLoS Genet 9: e1003541. doi: 10.1371/journal.pgen.1003541 23737758
61. Jonas K, Liu J, Chien P, Laub MT (2013) Proteotoxic stress induces a cell-cycle arrest by stimulating Lon to degrade the replication initiator DnaA. Cell 154 : 623–636. doi: 10.1016/j.cell.2013.06.034 23911325
62. Tétart F, Bouché JP (1992) Regulation of the expression of the cell-cycle gene ftsZ by DicF antisense RNA. Division does not require a fixed number of FtsZ molecules. Mol Microbiol 6 : 615–620. 1372677
63. Dadzie I, Xu S, Ni B, Zhang X, Zhang H, et al. (2013) Identification and characterization of a cis-encoded antisense RNA associated with the replication process of Salmonella enterica serovar Typhi. PLoS One 8: e61308. doi: 10.1371/journal.pone.0061308 23637809
64. Yu YT, Yuan X, Velicer GJ (2010) Adaptive evolution of an sRNA that controls Myxococcus development. Science 328 : 993. doi: 10.1126/science.1187200 20489016
65. Grieshaber NA, Grieshaber SS, Fischer ER, Hackstadt T (2006) A small RNA inhibits translation of the histone-like protein Hc1 in Chlamydia trachomatis. Mol Microbiol 59 : 541–550. 16390448
66. Tattersall J, Rao GV, Runac J, Hackstadt T, Grieshaber SS, et al. (2012) Translation inhibition of the developmental cycle protein HctA by the small RNA IhtA is conserved across Chlamydia. PLoS One 7: e47439. doi: 10.1371/journal.pone.0047439 23071807
67. Chant EL, Summers DK (2007) Indole signalling contributes to the stable maintenance of Escherichia coli multicopy plasmids. Mol Microbiol 63 : 35–43. 17163976
68. Papenfort K, Pfeiffer V, Mika F, Lucchini S, Hinton JC, et al. (2006) SigmaE-dependent small RNAs of Salmonella respond to membrane stress by accelerating global omp mRNA decay. Mol Microbiol 62 : 1674–1688. 17427289
69. Penterman J, Abo RP, De Nisco NJ, Arnold MF, Longhi R, et al. (2014) Host plant peptides elicit a transcriptional response to control the Sinorhizobium meliloti cell cycle during symbiosis. Proc Natl Acad Sci U S A.
70. Roux B, Rodde N, Jardinaud MF, Timmers T, Sauviac L, et al. (2014) An integrated analysis of plant and bacterial gene expression in symbiotic root nodules using laser-capture microdissection coupled to RNA sequencing. Plant J 77 : 817–837. doi: 10.1111/tpj.12442 24483147
71. Braun RE, O'Day K, Wright A (1985) Autoregulation of the DNA replication gene dnaA in E. coli K-12. Cell 40 : 159–169. 2981626
72. Holtzendorff J, Hung D, Brende P, Reisenauer A, Viollier PH, et al. (2004) Oscillating global regulators control the genetic circuit driving a bacterial cell cycle. Science 304 : 983–987. 15087506
73. Zweiger G, Shapiro L (1994) Expression of Caulobacter dnaA as a function of the cell cycle. J Bacteriol 176 : 401–408. 8288535
74. Desnoyers G, Bouchard MP, Massé E (2013) New insights into small RNA-dependent translational regulation in prokaryotes. Trends Genet 29 : 92–98. doi: 10.1016/j.tig.2012.10.004 23141721
75. Corcoran CP, Podkaminski D, Papenfort K, Urban JH, Hinton JC, et al. (2012) Superfolder GFP reporters validate diverse new mRNA targets of the classic porin regulator, MicF RNA. Mol Microbiol 84 : 428–445. doi: 10.1111/j.1365-2958.2012.08031.x 22458297
76. Rice JB, Balasubramanian D, Vanderpool CK (2012) Small RNA binding-site multiplicity involved in translational regulation of a polycistronic mRNA. Proc Natl Acad Sci U S A 109: E2691–2698. doi: 10.1073/pnas.1207927109 22988087
77. Beringer JE (1974) R factor transfer in Rhizobium leguminosarum. J Gen Microbiol 84 : 188–198. 4612098
78. Zhan HJ, Lee CC, Leigh JA (1991) Induction of the second exopolysaccharide (EPSb) in Rhizobium meliloti SU47 by low phosphate concentrations. J Bacteriol 173 : 7391–7394. 1938929
79. Robledo M, Jiménez-Zurdo JI, Velázquez E, Trujillo ME, Zurdo-Piñeiro JL, et al. (2008) Rhizobium cellulase CelC2 is essential for primary symbiotic infection of legume host roots. Proc Natl Acad Sci U S A 105 : 7064–7069. doi: 10.1073/pnas.0802547105 18458328
80. Schäfer A, Tauch A, Jäger W, Kalinowski J, Thierbach G, et al. (1994) Small mobilizable multi-purpose cloning vectors derived from the Escherichia coli plasmids pK18 and pK19: selection of defined deletions in the chromosome of Corynebacterium glutamicum. Gene 145 : 69–73. 8045426
81. McIntosh M, Meyer S, Becker A (2009) Novel Sinorhizobium meliloti quorum sensing positive and negative regulatory feedback mechanisms respond to phosphate availability. Mol Microbiol 74 : 1238–1256. doi: 10.1111/j.1365-2958.2009.06930.x 19889097
82. Charoenpanich P, Meyer S, Becker A, McIntosh M (2013) Temporal expression program of quorum sensing-based transcription regulation in Sinorhizobium meliloti. J Bacteriol 195 : 3224–3236. doi: 10.1128/JB.00234-13 23687265
83. Hübner P, Willison JC, Vignais PM, Bickle TA (1991) Expression of regulatory nif genes in Rhodobacter capsulatus. J Bacteriol 173 : 2993–2999. 1902215
84. Serrania J, Vorhölter FJ, Niehaus K, Pühler A, Becker A (2008) Identification of Xanthomonas campestris pv. campestris galactose utilization genes from transcriptome data. J Biotechnol 135 : 309–317. doi: 10.1016/j.jbiotec.2008.04.011 18538881
85. Dondrup M, Albaum SP, Griebel T, Henckel K, Jünemann S, et al. (2009) EMMA 2—a MAGE-compliant system for the collaborative analysis and integration of microarray data. BMC Bioinformatics 10 : 50. doi: 10.1186/1471-2105-10-50 19200358
86. Becker A, Bergès H, Krol E, Bruand C, Rüberg S, et al. (2004) Global changes in gene expression in Sinorhizobium meliloti 1021 under microoxic and symbiotic conditions. Mol Plant Microbe Interact 17 : 292–303. 15000396
87. Darty K, Denise A, Ponty Y (2009) VARNA: Interactive drawing and editing of the RNA secondary structure. Bioinformatics 25 : 1974–1975. doi: 10.1093/bioinformatics/btp250 19398448
88. Smith C, Heyne S, Richter AS, Will S, Backofen R (2010) Freiburg RNA Tools: a web server integrating INTARNA, EXPARNA and LOCARNA. Nucleic Acids Res 38: W373–377. doi: 10.1093/nar/gkq316 20444875
89. R Core Team (2014). R: A language and environment for statistical computing. R Foundation for Statistical Computing, Vienna, Austria. doi: 10.1016/j.jneumeth.2014.06.019 24970579
Štítky
Genetika Reprodukční medicínaČlánek vyšel v časopise
PLOS Genetics
2015 Číslo 4
Nejčtenější v tomto čísle
- Lack of GDAP1 Induces Neuronal Calcium and Mitochondrial Defects in a Knockout Mouse Model of Charcot-Marie-Tooth Neuropathy
- Proteolysis of Virulence Regulator ToxR Is Associated with Entry of into a Dormant State
- Frameshift Variant Associated with Novel Hoof Specific Phenotype in Connemara Ponies
- Ataxin-2 Regulates Translation in a New BAC-SCA2 Transgenic Mouse Model