
Temporal Expression Profiling Identifies Pathways Mediating Effect of Causal Variant on Phenotype
The causal path from a genetic variant to a complex phenotype such as disease progression is often not known. Studying gene expression variation is one approach to identify the mediating genes, however, it is difficult to distinguish causative from correlative genes. This becomes a challenge especially when studying developmental and physiological traits, since they involve dynamic processes contributing to the variation and only single static expression profiling is performed. As a proof of concept, we addressed this challenge here in yeast, by studying genome-wide gene expression in the presence of the causative polymorphism of MKT1 as the sole genetic variant, during the time phase when it contributes to sporulation efficiency variation. Our analysis during early sporulation identified mitochondrial retrograde signaling and nitrogen starvation as novel regulators, acting additively to regulate sporulation efficiency. Furthermore, we showed that PUF3, a known interactor of MKT1 had an independent role in sporulation. Our results highlight the role of differential mitochondrial signaling for efficient meiosis, providing insights into the factors regulating infertility. In addition, our study has implications for characterizing the molecular effects of causal genetic variants on dynamic biological processes during development and disease progression.
Published in the journal:
. PLoS Genet 11(6): e32767. doi:10.1371/journal.pgen.1005195
Category:
Research Article
doi:
https://doi.org/10.1371/journal.pgen.1005195
Summary
The causal path from a genetic variant to a complex phenotype such as disease progression is often not known. Studying gene expression variation is one approach to identify the mediating genes, however, it is difficult to distinguish causative from correlative genes. This becomes a challenge especially when studying developmental and physiological traits, since they involve dynamic processes contributing to the variation and only single static expression profiling is performed. As a proof of concept, we addressed this challenge here in yeast, by studying genome-wide gene expression in the presence of the causative polymorphism of MKT1 as the sole genetic variant, during the time phase when it contributes to sporulation efficiency variation. Our analysis during early sporulation identified mitochondrial retrograde signaling and nitrogen starvation as novel regulators, acting additively to regulate sporulation efficiency. Furthermore, we showed that PUF3, a known interactor of MKT1 had an independent role in sporulation. Our results highlight the role of differential mitochondrial signaling for efficient meiosis, providing insights into the factors regulating infertility. In addition, our study has implications for characterizing the molecular effects of causal genetic variants on dynamic biological processes during development and disease progression.
Introduction
Identifying the causative genetic variants associated with complex human diseases is only the first step [1]. The major challenge is to understand how these genetic variants cause the disease. The mediating molecular pathways connecting these variants to phenotypes have been more systematically understood in model organisms than in humans [2]. However, even in model organisms there are several examples where a causal genetic variant is not a component of the annotated pathways associated to a trait, making it difficult to fully understand its molecular basis [3]. Having this complete knowledge for complex diseases has a huge potential for development and evaluation of available therapeutic and preventive strategies to counter these diseases [4].
Studying gene expression variation is a standard approach for identification of the causal path from a genetic variant to disease [5,6]. Many of these causal genetic variants have been resolved to single nucleotide polymorphisms (SNPs). Several studies in multiple organisms have been performed to study the effects of these variants called as expression quantitative trait loci (eQTLs) [7,8]. However, for making predictions for the molecular mechanisms underlying a disease, trans-acting SNPs are more challenging than cis-acting. This is due to the difficulty in distinguishing causative effects of these SNPs from the correlative effects since a SNP can: i) either affect gene expression and the phenotype independently, or ii) modulate gene expression of downstream molecular players, which in turn causes phenotypic variation (causal mediators), or iii) modulate the phenotype which then affects the gene-expression [5]. A few pragmatic approaches have been recently tested in model organisms to identify the causal mediators by studying gene expression changes. One approach, for instance, involved utilizing expression information for the causal genetic variants from multiple environments, which was a better predictor to identify the causal molecular intermediates by the fact that they interact persistently with the variant [9]. For developmental and physiological processes, gene expression follows complex dynamic patterns [10] and so the effect of eQTLs on gene expression can be highly context-sensitive, depending on the developmental stage, physiological phase or tissue type [11–13]. Therefore, when the causative molecular effects of a genetic variant are being studied by measuring gene expression, knowledge of the particular temporal phase when the causal variant transduces its molecular effects is crucial.
Allele replacement strains have been used extensively for fine-mapping the effects of causal genetic variants associated with a trait [14]. Studying allele-specific gene expression could be yet another useful approach which could be exploited in model organisms such as yeast, to study the precise molecular effects of the causal variant on the trait. This can be done by performing genome-wide expression profiling in a pair of allele replacement strains having the same genetic background except for the allele. Using allele replacement strains, MKT1(89G) was identified as a causal genetic variant for an efficient completion of sporulation in yeast, called its sporulation efficiency [15]. MKT1 is a putative endonuclease and its molecular role is beginning to be, but not completely understood [9,16]. MKT1 has been mapped as a causative gene for several stress-related complex phenotypes, highlighting its extensive pleiotropy [9,17–22], but its functional role in sporulation remains unclear. The developmental process of sporulation in yeast encompasses two meiotic divisions followed by spore formation [23,24]. A study performed parallel phenotyping analysis for the yeast deletion collection and identified around 200 genes required for optimal sporulation efficiency [25]. These genes are both sporulation-specific (i.e., required only during meiotic processes) and majorly sporulation-associated (i.e., required for general cellular functions during sporulation such as nutrient metabolism and respiration). However, the study did not identify MKT1 as one of these genes. It is also not known if MKT1(89G) affects any of these 200 genes or any other gene to increase sporulation efficiency. The first association of MKT1 and sporulation process was reported in the linkage mapping study between segregants of SK1 and S288c strains [15]. Moreover, MKT1(89G) was mapped for sporulation efficiency, the end-point of sporulation process. We do not know at which temporal phase during the course of sporulation (early entry into meiosis, middle progression through meiotic phases, or late spore wall formation), MKT1 affects meiosis.
In this study, we hypothesized that the use of allele replacement strains for studying genome-wide gene-expression during the temporal phase when the causal variant contributes to the phenotype could provide useful insights for identifying the causal molecular mediators underlying complex trait variation. In a pair of allele replacement strains differing solely for MKT1 causal allele, we characterized the molecular role of MKT1(89G) in yeast sporulation efficiency variation. Using genetic assays and mathematical modeling for the meiotic events, we identified the role of MKT1(89G) in the early phases of sporulation. In the specific context of MKT1(89G), we studied the genome-wide transcriptional response particularly in the early phase of sporulation and then genetically tested the candidate mediators. Using such an approach, we identified and confirmed novel pathways mediating the effects of MKT1(89G) in sporulation efficiency variation. The molecular findings resulting from our study demonstrate the advantage of studying allele-specific temporal gene expression dynamics to identify the causal pathways linking genetic variant to complex traits.
Results
Early effects of causal variant on phenotypic variation
Allele replacement of MKT1 in the S288c strain from the endogenous adenine (89A) to guanine (89G), of SK1 strain, resulted in increased sporulation efficiency [15]. Whole-genome re-sequencing of the MKT1 allele replacement strain followed by a series of backcrosses (Methods), was done to confirm that MKT1(A89G) was the only sequence difference between the S288c parent (MKT1(89A) indicated as “S strain”) and the allele replacement strain (MKT1(89G) indicated as “M strain”), the two strains used in this study. After 48h, the high sporulating SK1 strain and the M strain showed increased sporulation efficiency compared to the S strain, which was consistent with the previous report [15] (Fig 1, Table 1, Methods). Compared to the S strain, the SK1 and M strains showed a 17 - and a 9-fold increase, respectively (P = 1.9x10⁻²⁸, P = 1.0x10⁻²⁵, respectively, pair test in Methods). Deletion of MKT1 in the S strain resulted in sporulation efficiency similar to the S strain, showing that MKT1(89A) is a loss-of-function allele for its function in sporulation (Fig 1, Table 1). However, it is possible that the MKT1(89A) gene product may have an activity for other phenotypes.


To define the temporal phase during sporulation when MKT1(89G) contributes to sporulation efficiency, firstly the proportion of yeast cells completing Meiosis I and II (MI and MII) in the S, M and SK1 strains were quantified (Fig 2A, Methods). M strain started entering MI/II within 10h in sporulation medium, while S strain did not enter MI/II even after 48h. Using these data, multi-stage modeling for the M strain and the parent strains S and SK1 was done to study the distribution of the cell population in different stages of meiosis (Methods, S1 File). As expected, the model predicted that the difference between the M and the S strains occurred during entry into meiosis (initial lag phase of sporulation, S1 Fig). Hence, our observations and the model suggested an early role of the causal variant of MKT1 in sporulation, which was in agreement with a recent study that showed the contribution of causal variants in critical decision-making steps in the early stages of a phenotypic process [26]. In order to confirm this early role of MKT1(89G) in sporulation efficiency variation, a tetracycline-repressible dual-system was used to conditionally express MKT1(89G) (Methods). MKT1(89G) expression was switched off until 3h after initiation of sporulation, which led to a reduction in the sporulation efficiency of the M strain (PTet-MKT1) equivalent to the S strain (Fig 2B, S2 Fig). This result showed that activity of MKT1(89G) allele was essential within the first 3h of sporulation.
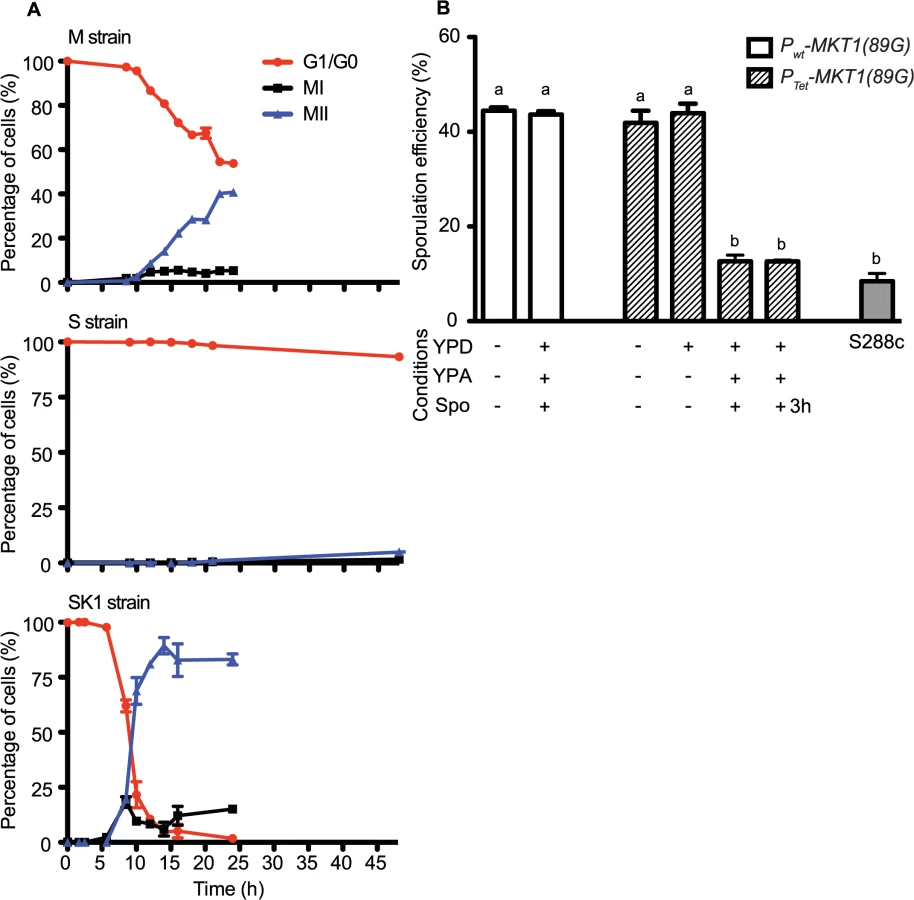
Meiotic initiation is regulated by multiple nutrient signaling pathways [27]. The functional allele of MKT1 has a fitness advantage during growth in glucose-rich conditions [9]. Therefore, we tested if increased sporulation efficiency of the M strain is influenced by expression of MKT1(89G) during the rich growth medium stage preceding sporulation (Methods). We observed that switching off MKT1(89G) during growth in glucose had no effect on sporulation efficiency of the M strain (Fig 2B). Altogether, these results indicated that the role of MKT1(89G) during sporulation was independent of its role during growth in glucose and that the allele played a role in the early response to sporulation.
Genome-wide gene expression response in the presence of causal variant
To identify the pathways through which the MKT1(89G) allele affects early sporulation, we studied the entire range of transcriptional response in the S and M strains during the first 10h of sporulation, with denser sampling in the early phase of sporulation (Methods). An extensive remodeling of gene expression was observed in both strains, which increased as time progressed through sporulation (S5 Fig). As expected, the genes involved in sporulation showed a higher expression in the M strain than in the S strain (P = 2.0 x 10–37, permutation P = 0.16, Methods, S6 Fig). Amongst all genes, we identified 862 gene transcripts showing a statistically significant (10% FDR, Methods) differential expression as a function of time between the M and S strains. No enrichment of any functional category within these differentially expressed genes was observed, indicating the pleiotropic role of MKT1(89G) and that it might be affecting various aspects of the sporulation process. Comparison of expression profiles of the few known meiotic regulators in the M and S strains showed that IME1, the master regulator of meiosis [28], was not differentially expressed. However, NDT80, the other crucial regulator of meiosis, involved in meiotic commitment [29], was differentially expressed (S7 Fig, S4 Table). These results suggested that MKT1(89G) could affect sporulation at the post-transcriptional level of IME1 or at the transcriptional level of NDT80, both of which could have early regulatory consequences during meiosis [30]. This observation also suggested that the role of MKT1(89G) during sporulation might be early and upstream to the regulators of meiosis, in agreement with our earlier results (see Fig 2A and 2B).
To capture the early role of MKT1(89G) during sporulation, genes upregulated early in the M strain and either downregulated or expressed later in the S strain, were considered. Thus, differentially expressed genes were clustered based on their expression profiles, separately for the M and S strains (Methods). Clustering gave six and seven clusters in the M and S strains, respectively, from which four major clusters were identified in each strain (Fig 3A, S5 Table). Clusters I and II consisted of genes mostly expressed in the early stages of meiosis with an enrichment for the target genes of IME1 and NDT80, respectively. In particular Cluster I contained some of the earliest expression changes in the M strain. Comparison of this early cluster between the M and the S strains showed that while 46% (71/143) of its genes overlapped (Fig 3B, S5 Table), the remaining 72 early expressing genes were uniquely differentially expressed in the M strain (S6 Table). We posited that transcription factor(s) whose target genes were significantly enriched within these unique 72 early expressing genes of the M strain might be involved in regulating entry into meiosis. Forty one such transcription factors (P ≤ 0.05, odds ratio ≥ 1.5) were identified, which consisted of the regulators of metabolic and mitochondrial signaling (Methods, S7 Table), including sporulation-specific genes, such as IME1, SIN3 and WTM2 (a UME1 paralog). To evaluate if the approach we used indeed identified the causal mediating genes contributing to sporulation efficiency variation in the context of MKT1(89G), we selected a few candidate genes from this list of regulators for further investigation. One of the major concerns while studying gene expression is that transcriptional changes can be buffered at the level of phenotype and so do not always manifest themselves in phenotypic variation [31]. Hence, to avoid this buffering while identifying causal regulators of sporulation downstream MKT1(89G), a comprehensive literature survey was done for the selected 41 transcription factors to identify the prime candidate regulators. We did not consider those genes, which have been previously shown to have a causal relationship with sporulation efficiency variation [25]. While prioritizing candidate genes, specifically those regulators were chosen whose functional annotations were related to the processes associated with early regulation of sporulation, such as mitochondrial function and nutrient starvation, but a causal role in sporulation was not known [24,27,32–35]. From this list, RTG1, a regulator of mitochondrial retrograde signaling [36] and DAL82, a regulator of nitrogen metabolism [37] (Fig 4, S8–10 Figs, S8 Table) were selected for further investigation.


Identification of novel pathways mediating the causal effects of genetic variant on phenotypic variation
To test the role of RTG1 and DAL82 in sporulation efficiency variation, their deletions in both M and S strains were phenotyped. Another regulator of retrograde signaling RTG3 [38], a physical interactor and target gene of RTG1, showing differential expression in our data, was also deleted in the two strains. Deleting RTG1, RTG3 or DAL82 reduced the mean sporulation efficiency in the M strain significantly, by about two-fold (P = 6.2x10⁻¹⁰, P = 2.8x10⁻¹⁰, P = 1.6x10⁻⁷ respectively, Fig 5A, Table 1, pair test in Methods). This effect was specific to the M strain, because deletion of these genes in the S strain did not affect their mean sporulation efficiency (Fig 5A, Table 1, pair test in Methods); and for RTG1 and RTG3, significant interaction terms were found between the backgrounds (S and M strains) and the deletion for these genes (P = 5.8x10⁻⁵, P = 4.7x10⁻³ respectively, interaction test in Methods). RTG1, RTG3 and DAL82 have not been previously identified as involved in sporulation efficiency as determined from a genome-wide deletion screen [25]. Since this deletion collection was made in the S288c background, carrying the non-functional allele MKT1(89A), this could be a possible reason for the lack of functional implication. A deletion study in the SK1 strain that contains the functional MKT1(89G) allele, did not investigate the association of these early sporulation regulators with the process [39]. However, interestingly, an up-regulation of RTG1 in the early phase of sporulation has been observed in SK1 [40]. These results, thus, support our approach of studying the early effects of the causative allele and implicate novel roles for RTG1, RTG3 and DAL82 in the early phase of sporulation efficiency downstream to MKT1(89G).

To further investigate if RTG1/3 and DAL82 belonged to the same pathway (epistatic effect) or were in separate pathways (additive effect), double deletions for RTG3 and DAL82 were phenotyped in the M strain. Deletion of RTG3 and DAL82 together reduced the mean sporulation efficiency of the M strain by approximately 3-fold (Fig 5A, Table 1). A non-significant interaction term was obtained between RTG3 and DAL82 (interaction test in Methods), indicating that they regulated sporulation efficiency additively, downstream to MKT1(89G). Furthermore, because deletion of RTG3 and DAL82 in the M background only partially reduced the sporulation efficiency to that of the S strain (P [M (rtg3∆ dal82∆) vs. S] = 2.5x10⁻⁷, Fig 5A, pair test in Methods), these results indicated that these genes explained a partial role of MKT1(89G), and additional complementary pathways were at play.
The mitochondrial retrograde signaling pathway gets upregulated in response to altered mitochondrial function and nutrient starvation. This pathway fine-tunes the metabolic and stress response pathways of the cell by affecting glutamate synthesis and mitochondrial DNA maintenance [33,41]. Since mitochondrial function with regard to respiration is implicated as a critical regulator of sporulation [42], we speculated if differential mitochondrial activity was involved in sporulation efficiency variation in the presence of MKT1(89G). We evaluated the mitochondrial function in the M and S strains by assaying oxygen consumption flux during early sporulation (Methods). The M strain showed a better mitochondrial function than the S strain (Fig 5B) at 1h in sporulation. Deletion of RTG3 in the M strain decreased this oxygen consumption flux, though dal82∆ had no effect on the flux (Fig 5B). These results suggested a role of differential mitochondrial function in sporulation efficiency variation. However, a better understanding of the role of mitochondrial retrograde pathway in sporulation efficiency would require further investigation.
Role of PUF3 in sporulation efficiency independent of MKT1(89G)
Differential mitochondrial activity in the presence of MKT1(89G) suggests a role for the Mkt1 interactor, Puf3, a Pumilio-family protein, which has been suggested to explain the extensive MKT1(89G) pleiotropy during mitotic growth in rich media as well as in stress environments [16,22,43]. Puf3 is an mRNA binding protein that regulates the fate of nearly 200 nuclear-encoded mitochondrial transcripts [44]. Even though we found a few PUF3 target genes (13/214 genes) differentially expressed during sporulation, none were in the set of unique early expressed transcripts in the M strain (S10 Fig). To further evaluate if PUF3 had a role in sporulation efficiency variation in the presence of MKT1(89G), we deleted PUF3 in the S and M strains and M strain with single deletions of rtg3∆ and dal82∆. If PUF3 has an independent role in sporulation, reduction in sporulation efficiency by puf3∆ deletion would be independent of the background (MKT1, RTG3 or DAL82), and we would observe an additive effect on sporulation efficiency. Any observed significant deviation from this expectation would imply dependence. One extreme case of dependence would be epistasis. In that case, deleting PUF3 in these backgrounds would not lead to decreased sporulation efficiency. We observed that PUF3 deletions in all the four backgrounds: M, S, M (rtg3∆) and M (dal82∆) reduced their sporulation efficiency (regression line y = 0.65x showing around 35% less sporulation efficiency for all strains, Fig 6A and 6B, Table 1, pair test in Methods). Furthermore, interaction terms (Methods) were non-significant for deletion of PUF3 between the M and the S strains (P = 0.49), the M and M (rtg3∆) strains (P = 0.53), and only mildly significant between the M and M (dal82∆) strains (P = 0.02). These results indicated that the effect of PUF3 on sporulation efficiency was independent of MKT1(89G) and its downstream genes RTG1/3 and DAL82.

Discussion
Over the past decade a detailed genotype-phenotype map for complex traits including diseases has been determined [45], however, a functional map defining how causal genetic variants (alleles) modulate the underlying pathways resulting in phenotypic variation, is missing. Filling this functional gap will help to identify molecular candidates for therapeutic intervention in human diseases and to make useful predictions regarding response to a particular therapy and survival of a patient [1]. The first step to characterize this functional genotype-phenotype map requires identification of the causal mediating genes in a biological network regulating the phenotype. Investigation of the intermediate phenotypes viz. transcripts, proteins and metabolites, is routinely used to identify these causal mediators [46]. In this study we demonstrate a couple of steps essential for accurate identification of these causal molecular mediators: i) studying allele-specific temporal dynamics of the biological processes underlying complex traits, and ii) allele-specific functional validation of the predicted mediators. We report the characterization of molecular pathways modulated by a causal genetic variant in a dynamic biological process using the above approach. In particular, we studied the molecular effects of the essential MKT1(89G) allele on the yeast transcriptome during sporulation. We not only identified novel pathways regulating the phenotype, but also confirmed the independent role of a known interactor (Puf3) of MKT1(89G) in the phenotype (Fig 7). MKT1(89A) is not a naturally occurring allele, observed only in the S288c strain [20]. However, such rare polymorphisms are receiving increasing attention for their contribution to common human diseases [47]. In this sense, our approach has a general applicability since it can be applied to study the molecular basis of both common and rare variants.

Using our approach of studying early gene expression dynamics in response to the MKT1(89G) allele, we identified that regulators of mitochondrial retrograde signaling and of nitrogen starvation act additively to regulate sporulation efficiency (Fig 5A). Mitochondria responds to a wide array of stresses by inducing various complex cellular responses and promoting cellular adaptation to reduce the impact of further stressors [48]. Mitochondrial retrograde signaling is one of the stress signaling responses of the cell during mitochondrial functional alteration and glutamate starvation [33]. It affects mitochondrial DNA maintenance [49] and hence the respiratory competency of a cell. During meiosis in yeast cells, energy production occurs through the Krebs cycle [32,35,42], and hence respiration is a critical regulator of meiosis in yeast [42] and in humans. In humans, low mitochondrial DNA has been associated with ovarian insufficiency [50]. We observed an improved mitochondrial activity during early sporulation in the M strain compared to the S strain (Fig 5B). A reduction in this high mitochondrial activity in the absence of mitochondrial retrograde signaling regulator RTG3 indicated that MKT1(89G) might confer a better stress response through RTG3, with increased sporulation efficiency being one of the consequences. This role of retrograde signaling in regulation of developmental processes responding to nutritional stresses has been shown for pseudohyphal growth in yeast [51]. Further investigating this association of differential mitochondrial signaling, particularly retrograde signaling with meiosis and development in general can help provide insights into the factors regulating infertility.
In this study, we characterized the essential role of MKT1(89G) allele in sporulation efficiency. This allele was particularly interesting to study as this coding polymorphism of MKT1 is present in all laboratory strains (except strains isogenic to S288c), as well as clinical and natural isolates of yeast including the SGRP strain collection [15,18,20,52]. Since the previous genetic screens [39,25,53] or genome-wide expression studies [40,54] for sporulation and sporulation efficiency, were done in the S288c background carrying the MKT1 allele which is non-functional in sporulation, this could be a possible reason for not identifying MKT1 to be involved in the process. The founder strain of S288c, EM93 carries the MKT1(89G) allele suggesting that during domestication of S288c this functional allele was lost [20,55]. During evolution of S288c in low-glucose conditions, the native MKT1(89A) mutated to MKT1(89G) within 500 generations [56], also indicating the crucial role of MKT1(89G) in stress-related conditions. Altogether, these observations demonstrate the limitations of studying genotype-phenotype relationships in a single genetic background, especially in laboratory strains, which might have degenerated their stress response machinery partially or completely, as a result of domestication [57].
Using our approach, we further showed an MKT1(89G)-independent role of PUF3 in meiosis (Fig 6A and 6B). This was surprising since eQTL mapping studies have suggested MKT1 as a global regulator of gene expression [22,58] and have identified its most upstream interactors, such as PUF3, during mitotic growth in multiple environments [9,16]. Puf3 regulates translation and degradation of nuclear-encoded mitochondrial mRNAs by localizing them near mitochondria or P-bodies, which are cytoplasmic sites for mRNA decay and stalling [16,44,59,60]. Since MKT1 has a post-transcriptional regulatory role both in yeast [61] and in trypanosomes [62], its interaction with PUF3 suggested a probable mechanism for understanding the role of MKT1. However, for sporulation efficiency, we observed that Puf3 showed an MKT1(89G)-independent role. We, therefore, speculate that Puf3 might be a mitotic growth-specific interactor of MKT1(89G). Its role in sporulation efficiency, though, could involve post-transcriptional regulation of mitochondrial mRNAs through P-bodies during sporulation. In Drosophila, C. elegans, mice and mammals [63,64], P-bodies related RNA granules are known to be involved in translational control of germ cell transcripts. However, in yeast, P-bodies have been observed only during glucose starvation and stress conditions such as ethanol tolerance [22,65]. Therefore, our results indicate an interesting interaction between Puf3 and sporulation efficiency variation and this could be a future line of investigation to determine if P-body formation has a regulatory role in yeast meiosis.
Through our analysis, we attempted to understand the molecular basis of a complex trait. Using an allele-specific approach, we determined and functionally validated the molecular consequences of a single causative variant in phenotypic variation. This approach helped to identify novel associations between mitochondrial and metabolic pathways with meiosis. Further analyses of these expression data can identify additional regulators and pathways involved in sporulation efficiency variation in the presence of MKT1(89G) (Fig 7, S7 Table). This approach demonstrated in yeast can be applied to higher eukaryotes to study transcriptional dynamics of developmental processes or progression of diseases. This will assist in understanding the precise genetic effects of a causal variant, improving the existing genotype-phenotype functional relationship map.
Materials and Methods
Yeast strains, growth and sporulation conditions
Whole-genome resequencing of the MKT1 allele replacement strain (S9 Table) was performed to confirm the presence of the causative SNP (details in S1 Table, S1 Text (Section 1)). Backcrossing the haploid allele replacement strain to the S288c parent strain three consecutive times (details in S1 Text (Section 2)) confirmed that homozygous MKT1(A89G) was the only sequence difference between the diploid S288c parent (S strain) and the allele replacement strain (M strain). All the S (MKT1(89A)) and M (MKT1(89G)) strains used in this study were derivatives of S288c strain except SK1 strain (S9 Table). The strains were grown at 30°C in YPD (1% yeast extract, 2% bacto peptone, 2% dextrose) and YPA (1% yeast extract, 2% bacto peptone, 1% potassium acetate). Deletions were performed in the haploids by replacing the specific ORF with one of the dominant drug-resistance cassettes (hphMX4, kanMX4 or natMX4) which were PCR-amplified from their respective plasmids as described previously [66]. The strains were transformed using the standard lithium acetate-based method [67] and homologous integration of the deletion cassette was confirmed by performing a colony PCR for both the ends. Three confirmed independent transformants were selected to minimize random mutations during the transformation step, diplodized using pHS2 plasmid (containing a functional HO) and phenotyped. All further experiments were performed using the diplodized parent strains and their diploid derivatives. The primers for deletions and their confirmations are listed in S10 Table. Sporulation conditions and the calculation of sporulation efficiency was done as previously described [68] in liquid sporulation medium (1% potassium acetate supplemented with 20mg/ml uracil, 20mg/ml histidine, 30mg/ml leucine, 20mg/ml methionine and 30mg/ml lysine). For each strain, minimum three biological replicates were used and approximately 1,000 cells were counted per replicate. Fold difference was calculated as the ratio of mean sporulation efficiencies of the two strains A and B when the sporulation efficiency of A is greater than of B.
Statistical analysis of sporulation efficiency data
Two statistical tests were used: the pair test and the interaction test. The pair test tests the null hypothesis that two given strains have the same sporulation efficiency. To this end, the number yi,k of sporulated cells (4-nuclei count) among the total number of cells ni,k of strain i in replicate experiment k was modeled with a quasi-binomial generalized linear model using the logit link function and subject to a common log-odd ratio βi between replicates, i.e.:

The interaction test tests the null hypothesis that the effect of mutation A is independent of the effect of mutation B, taking the M strain as reference background. This test thus compares four strains: mutation A only, mutation B only, both A and B and neither A nor B (M strain). Here, the strain S was considered as a M strain mutated for MKT1(89). For every interaction test, we considered the dataset of the four strains of interest and fitted a quasi-binomial generalized linear model using the logit link function and subject to:

Both the pair test and the interaction test were implemented in the statistical language R with the function glm() assuming a constant variance function fitted by maximizing the quasi-likelihood and using the t-test on tested parameters (see S2 File for raw data and R script).
Estimating the progression through meiotic phases
Aliquots of sporulating cells of M strain culture were fixed with ethanol at regular intervals (as indicated in Fig 2A) from 0 to 48h in the sporulation medium. These time-points were chosen to capture the progression through meiotic stages in the strain. Samples were stained with DAPI (4’-6’ diamidino-2-phenylindole) using the standard methods [69] for calculating the proportion of cells with 1-nucleus (Non-sporulating/G1), 2-nuclei (MI) and 4-nuclei (MII) using Carl Zeiss Axiovert 200 fluorescence microscope. For each strain, proportion of cells were counted till saturation was reached for two consecutive time points. Grey scale images were captured using a CCD camera and pseudo-coloured using the image acquisition software (Axiovision) supplied with the microscope. To estimate the sporulation efficiency and DAPI staining, 1,000 cells from the three biological replicates for each strain were counted.
Mathematical modeling for progression through meiotic phases
A multi-stage modeling was performed (details and raw data in S1 File). Cells in G1/S phase of cell cycle are said to be in 1-nucleus state. Cells that have completed MI or MII are said to be in 2-nuclei or 4-nuclei state, respectively. Cells that did not progress from one cell cycle state to another are mentioned as inactive cells. The existence of inactive states is supported by the fact that at steady state, some cells still have one nucleus or 2-nuclei indicating they are trapped at these stages, which could be possibly due to nuclear destruction mechanism resulting in dyads [70]. Hence, cells could be either in a 1-nucleus active, 1-nucleus inactive, 2-nuclei active, 2-nuclei inactive or 4-nuclei state. Moreover the cells were assumed to only progress in one direction (no back transitions) from the 1-nucleus active to either the 1-nucleus inactive or the 2-nuclei active stage, and from the 2-nuclei active to either the 2-nuclei inactive or to the 4-nuclei state. The samples contain a large number of cells and thus we used Ordinary Differential Equations to describe the dynamics of the system. The dynamics was modeled with an initial lag phase (measured as τ) followed by first order kinetics between the stages (measured as α, β, γ and δ, as shown below).

Conditional expression of MKT1 during sporulation
tetO7-based promoter substitution cassette containing kanMX4, amplified from the plasmid pCM225 [71], was inserted to replace the endogenous MKT1 promoter (-300 to -1bp upstream start site) in the M strain (PTet-MKT1). M strains with the endogenous promoter (Pwt-MKT1) and the tetO7 promoter (PTet-MKT1) were grown in a glucose-rich medium (YPD) and synchronized in pre-sporulation medium (YPA) prior to initiating sporulation. To determine the concentration of doxycycline at which the effect of MKT1(89G) on sporulation efficiency is similar to MKT1(89A) (implying MKT1(89G) is not functional or OFF), the PTet-MKT1 strain was grown and sporulated in 2, 3 and 5μg/ml of doxycycline and phenotyped by estimating the sporulation efficiency after 48h. At 5μg/ml doxycycline, the sporulation efficiency of the PTet-MKT1 strain was similar to the S strain (S2 Fig) and this concentration was used for further experiments. To switch off MKT1(89G) expression only during the growth in glucose, the PTet-MKT1 strain was grown in YPD with doxycycline, washed and added to YPA and the sporulation medium in the absence of doxycycline. For switching off MKT1(89G) throughout the sporulation process, doxycycline was added to all the three media (YPD, YPA and sporulation). To switch off MKT1(89G) till 3h in sporulation medium, doxycycline was added in YPD, YPA and sporulation medium. Cells were washed after 3h in sporulation and resuspended in the sporulation medium without doxycycline till 48h, and were phenotyped. A complementary experiment where MKT1(89G) was switched ON till 3h in sporulation medium and switched OFF from 3h to 48h in sporulation was done by adding doxycycline in sporulation medium post 3h in sporulation medium (S2 Fig). For each strain in each condition, minimum three biological replicates were used and approximately 1,000 cells were counted per replicate per condition for estimation of sporulation efficiency. The means and variances were tested for significance using one-way ANOVA followed by Tukey’s multiple comparisons test (Prism, Graphpad Software Inc.). Statistical significance was determined at P < 0.05.
Transcriptional profiling, normalization, smoothing and baseline transformation
Temporal transcriptome profiling was performed for the sporulating yeast cells at 0h, 30m, 45m, 1h10m, 1h40m, 2h30m, 3h50m, 5h40m and 8h30m (logarithmic time-series) in the sporulation medium. For this, 100ml aliquots of the culture were pelleted and stored at -80°C. Transcriptome profiling was performed using the S. cerevisiae yeast tiling array (Affymetrix, Cat# 520055) as described previously [72]. Time-series arrays of M and S strains in sporulation were normalized by vsn (S1 Text (Section 3), S3 Fig) [73].
Using log2 transformed expression values, after normalization (S2 Table), the expression profiles of all transcripts of S and M strains were made continuous over time using locfit [74] with the bandwidth parameter ‘h’ optimized at 1.21 (S1 Text (Section 4), S4 Fig, S3 Table). A baseline transformation for each transcript, after smoothing, was done by subtracting each time point value from t = 0h (t0).

To compare the sporulation genes (obtained from Deutschbauer et al. [25]) between the M and S strains, their expression in the two strains were tested using 1,000 permutations of Wilcoxon test on an equal number of randomly selected genes (S6 Fig). R scripts used for the analyses are given in the S3 File.
Identification of differentially expressed genes using EDGE
To identify differentially expressed genes (after removing tRNAs, snRNAs and transcripts from terminal repeats) between the two strains, the temporal expression profiles of each transcript was compared using the method implemented in the EDGE (Extraction of Differential Gene Expression) software [75]. One thousand permutations were done to calculate the null distribution with a random number seed. EDGE analysis identified transcripts of 862 significant differentially expressed genes across time (10% FDR, S4 Table). Within these 862 genes, a subset of differentially expressed transcription factors and differentially expressed targets of all the transcription factors (obtained from the YEASTRACT database, [76] were selected. This subset of 727 genes was used for further analysis.
Clustering of identified genes using TimeClust
The 727 differentially expressed genes were clustered according to their temporal expression patterns using time abstraction method implemented in the TimeClust software [77]. The smoothened and baseline transformed expression data of the 8 sporulation time-points was analysed with window span parameter set at 3. An absolute expression change of 0.1 was considered as a change. This clustering method was applied on the expression data separately for the two strains resulting in six and seven clusters in the M and S strains, respectively (S5 Table). The gene lists of the M and S strains for the Cluster I, consisting of early expressing genes, were compared. For the genes unique to the M strain in this cluster (S6 Table), the transcription factors regulating them were extracted using the YEASTRACT database (S7 Table) [76].
Estimation of oxygen flux to evaluate mitochondrial function
After 1h in sporulation, 5 x 10⁶ cells from each of the three biological replicates were used for the assay. Oxygen consumption flux was determined, in total volume of 2.1ml sporulation medium at 30°C with 500 rpm, using OROBOROS O2k high-resolution respirometer (OROBOROS Instruments Corp., Innsbruck, Austria). Data acquisition and calculation of oxygen flux was done according to the manufacturer’s instruction in DatLab software. Unpaired Student’s t-test (Prism, Graphpad Software Inc.) was performed for comparing differences between the means of the two strains. Statistical significance was determined at P < 0.05.
Supporting Information
Zdroje
1. Burga A, Lehner B. Predicting phenotypic variation from genotypes, phenotypes and a combination of the two. Curr Opin Biotechnol. 2013; 24 : 803–809. doi: 10.1016/j.copbio.2013.03.004 23540420
2. Lehner B. Genotype to phenotype: lessons from model organisms for human genetics. Nat Rev Genet. 2013; 14 : 168–178. doi: 10.1038/nrg3404 23358379
3. Fay JC The molecular basis of phenotypic variation in yeast. Curr Opin Genet Dev. 2013; 23 : 672–677. doi: 10.1016/j.gde.2013.10.005 24269094
4. Carter H, Hofree M, Ideker T. Genotype to phenotype via network analysis. Curr Opin Genet Dev. 2013; 23 : 611–621. doi: 10.1016/j.gde.2013.10.003 24238873
5. van der Sijde MR, Ng A, Fu J. Systems genetics: From GWAS to disease pathways. Biochim Biophys Acta. 2014; 1842 : 1903–1909. doi: 10.1016/j.bbadis.2014.04.025 24798234
6. Battle A, Montgomery SB Determining causality and consequence of expression quantitative trait loci. Hum Genet. 2014; 133 : 727–735. doi: 10.1007/s00439-014-1446-0 24770875
7. Smith EN, Kruglyak L Gene-environment interaction in yeast gene expression. PLoS Biol. 2008; 6: e83. doi: 10.1371/journal.pbio.0060083 18416601
8. Cookson W, Liang L, Abecasis G, Moffatt M, Lathrop M. Mapping complex disease traits with global gene expression. Nat Rev Genet. 2009; 10 : 184–194. doi: 10.1038/nrg2537 19223927
9. Gagneur J, Stegle O, Zhu C, Jakob P, Tekkedil MM, Aiyar RS, et al., Genotype-environment interactions reveal causal pathways that mediate genetic effects on phenotype. PLoS Genet. 2013; 9: e1003803. doi: 10.1371/journal.pgen.1003803 24068968
10. Bar-Joseph Z, Gitter A, Simon I. Studying and modelling dynamic biological processes using time-series gene expression data. Nat Rev Genet. 2012; 13 : 552–564. doi: 10.1038/nrg3244 22805708
11. Gerrits A, Li Y, Tesson BM, Bystrykh LV, Weersing E, Ausema A, Dontje B, et al. Expression quantitative trait loci are highly sensitive to cellular differentiation state. PLoS Genet. 2009; 5: e1000692. doi: 10.1371/journal.pgen.1000692 19834560
12. Montgomery SB, Dermitzakis ET. From expression QTLs to personalized transcriptomics. Nat Rev Genet. 2011; 12 : 277–282. doi: 10.1038/nrg2969 21386863
13. Francesconi M, Lehner B. The effects of genetic variation on gene expression dynamics during development. Mol Syst Biol. 2013; 505 : 208–211.
14. Kim HS, Huh J, Fay JC. Dissecting the pleiotropic consequences of a quantitative trait nucleotide. FEMS Yeast Res. 2009; 9 : 713–722. doi: 10.1111/j.1567-1364.2009.00516.x 19456872
15. Deutschbauer AM, Davis RW. Quantitative trait loci mapped to single-nucleotide resolution in yeast. Nat Genet. 2005; 37 : 1333–1340. 16273108
16. Lee S - I, Dudley AM, Drubin D, Silver PA, Krogan NJ, Pe'er D, et al. Learning a prior on regulatory potential from eQTL data. PLoS Genet. 2009; 5: e1000358. doi: 10.1371/journal.pgen.1000358 19180192
17. Steinmetz LM, Sinha H, Richards DR, Spiegelman JI, Oefner PJ, McCusker JH, et al. Dissecting the architecture of a quantitative trait locus in yeast. Nature. 2002; 416 : 326–330. 11907579
18. Sinha H, Nicholson BP, Steinmetz LM, McCusker JH. Complex genetic interactions in a quantitative trait locus. PLoS Genet. 2006; 2: e13. 16462944
19. Demogines A, Smith E, Kruglyak L, Alani E. Identification and dissection of a complex DNA repair sensitivity phenotype in Baker's yeast. PLoS Genet. 2008; 4: e1000123. doi: 10.1371/journal.pgen.1000123 18617998
20. Dimitrov LN, Brem RB, Kruglyak L, Gottschling DE. Polymorphisms in multiple genes contribute to the spontaneous mitochondrial genome instability of Saccharomyces cerevisiae S288c strains. Genetics. 2009; 183 : 365–383. doi: 10.1534/genetics.109.104497 19581448
21. Swinnen S, Schaerlaekens K, Pais T, Claesen J, Hubmann G, Yang Y, et al. Identification of novel causative genes determining the complex trait of high ethanol tolerance in yeast using pooled-segregant whole-genome sequence analysis. Genome Res. 2012; 22 : 975–984. doi: 10.1101/gr.131698.111 22399573
22. Lewis JA, Broman AT, Will J, Gasch AP. Genetic architecture of ethanol-responsive transcriptome variation in Saccharomyces cerevisiae strains. Genetics. 2014; 198 : 369–382 doi: 10.1534/genetics.114.167429 24970865
23. van Werven FJ, Amon A. Regulation of entry into gametogenesis. Philos Trans R Soc B Biol Sci. 2011; 366 : 3521–3531. doi: 10.1098/rstb.2011.0081 22084379
24. Neiman AM. Sporulation in the budding yeast Saccharomyces cerevisiae. Genetics. 2011; 189 : 737–765. doi: 10.1534/genetics.111.127126 22084423
25. Deutschbauer AM, Williams RM, Chu AM, Davis RW. Parallel phenotypic analysis of sporulation and postgermination growth in Saccharomyces cerevisiae. Proc Natl Acad Sci U S A. 2002; 99 : 15530–15535. 12432101
26. Lorenz K, Cohen BA. Causal variation in yeast sporulation tends to reside in a pathway bottleneck. PLoS Genet. 2014; 10: e1004634. doi: 10.1371/journal.pgen.1004634 25211152
27. Honigberg SM. Signal pathway integration in the switch from the mitotic cell cycle to meiosis in yeast. J Cell Sci. 2003; 116 : 2137–2147. 12730290
28. Kassir Y, Granot D, Simchen G. IME1, a positive regulator gene of meiosis in S. cerevisiae. Cell. 1988; 52 : 853–862. 3280136
29. Tsuchiya D, Yang Y, Lacefield S. Positive feedback of NDT80 expression ensures irreversible meiotic commitment in budding yeast. PLoS Genet. 2014; 10: e1004398. doi: 10.1371/journal.pgen.1004398 24901499
30. Mitchell AP. Control of meiotic gene expression in Saccharomyces cerevisiae. Microbiol Rev. 1994; 58 : 56–70. 8177171
31. Sudarsanam P, Cohen BA. Single nucleotide variants in transcription factors associate more tightly with phenotype than with gene expression. PLoS Genet. 2014; 10: e1004325. doi: 10.1371/journal.pgen.1004325 24784239
32. Neiman AM. Ascospore formation in the yeast Saccharomyces cerevisiae. Microbiol Mol Biol Rev. 2005; 69 : 565–584. 16339736
33. Liu Z, Butow RA. Mitochondrial retrograde signaling. Ann Rev Genet. 2006; 40 : 159–185. 16771627
34. Broach JR. Nutritional control of growth and development in yeast. Genetics. 2012; 192 : 73–105. doi: 10.1534/genetics.111.135731 22964838
35. Ray D, Ye P. Characterization of the metabolic requirements in yeast meiosis. PLoS ONE. 2013; 8: e63707. doi: 10.1371/journal.pone.0063707 23675502
36. Liao X, Butow RA. RTG1 and RTG2: two yeast genes required for a novel path of communication from mitochondria to the nucleus. Cell. 1993; 72 : 61–71. 8422683
37. Scott S, Abul-Hamd AT, Cooper TG. Roles of the Dal82p domains in allophanate/oxalurate-dependent gene expression in Saccharomyces cerevisiae. J Biol Chem. 2000; 275 : 30886–30893. 10906145
38. Jia Y, Rothermel B, Thornton J, Butow RA. A basic helix-loop-helix-leucine zipper transcription complex in yeast functions in a signaling pathway from mitochondria to the nucleus. Mol Cell Biol. 1997; 17 : 1110–1117. 9032238
39. Rabitsch KP, Tóth A, Gálová M, Schleiffer A, Schaffner G, Aigner E, et al. A screen for genes required for meiosis and spore formation based on whole-genome expression. Curr Biol. 2001; 11 : 1001–1009. 11470404
40. Primig M, Williams RM, Winzeler EA, Tevzadze GG, Conway AR, Hwang SY, et al. The core meiotic transcriptome in budding yeasts. Nat Genet. 2000; 26 : 415–423. 11101837
41. Sekito T, Thornton J, Butow RA. Mitochondria-to-nuclear signaling is regulated by the subcellular localization of the transcription factors Rtg1p and Rtg3p. Mol Biol Cell. 2000; 11 : 2103–2115. 10848632
42. Jambhekar A, Amon A. Control of meiosis by respiration. Curr Biol. 2008; 18 : 969–975. doi: 10.1016/j.cub.2008.05.047 18595705
43. Fazlollahi M, Lee E, Muroff I, Lu XJ, Gomez-Alcala P, Causton HC, et al. Harnessing natural sequence variation to dissect post-transcriptional regulatory networks in yeast. G3 (Bethesda). 2014; 4 : 1539–1553. doi: 10.1534/g3.114.012039 24938291
44. Gerber AP, Herschlag D, Brown PO. Extensive association of functionally and cytotopically related mRNAs with Puf family RNA-binding proteins in yeast. PLoS Biol. 2004; 2: e79. 15024427
45. Civelek M, Lusis AJ. Systems genetics approaches to understand complex traits. Nat Rev Genet. 2014; 15 : 34–48. doi: 10.1038/nrg3575 24296534
46. Westra HJ, Franke L. From genome to function by studying eQTLs. Biochim Biophys Acta. 2014; 1842 : 1896–1902. doi: 10.1016/j.bbadis.2014.04.024 24798236
47. Saint Pierre A, Génin E How important are rare variants in common disease? Brief Funct Genomics. 2014; 13 : 353–361. doi: 10.1093/bfgp/elu025 25005607
48. Barbour JA, Turner N. Mitochondrial stress signaling promotes cellular adaptations. Int J Cell Biol. 2014; 2014 : 1–12.
49. Chen XJ, Wang X, Kaufman BA, Butow RA. Aconitase couples metabolic regulation to mitochondrial DNA maintenance. Science. 2005; 307 : 714–717. 15692048
50. May-Panloup P, Chrétien MF, Jacques C, Vasseur C, Malthièry Y, Reynier P. Low oocyte mitochondrial DNA content in ovarian insufficiency. Hum Reprod. 2005; 20 : 593–597. 15608038
51. Starovoytova AN, Sorokin MI, Sokolov SS, Severin FF, Knorre DA. Mitochondrial signaling in Saccharomyces cerevisiae pseudohyphae formation induced by butanol. FEMS Yeast Res. 2013; 13 : 367–374. doi: 10.1111/1567-1364.12039 23448552
52. Liti G, Carter DM, Moses AM, Warringer J, Parts L, James SA, et al. Population genomics of domestic and wild yeasts. Nature. 2009; 458 : 337–341. doi: 10.1038/nature07743 19212322
53. Enyenihi AH, Saunders WS. Large-scale functional genomic analysis of sporulation and meiosis in Saccharomyces cerevisiae. Genetics. 2003; 163 : 47–54. 12586695
54. Chu S, DeRisi J, Eisen M, Mulholland J, Botstein D, Brown PO, et al. The transcriptional program of sporulation in budding yeast. Science. 1998; 282 : 699–705. 9784122
55. Mortimer RK, Johnston JR. Genealogy of principal strains of the yeast genetic stock center. Genetics. 1986; 113 : 35–43. 3519363
56. Anderson JB, Funt J, Thompson DA, Prabhu S, Socha A, Sirjusingh C, et al. Determinants of divergent adaptation and Dobzhansky-Muller interaction in experimental yeast populations. Curr Biol. 2010; 20 : 1383–1388. doi: 10.1016/j.cub.2010.06.022 20637622
57. Warringer J, Zörgö E, Cubillos FA, Zia A, Gjuvsland A, Simpson JT, et al. Trait variation in yeast is defined by population history. PLoS Genet. 2011; 7: e1002111. doi: 10.1371/journal.pgen.1002111 21698134
58. Zhu J, Zhang B, Smith EN, Drees B, Brem RB, Kruglyak L, et al. Integrating large-scale functional genomic data to dissect the complexity of yeast regulatory networks. Nat Genet. 2008; 40 : 854–861. doi: 10.1038/ng.167 18552845
59. Saint-Georges Y, Garcia M, Delaveau T, Jourdren L, Le Crom S, Lemoine S, et al. Yeast mitochondrial biogenesis: a role for the PUF RNA-binding protein Puf3p in mRNA localization. PLoS ONE. 2008; 3: e2293. doi: 10.1371/journal.pone.0002293 18523582
60. Devaux F, Lelandais G, Garcia M, Goussard S, Jacq C. Posttranscriptional control of mitochondrial biogenesis: spatio-temporal regulation of the protein import process. FEBS Letters. 2010; 584 : 4273–4279. doi: 10.1016/j.febslet.2010.09.030 20875412
61. Tadauchi T, Inada T, Matsumoto K, Irie K. Posttranscriptional regulation of HO expression by the Mkt1-Pbp1 complex. Mol Cell Biol. 2004; 24 : 3670–3681. 15082763
62. Singh A, Minia I, Droll D, Fadda A, Clayton C, Erben E. Trypanosome MKT1 and the RNA-binding protein ZC3H11: interactions and potential roles in post-transcriptional regulatory networks. Nucleic Acids Res. 2014; 42 : 4652–4668. doi: 10.1093/nar/gkt1416 24470144
63. Kedersha N, Anderson P. Mammalian stress granules and processing bodies. Methods Enzymol. 2007; 431 : 61–81 17923231
64. Swetloff A, Conne B, Huarte J, Pitetti JL, Nef S, Vassalli JD. Dcp1-bodies in mouse oocytes. Mol Biol Cell. 2009; 20 : 4951–4961. doi: 10.1091/mbc.E09-02-0123 19812249
65. Buchan JR, Muhlrad D, Parker R. P-bodies promote stress granule assembly in Saccharomyces cerevisiae. J Cell Biol. 2008; 183 : 441–455. doi: 10.1083/jcb.200807043 18981231
66. Goldstein AL, McCusker JH. Three new dominant drug resistance cassettes for gene disruption in Saccharomyces cerevisiae. Yeast. 1999; 15 : 1541–1553. 10514571
67. Gietz RD, Woods RA. Transformation of yeast by lithium acetate/single-stranded carrier DNA/polyethylene glycol method. Methods Enzymol. 2002; 350 : 87–96. 12073338
68. Tomar P, Bhatia A, Ramdas S, Diao L, Bhanot G, Sinha H. Sporulation genes associated with sporulation efficiency in natural isolates of yeast. PLoS ONE. 2013; 8: e69765. doi: 10.1371/journal.pone.0069765 23874994
69. Lardenois A, Liu Y, Walther T, Chalmel F, Evrard B, Granovskaia M, et al. Execution of the meiotic noncoding RNA expression program and the onset of gametogenesis in yeast require the conserved exosome subunit Rrp6. Proc Natl Acad Sci U S A. 2011; 108 : 1058–1063. doi: 10.1073/pnas.1016459108 21149693
70. Eastwood MD, Cheung SWT, Lee KY, Moffat J, Meneghini MD Developmentally programmed nuclear destruction during yeast gametogenesis. Dev Cell. 2012; 23 : 35–44. doi: 10.1016/j.devcel.2012.05.005 22727375
71. Bellí G, Garí E, Aldea M, Herrero E. Functional analysis of yeast essential genes using a promoter-substitution cassette and the tetracycline-regulatable dual expression system. Yeast. 1998; 14 : 1127–1138. 9778798
72. Xu Z, Wei W, Gagneur J, Clauder-Münster S, Smolik M, Huber W, et al. Antisense expression increases gene expression variability and locus interdependency. Mol Syst Biol. 2011; 7 : 1–10.
73. Huber W, von Heydebreck A, Sültmann H, Poustka A, Vingron M. Variance stabilization applied to microarray data calibration and to the quantification of differential expression. Bioinformatics. 2002; 18 Suppl 1: S96–S104. 12169536
74. Loader C. Locfit: Local regression, likelihood and density estimation. R package version 1.5. 2007.
75. Leek JT, Monsen E, Dabney AR, Storey JD. EDGE: extraction and analysis of differential gene expression. Bioinformatics. 2006; 22 : 507–508. 16357033
76. Teixeira MC, Monteiro PT, Guerreiro JF, Gonçalves JP, Mira NP, dos Santos SC, et al. The YEASTRACT database: an upgraded information system for the analysis of gene and genomic transcription regulation in Saccharomyces cerevisiae. Nucleic Acids Res. 2014; 42: D161–D166. doi: 10.1093/nar/gkt1015 24170807
77. Magni P, Ferrazzi F, Sacchi L, Bellazzi R. TimeClust: a clustering tool for gene expression time series. Bioinformatics. 2008; 24 : 430–432. 18065427
Štítky
Genetika Reprodukční medicínaČlánek vyšel v časopise
PLOS Genetics
2015 Číslo 6
Nejčtenější v tomto čísle
- Non-reciprocal Interspecies Hybridization Barriers in the Capsella Genus Are Established in the Endosperm
- Translational Upregulation of an Individual p21 Transcript Variant by GCN2 Regulates Cell Proliferation and Survival under Nutrient Stress
- Exome Sequencing of Phenotypic Extremes Identifies and as Interacting Modifiers of Chronic Infection in Cystic Fibrosis
- The Human Blood Metabolome-Transcriptome Interface