
The Yeast GSK-3 Homologue Mck1 Is a Key Controller of Quiescence Entry and Chronological Lifespan
The vast majority of eukaryotic cells exist in a non-proliferating state known as G0. However, how cells transit into, and survive during, the G0 state is poorly understood. Dysregulation of the G0 state leads to age-related diseases such as Alzheimer’s or cancers. We have revealed that the yeast Mck1 and Rim15 kinases, which function downstream of the PKA and/or TOR signaling pathways, coordinate cell cycle progression, cell size homeostasis, and the acquisition of a variety of G0-specific characteristics during the transition into stationary phase. Failure of this coordination compromises the ability of early stationary-phase cells to exit from quiescence and severely shortens their chronological lifespan. Further genetic analyses suggest that the nutrient sensor Ras2 may antagonize G0 entry via at least two pathways, one through the negative regulation of the G0-specific effectors (Mck1 and Rim15) and the other possibly involving its functions in promoting respiratory growth, a phenotype also intricately modulated by Mck1 and Rim15. As Ras2 and Rim15 have homolog in both insects and/or mammals, the identification of the GSK-3 homologue Mck1 and the characterisation of its relationship with Rim15 and Ras2 in G0 entry could provide important clues to the regulation of these processes in more complex organisms.
Published in the journal:
. PLoS Genet 11(6): e32767. doi:10.1371/journal.pgen.1005282
Category:
Research Article
doi:
https://doi.org/10.1371/journal.pgen.1005282
Summary
The vast majority of eukaryotic cells exist in a non-proliferating state known as G0. However, how cells transit into, and survive during, the G0 state is poorly understood. Dysregulation of the G0 state leads to age-related diseases such as Alzheimer’s or cancers. We have revealed that the yeast Mck1 and Rim15 kinases, which function downstream of the PKA and/or TOR signaling pathways, coordinate cell cycle progression, cell size homeostasis, and the acquisition of a variety of G0-specific characteristics during the transition into stationary phase. Failure of this coordination compromises the ability of early stationary-phase cells to exit from quiescence and severely shortens their chronological lifespan. Further genetic analyses suggest that the nutrient sensor Ras2 may antagonize G0 entry via at least two pathways, one through the negative regulation of the G0-specific effectors (Mck1 and Rim15) and the other possibly involving its functions in promoting respiratory growth, a phenotype also intricately modulated by Mck1 and Rim15. As Ras2 and Rim15 have homolog in both insects and/or mammals, the identification of the GSK-3 homologue Mck1 and the characterisation of its relationship with Rim15 and Ras2 in G0 entry could provide important clues to the regulation of these processes in more complex organisms.
Introduction
Research into the biology of aging in different model organisms has identified several signaling pathways affecting lifespan. Among them, the partially conserved insulin/IGF-1 signaling pathway and the conserved TOR pathway regulate lifespan in organisms from insects to mammals [1–2]. Multiple TORC1-regulated processes, including autophagy, stress resistance, and mitochondrial function, contribute to lifespan extension by TORC1 inhibition [2–3]. In budding yeast, transition into quiescence and extension of chronological lifespan (CLS, defined as the period of time that non-dividing cells remain viable in the stationary phase, SP), is regulated by the TOR and PKA signaling pathway [4–5]. Compromising TOR [6–7] or deletion of the Sch9 kinase [8], a downstream effector of TORC1 [9], leads to CLS extension. Similarly, inactivation of Ras2, which promotes Cyr1 and PKA function, extends yeast life span [10]. CLS extension by reduced TOR/Sch9 signaling or decreased PKA activity is dependent on the activation of the stress response, which is mediated by the PAS kinase Rim15 and its downstream effectors, Msn2/Msn4 (Msn2/4) and Gis1 [11]. Recently, Shadel and colleagues have revealed that enhanced mitochondrial respiration above a certain threshold is required to promote cell survival during SP [12]. Increased respiration in tor1∆ cells contributes to CLS extension through reactive oxygen species, which act as an hormetic signal to activate the stress response dependent on Msn2/4 and Gis1, and promote sub-telomeric chromatin silencing via the DNA damage response pathway [13–14]. These studies support the view that, besides other factors, the stress response induced via the inhibition of the nutrient signaling pathways is a major process involved in the prolongation of CLS [15].
The stress response mediated by Msn2/4 and Gis1, activated in cells starved for glucose or treated with rapamycin, is dependent on Rim15 [16]. The Rim15 kinase, via the paralogous Igo1 and Igo2 proteins, protects newly expressed mRNAs from decapping and degradation [17–18] and also preserves Gis1 in a phosphorylated (active) state by inhibiting PP2ACdc55 phosphatase activity [19]. Our recent studies indicated that regulation of the starvation-induced stress response involves a more complex signaling network than previously thought. Firstly, Msn2/4 - and Gis1-activated gene expression is negatively modulated by both the proteasome and the TOR signaling pathways [20–21]. Like Msn2 [22], Gis1 is subjected to partial cleavage mediated by the proteasome [20,23]. Secondly, when the function of the proteasome is inhibited, Msn2/4 - and Gis1-dependent gene expression induced by TORC1 inhibition is no longer strictly dependent on Rim15 [24]. Yak1 (the yeast homolog of mammalian DYRKs) was identified as the kinase, acting in pathways parallel or compensatory to that of Rim15, that activates gene expression dependent on Msn2/4 and Gis1 [21]. Moreover, deletion of both RIM15 and YAK1 did not abolish such expression, suggesting that other genes may act to promote the stress response in TORC1-inhibited or starved yeast cells. Our examination of this hypothesis has led to the finding that the yeast GSK-3 homologue Mck1 acts in parallel to Rim15 to control the acquisition of a variety of quiescence-related characteristics; these include starvation-induced gene expression, stress resistance, accumulation of storage carbohydrates and chronological life span. Mck1 promotes cell separation and, together with Rim15, controls the cell size after the diauxic shift. Further genetic analyses suggest the nutrient sensor Ras2 may prevent G0 entry via at least two pathways, one through the negative regulation of G0-related effectors, such as Mck1 and Rim15, and the other likely involving its functions in promoting respiratory growth, a phenotype also modulated by Mck1 and Rim15. To our knowledge, this is the first demonstration that transition-phase cell cycle, cell size, and the acquisition of different G0-specific features are co-ordinately regulated in order to ensure long-term survival. Our findings provide novel insight into how G0 entry is controlled by the nutrient sensors and their downstream effectors.
Results
Mck1 is necessary to promote starvation-induced gene expression
To facilitate the identification of other regulators of starvation-induced gene expression, two cassettes were constructed in which the expression of RFP (Red Fluorescent Protein) is regulated by the promoter of SSA3 (harbouring the PDS motif targeted by Gis1; [25]) and that of the fusion protein HSP12-VFP (Venus Fluorescent Protein) controlled by the promoter of HSP12 (bearing the STRE element targeted by Msn2/4, [26]). To verify the utility of the two reporters, their expression levels were first monitored in wild-type (WT), msn2/4∆, gis1∆, and gis1∆msn2/4∆ cells using a plate reader. pHSP12-HSP12-VFP expression was evident in the late exponential phase and reached a maximum before early stationary phase (S1 Fig). In contrast, the expression of pSSA3-RFP was activated at the late exponential phase and gradually increased during the transition into stationary phase (S1 Fig). Maximum Expression of pHSP12-HSP12-VFP (at ~20h) was significantly reduced in the msn2/4∆ cells and only moderately decreased in the gis1∆ deletant (Fig 1A). In comparison, pSSA3-RFP expression (at ~48h) was substantially reduced in gis1∆ cells and, to a lesser degree, in the msn2/4∆ mutants (Fig 1A). In the gis1∆msn2/4∆ triple mutant, the expression of pHSP12-HSP12-VFP and that of pSSA3-RFP was nearly abolished (Fig 1A). These data indicated that the two expression cassettes are suitable for monitoring starvation-induced gene expression mediated by Msn2/4 and Gis1.

Expression from the pSSA3-RFP and pHSP12-HSP12-VFP reporters was assayed following transformation into a mini-library of 272 mutants each carrying the deletion of a non-essential gene encoding a signaling molecule in S. cerevisiae (S1 Table). Mck1 was identified as being required to activate the expression of both reporters using a plate reader (Fig 1B). MCK1 encodes a dual-specificity protein kinase, related to mammalian glycogen synthase kinases in the GSK-3 family, which has previously been shown to activate gene expression mediated by Msn2 in S. cerevisiae [27]. Among the four GSK-3 family kinases encoded by the yeast genome, only deletion of MCK1 significantly reduced the expression of both the VFP and RFP reporters, whereas deletion of YGK3, RIM11 or MRK1 had little effect (Fig 1B).
Mck1 and Rim15 activate starvation-induced gene expression, stress resistance, and accumulation of storage carbohydrates via parallel pathways
The Rim15 kinase was previously shown to orchestrate G0 entry [16]. To reveal the functions of Mck1 and its relationship with Rim15 in the regulation of G0 entry, single and double deletions of RIM15 and MCK1 were constructed in the pdr5∆ deletion background. PDR5 was deleted in each of the wild-type and mutant strains in order to sensitise cells to the proteasome inhibitor MG132 [28]. The levels of pHSP12-HSP12-VFP and pSSA3-RFP were monitored in cells treated with either the drug vehicle (MG132-) or MG132 (MG132+). In comparison to that seen in the single kinase mutants, the level of pHSP12-HSP12-VFP was decreased dramatically (Fig 2A) and that of pSSA3-RFP was completely abolished in the rim15∆mck1∆ double mutants (Fig 2B). Compromising the function of the proteasome with MG132 enhanced the expression of both reporters in the WT cells (red bars in Fig 2A and 2B). Deletion of MSN2/4 and GIS1 abolished the expression of pHSP12-HSP12-VFP but not that of pSSA3-RFP, indicating that other factors sensitive to proteasome function may be involved in regulating SSA3 expression. As compared to the single kinase deletants, MG132-induced expression of the two reporters was significantly reduced in the rim15∆mck1∆ mutants (red bars, Fig 2A and 2B). These data suggest that Mck1 acts in parallel to Rim15 to activate Msn2/4 - and Gis1-dpenendent gene expression.

To further examine the physiological implications of the above findings, the stress resistance conferred by cells at the transition phases (grown in YPD for 1 and 3 days) was monitored. The gis1∆msn2/4∆ triple mutant cells were highly sensitive to heat shock (both day 1 and day 3 cultures, Fig 2C) and only moderately sensitive to oxidative stress during early transition phase (day 1 culture, Fig 2C). The mck1∆ mutants displayed more severe defects than the rim15∆ cells in both heat tolerance and oxidative stress resistance (Fig 2C). The rim15∆mck1∆ double mutant recapitulates the heat shock sensitivity of the gis1∆msn2/4∆ triple mutant and exhibited greater sensitivity to oxidative stress than the latter (Fig 2C). These data further suggest that the two kinases may control the acquisition of stress resistance in parallel pathways during transition into stationary phase.
Storage carbohydrates are accumulated in yeast cells during the transition to stationary phase [29]. We determined the level of trehalose and glycogen in cells grown in YPD for 1 and 3 days. Deletion of both MSN2/4 and GIS1 led to a substantial decrease of trehalose and glycogen levels in transition-phase cells (Fig 2D and 2E), indicating that the accumulation of storage carbohydrates is in part the subject of transcriptional control. In the rim15∆mck1∆ mutants, the amount of trehalose or glycogen was lower than that in the single kinase mutants (Fig 2D and 2E), suggesting that Mck1 and Rim15 act in parallel to control the levels of both storage carbohydrates. The levels of trehalose and glycogen in the rim15∆mck1∆ mutants were significantly lower than those seen in the msn2/4∆gis1∆ triple mutants at 3 days of growth. The above data suggest that Mck1 and Rim15 have additional roles in determining the accumulation of storage carbohydrates other than by controlling the transcription mediated by Msn2/4 and Gis1.
MCK1 and RIM15 under the control of their endogenous promoters were also over-expressed in WT, rim15∆, mck1∆ and rim15∆mck1∆ cells using a multi-copy plasmid. Overexpression of MCK1 marginally increased the expression levels of the two reporters in WT cells, as compared to those seen in the same cells harbouring the empty vector (Fig 3A). In contrast, RIM15 overexpression seemed to significantly increase the levels of both reporters in WT cells (Fig 3A). Overexpression of MCK1 restored the expression levels of the two reporters in the mck1∆ mutants to that seen in WT cells but failed to rescue the reporter expression defects in the rim15∆ cells or in the rim15∆mck1∆ double mutants (Fig 3A). Similarly, RIM15 in a multi-copy plasmid largely suppressed the gene expression defects observed in the rim15∆ mutants but not those seen the mck1∆ deletants. RIM15 overexpression in the rim15∆ mutants or MCK1 overexpression in the mck1∆ cells did not fully restore the level of pSSA3-RFP to that seen in the WT cells, possibly due to the decreased plasmid stability in post-diauxic shift cells. These observations confirmed that Mck1 and Rim15 operated in parallel pathways to activate gene expression dependent on Msn2/4 and Gis1.

Trehalose and glycogen levels were also determined in WT and mutant cells harbouring the multi-copy plasmids. Cells were grown in buffered SC medium [30] for 2 days. As shown in Fig 3B, MCK1 and RIM15 overexpression restored trehalose and glycogen in the mck1∆ and rim15∆ mutants respectively close to their WT levels. Overexpression of RIM15 did not significantly increase the levels of trehalose and glycogen in the mck1∆ mutants (Fig 3B). MCK1 overexpression, however, partially suppressed the defects of storage carbohydrate accumulation seen in the rim15∆ cells (Fig 3B). The above cell cultures were grown on YPD medium containing H2O2 or subjected to heat shock before growing on YPD. RIM15 overexpression completely rescued the defects of heat or oxidative stress resistance seen in the rim15∆ cells but not those observed in the mck1∆ mutants (Fig 3C). MCK1 overexpression completely restored the stress resistance capabilities of the mck1∆ deletion cells and seemed to weakly suppress the stress resistance defects of the rim15∆ cells (Fig 3C). The above observations further supported that RIM15 and MCK1 act largely in parallel to promote the transition from exponential growth to stationary phase. However, it cannot be excluded that the two kinases may interact to regulate the accumulation of storage carbohydrates under certain conditions (see later results).
Mck1 and Rim15 regulate cell cycle progression and cell size during transition into SP
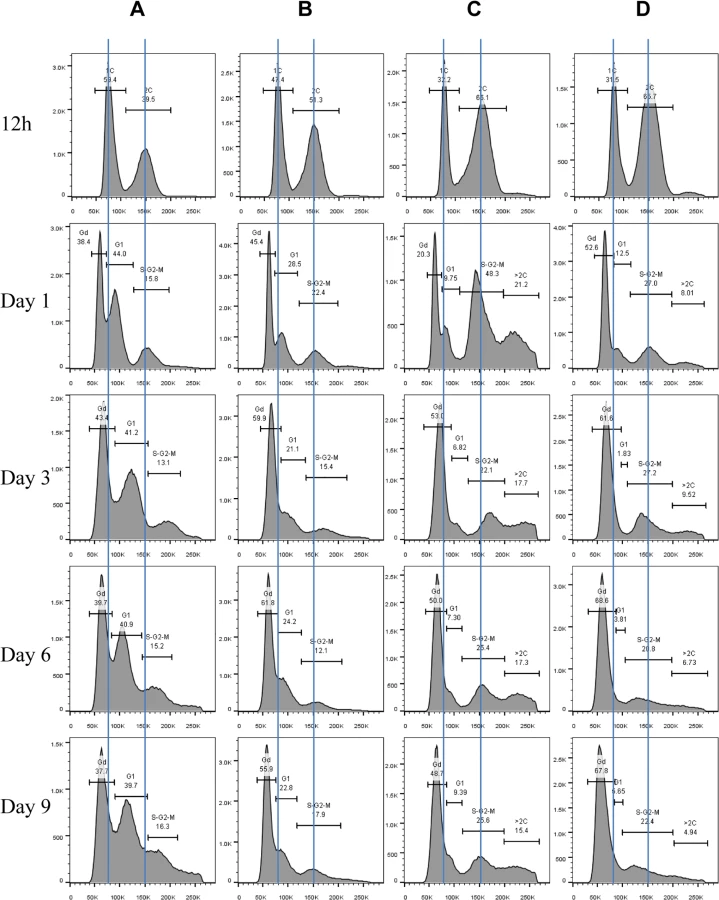
Exit from the mitotic cell cycle is one of the characteristics associated with entry into quiescence [4]. We wished to find out whether the Mck1 and Rim15 kinases also play a role in controlling cell cycle progression during the transition to stationary phase (defined as >7 days in YPD after diauxic shift). Hence the above WT, single - and double-mutant cells grown over the period of 9 days were fixed, sonicated and subjected to FACS and budding index analyses. Glucose was totally consumed by WT and mutant cells after 12 hours of growth in YPD. At 12 hours, the WT culture consisted of two distinct populations, labelled as 1C and 2C in Fig 4A. During the post-diauxic shift phase, three distinct populations, labelled Gd, G1 and S/G2/M in Fig 4A, were accumulated in wild-type cell cultures. The Gd cells display less staining by Sytox green than 1C cells at diauxic shift. G1 cells exhibit slightly stronger staining signals than 1C cells, whereas S/G2/M cells have similar DNA fluorescence to that of 2C cells (Fig 4A). Gd cells are significantly smaller than G1 or S/G2/M cells, as revealed by the forward scatter (FSC) of the cytometer (Fig 5A and 5B). In contrast, G1 and S/G2/M cells have a similar average size and similar size distributions (Fig 5A and 5B).

Imaging the cells (day 1 sample) also revealed three distinct cell types: small cells without buds, large cells without buds, and large cells with a very small bud or with nuclear DNA-containing buds (Fig 5C), representing Gd, G1 and S/G2/M populations respectively (Fig 5A and 5B). Average Sytox staining signals produced by Gd cells marginally increased during the transition to SP (Fig 4A). In contrast, staining signals generated by G1 cells increased dramatically until day 3 and then decreased slightly at the late stages of the transition (compare 12h, day 1, day 3 and day 6 samples in Fig 4A). A similar increase and decrease was seen for S/G2/M cells after day 1 (Fig 4A). The average size of Gd, G1 and S/G2/M cells was similarly increased during early transition (compare day 1 and day 3 samples in Fig 5D) and remained unchanged during late transition (compare day 3 and day 6 samples in Fig 5D). The budding index was decreased from ~40% at the diauxic shift (12h) to ~10% at day 6 (Fig 6A). Similar FACS analyses of post-diauxic shift cell cultures from a different genetic background [31] also revealed three cell types, with the small cells displaying less DNA fluorescence than 1C, and their size increasing during the transition into SP. Although it is not clear what caused the difference of DNA fluorescence between small Gd and large G1 cells or among the G1 and S/G2/M cells during the transition (see Discussion), the above findings do confirm that cultures in transition phase exhibit an heterogeneous and dynamic structure and arrest predominantly in the G1 phase of the cell cycle [31]. The Gd and G1 cells were also sorted and subjected to calcofluor white staining. None of the small Gd cells (~200) has a bud scar (Fig 5E). In contrast, around 30% of the G1 cells (~200) were found to have one or more bud scars (Fig 5E). Less than 2% of the G1 cells are budded. These data indicated that the Gd population is composed of small daughter cells, whereas the G1 population represents predominantly daughter cells which have grown in size and old mother cells.

FACS analysis of exponential phase culture revealed similar distributions of 1C and 2C cells in the WT, rim15∆, mck1∆ and rim15∆mck1∆ cultures (S2 Fig). At the diauxic shift, the ratio of 2C to 1C populations in the rim15∆, mck1∆ or rim15∆mck1∆ cultures was significantly higher than that seen in WT culture (12h samples in Fig 4A, 4B, 4C and 4D). During the post-diauxic phase, the ratio of G1 to Gd cells was dramatically decreased in the rim15∆ culture as compared to that of the WT (compare day 1, day 3 and day 6 samples between Fig 4B and 4A). Enhanced Sytox staining of G1 or S/G2/M cells seen in wild-type culture was also significantly reduced in the rim15∆ culture. The fraction of S/G2/M population in the rim15∆ culture, however, was only slightly higher at day 1 and dropped to the level similar to that in the WT culture thereafter (compare all samples between Fig 4B and 4A). These data indicate that deletion of RIM15 produces G1 cells which are less distinguishable from the Gd population by FACS than those in the WT culture. At the diauxic shift (12h), the rim15∆ mutant cells displayed similar average sizes and size distributions to those WT cells (Fig 6E). During the post-diauxic phase, the average size of Gd or G1 and S/G2/M cells in the rim15∆ culture was smaller than those in the WT culture (Fig 6F). These data suggest that Rim15 is necessary to promote cell growth to transit from Gd (small) to G1 (large) during the post-diauxic shift phase.
Strikingly, the proportion of both Gd and G1 cells in the mck1∆ culture was severely decreased during the early transition phase (12h to day 1 in Fig 4C). In contrast, a significant portion of the mck1∆ cells (labeled >2C) contained three times as much DNA as the Gd cells (day 1 sample in Fig 4C). The percentage of cells in this population decreased initially but remained at about 15% of the culture during the late transition (day 3 to day 9 in Fig 4C). Correspondingly, the budding index of mck1∆ cells increased from ~40% at the diauxic shift to ~70% at day 1, decreasing to, and remaining at, ~40% during later transition (Fig 6A). About one third of the mck1∆ budding cells have two buds, one or both of which have acquired nuclear DNA (Fig 6B). Multi-budded cells are hallmarks of cytokinesis or cell separation defects. To distinguish between the two possibilities, we treated the mck1∆ cells (grown in YPD for 1 day) with zymolyase. Similarly treated were the aim44∆ and the ace2∆ mutant cells, which have been shown to have cytokinesis and cell separation defects respectively [32–33]. Zymolyase treatment led to a significant decrease of multi-budded cells in the mck1∆ population, similar to that observed for the ace2∆ culture (Fig 6C). The percentage of multi-budded aim44∆ cells remained unchanged (Fig 6C). This suggested that the mck1∆ mutants have defects in cell separation during the transition to SP. Around 90% of the multi-budded cells (~130) displayed glucan staining at one or both bud necks (Fig 6D). Towards the end of cytokinesis, two secondary septa are formed at both sides of the primary septum and are made of 1,3-β-D-glucans and mannoproteins [34]. Glucan staining at the bud neck further indicated that the multi-budded mck1∆ cells were caused by defects in cell separation.
At the diauxic shift (12h), the mck1∆ and the rim15∆mck1∆ double mutants, like the rim15∆ mutants, also displayed similar average sizes and size distributions to WT cells (Fig 6E). During the post-diauxic phase, the average size of Gd or G1 and S/G2/M cells in the mck1∆ culture was similar to those in the rim15∆ culture but smaller than the same cells in the WT culture (Fig 6F). Further, deletion of RIM15 in the mck1∆ mutant led to the complete disappearance of G1 cells from the FACS profiles (compare day 1 with later samples in Fig 4D) and indistinguishable Gd and S/G2/M cells in terms of size (Fig 6F), indicating that Mck1 regulates the size of transition-phase cells together with Rim15. Interestingly, deletion of RIM15 in the mck1∆ mutant led to a significant reduction of both S/G2/M and the >2C populations (from 12h to day 1, compare Fig 4D with 4C) and a dramatic reduction of budding index (Fig 6A). It is likely that the extremely small Gd and G1 cells in the rim15∆mck1∆ culture (Figs 4D and 6F) would take much longer to grow in size and to enter into the S phase, thus reducing the S/G2/M and the >2C populations, and the budding index as well.
Mck1 and Rim15 synergistically control chronological lifespan
After 3 days growth in YPD (day 0), chronological life span (CLS) was monitored by normalising the number of colony-forming units (CFUs) produced by a stationary phase culture to that produced by the preceding transition-phase culture at day 0. Due to evaporation, the culture volume tended to decrease by around 20% during the course of the study. Under the conditions of our assay, the CLS of the wild-type cells remained the same after an initial increase (Fig 7A). The initial increase may have been due to continued cell growth in YPD during the latter part of the transition phase. The rim15∆ and mck1∆ cells (Fig 7A) displayed a slightly lower CLS than that of the msn2/4∆gis1∆ mutants. Deletion of both RIM15 and MCK1 decreased the CLS to a greater extent than removal of either kinase. The pH values of the spent media from both WT and mutant cultures fell to between 4.5 and 5, indicating that medium acidification is not a cause of the difference observed between these mutants. At day 6 (after 9 days of incubation), the majority of the stationary-phase cells can form colonies (Fig 7A). However, the size of the colonies formed by the rim15∆ and mck1∆ culture is smaller than that of the WT cells (Fig 7B and 7C). Deletion of both RIM15 and MCK1 further decreased the average size of colonies (Fig 7B and 7C). These data indicate that Mck1 and Rim15 control the ability of early SP cells to exit from quiescence. To decide whether the shortened CLS was due to defects in G0 exit or to cell death, cells from a culture at day 12 were washed in PBS buffer, stained with Sytox green, and cell viability determined by FACS. Deletion of RIM15 or MCK1 decreased the cell survival rate to ~80% (Fig 7D), while rim15∆mck1∆ double deletants had a dramatically reduced cell viability of ~20% (Fig 7D). These data indicate that Mck1 and Rim15 act together to regulate the proper exit from early stationary phase, and the two kinases synergistically control cell survival during prolonged starvation. Cell survival rates among the WT and the kinase mutants are highly correlated with the amount of storage carbohydrates accumulated during the transition phase (correlation coefficient: 0.69, S3 Fig) but very poorly correlated with the percentage of unbudded cells in the stationary phase culture (correlation coefficient: 0.08, S3 Fig), suggesting that signaling to accumulate sufficient storage carbohydrates rather than exit from cell cycle may be the primary determinant of the ability of SP cells to exit from G0 and their long-term survival.

Mck1 may be a downstream target of the Ras/cAMP pathway
The Ras proteins sense the nutritional status of the cell and regulate the cAMP-PKA pathway by activating the adenylate cyclase Cyr1 [35]. Inactivation of RAS2 was shown to decrease the intracellular cAMP level by four-fold [36]. We attempted to address whether MCK1 is a downstream target of the Ras/cAMP pathway. The ras2∆ mutant cells were shown to have growth defects at high temperatures [37–38] or on non-fermentable carbon sources [36,39]. Removal of MCK1 largely suppressed the temperature sensitivity of the ras2∆ cells (Fig 8A, left) and their growth defects on non-fermentable carbon sources (Fig 8A, right). Similarly, removal of RIM15 or YAK1 abrogated the two growth defects displayed by the ras2∆ mutants (Fig 8A, left and right). The Rim15 kinase is negatively controlled by PKA and removal of RIM15 has been shown to suppress the growth defect of a cyr1ts allele [40]. Loss of Ras activity is suppressed by the disruption of YAK1, which is also negatively regulated by PKA [41–42]. These data suggest that MCK1, could also be a growth antagonist functioning downstream of the PKA pathway (see discussion). Expression of MCK1 under the control of the GAL1 promoter is not toxic to cell growth of the WT or the ras2∆ mutants (S4 Fig), indicating that the endogenous level of Mck1 is sufficient to execute its function. In this respect, we have already shown that MCK1 overexpression on a multi-copy plasmid did not significantly increase starvation-induced gene expression in WT cells (Fig 3A). Removal of both MCK1 and RIM15 in the ras2∆ cells did not further enhance cell growth at high temperature (Fig 8A, left) but rather decreased the cell growth on non-fermentable carbon sources as compared to the ras2∆ cells in which either MCK1 or RIM15 is deleted (Fig 8A, right), suggesting that MCK1 and RIM15 are required for respiratory growth. We have previously revealed that deletion of RIM15 rendered cells unable to compete with their WT counterparts in chemostat cultures limited for glucose or containing ethanol as the sole carbon source [20].

The ras2∆ mutants have been shown to have increased resistance to oxidative and heat stresses [11,43]. The increased resistance to heat shock displayed by the ras2∆ mutants (grown in YPD for 3 days) was strongly dependent on MCK1 or RIM15 (Fig 8B). Removal of both MCK1 and RIM15, compared to deletion of either of them in the ras2∆ cells, however, elicited increased heat stress resistance to the level similar to that of the WT cells (Fig 8B). This observation is contrary to what was seen for the rim15∆mck1∆ cells which displayed more severe defects to heat stress than the rim15∆ or mck1∆ single mutants (Figs 2C and 3C). The increased heat stress resistance shown by the ras2∆ and ras2∆rim15∆mck1∆ cells seemed to be correlated with their compromised respiratory growth (Fig 8A, right). Reduced respiration could lead to the generation of less reactive oxygen species in yeast cells, thus increasing their capacity for stress resistance. Alternatively, other stress response pathways could be activated in the ras2∆ cells in a way dependent on their respiratory capacity (see later results). At the median level of H2O2 (5mM), oxidative stress resistance shown by the ras2∆ cells was strongly dependent on Rim15 but not on Mck1 (Fig 8C). The strong dependence on Rim15 was abolished when MCK1 was further removed (Fig 8C). The ras2∆ deletants demonstrated enhanced resistance to oxidative stress than their WT counterparts only at very high concentration of H2O2 (7.5mM, Fig 8C) or when cells were grown in liquid medium containing a more stable oxidative reagent, tert-butyl hydroperoxide (Fig 8D). This enhanced resistance is abolished when MCK1 and/or RIM15 is removed (Fig 8C and 8D), indicating that MCK1, like RIM15, acts downstream of RAS2 to activate the oxidative stress response.
As compared to WT cells, the ras2∆ mutants accumulated slightly less trehalose but significantly more glycogen (Fig 8E). The accumulation of both storage carbohydrates in the ras2∆ mutants is strongly dependent on MCK1 and, to a greater extent, on RIM15 (Fig 8E). Further removal of RIM15 from the ras2∆mck1∆ cells marginally increased the amount of trehalose but significantly enhanced the accumulation of glycogen, to the level similar to that in the WT cells (Fig 8E). As revealed in Fig 2D, the glycogen level in the rim15∆mck1∆ cells was only around 15% of that in the WT cells. These data further confirmed that in the ras2∆ mutants, other cellular pathways are activated/deactivated to enhance the accumulation of glycogen and the acquisition of stress resistance. Glycogen synthesis in batch cultures begins before glucose is exhausted and reaches its peak before diauxic shift [29]. Glycogen stores are dropped slightly during the early adaptation to respiratory growth and then refilled thereafter to serve as energy depot during extended starvation [44]. The defective respiratory growth elicited by RAS2 deletion may allow the build-up of glycogen stores to continue during the early transition phase. This respiratory growth defect is strongly suppressed by removal of RIM15 or MCK1 and the suppression is remarkably reversed by deletion of RIM15 and MCK1 together (Fig 8A). These data suggest that the defective respiratory growth may be one of the contributing factors to account for the excessive accumulation of glycogen in the ras2∆ mutants and the substantial increase of glycogen levels in the ras2∆rim15∆mck1∆ triple mutants. Taken together, our data suggest that the nutrient sensor Ras2 may prevent G0 entry via at least two pathways. One involves the negative regulation of the G0-specific effectors including Mck1 and Rim15, while the other may involve its functions in promoting respiratory growth, a phenotype also intricately regulated by Mck1 and Rim15. It will be interesting to clarify how RAS2 promotes respiration and to understand how Mck1 and Rim15 contribute to this metabolic reprogramming.
Discussion
There has been some debate over whether exit from the cell cycle is a prerequisite for entry into quiescence. Using density gradients, a subset of SP cells, termed Q cells, have been purified and this population is uniformly arrested at G1 and displays high thermotolerance and longevity [45–46], suggesting that exit from mitosis is required for the establishment of the quiescent state. Laporte et al. [47] have reported that yeast cells can enter quiescence from all cell cycle phases and quiescence entry and exit primarily depend on the cells’ metabolic status, indicating that quiescence establishment can be uncoupled from the cell cycle. The key to this debate is whether the quiescence ‘programme’ operates independently of the cell cycle. Here, we have revealed that a network composed of Mck1, Rim15 and their downstream transcription factors, is activated to drive both cell cycle progression and the acquisition of a variety of G0-features during the transition into quiescence (Fig 9). Our data indicate that quiescence entry, including cell size homeostasis and cell cycle exit, is coordinately regulated in response to nutrient starvation (Fig 9). The ability to exit from quiescence (Fig 7B and 7C) or to survive during the stationary phase (Fig 7A and 7D), however, seem to be highly correlated with the amount of storage carbohydrates rather than the cell cycle status (S3 Fig), supporting the contention that signaling to reprogram metabolic status is the primary determinant of quiescence establishment and exit [38].
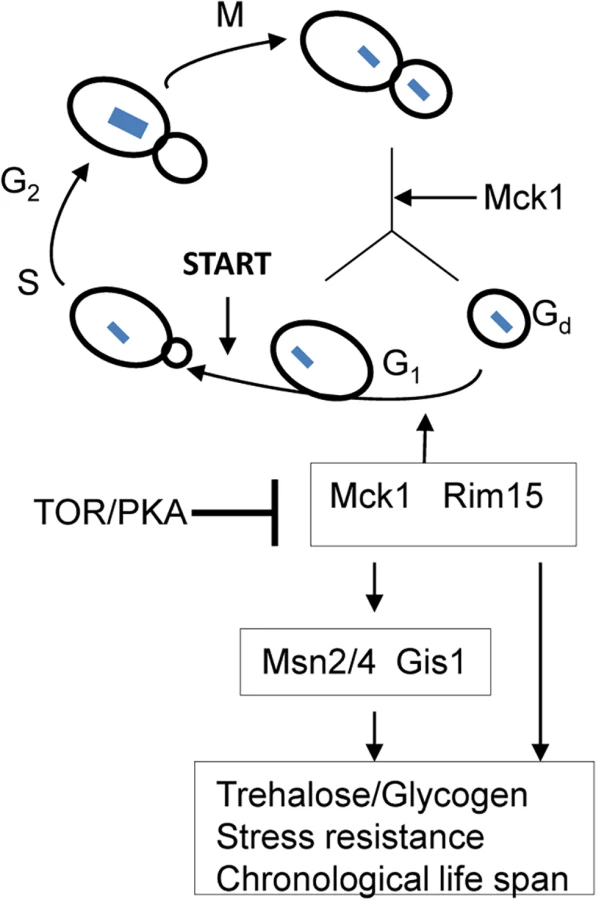
Previous studies have revealed that the function of Rim15 is negatively regulated by PKA and its nuclear localisation antagonised by TORC1 [16,40,48]. Our epistasis experiments place Mck1 downstream of Ras2 to coordinate the transition into SP (Fig 8). Mck1 has been shown to phosphorylate Bcy1 to inhibit PKA activity under heat stress [49]. Mck1 was also postulated to inhibit the activity of Tpk1 but without phosphorylating it [50]. These observations suggest that Mck1 may act at the level of PKA. Overexpression of RIM15 did not suppress the defects displayed by the mck1∆ mutants (Fig 3) and Mck1 was shown to act largely in parallel to Rim15 to activate the expression of a variety of G0-related features (Fig 2). Therefore, it is unlikely that RIM15 functions in a linear pathway downstream of MCK1. It is more likely that Mck1 also acts downstream of the Ras/cAMP pathway to regulate the transition into SP (Fig 9). Whether there is a feedback loop from Mck1 to inhibit PKA and how Mck1 is negatively regulated by PKA remains to be clarified. More recently, Mck1 was shown to inhibit ribosome and tRNA synthesis in glucose-starved or TORC1-inhibited cells [51]. Mck1-mediated phosphorylation of Elo2, a fatty acid elongase involved in sphingolipid biosynthesis, is also inhibited by TORC1 to regulate very long chain fatty acid synthesis [52]. Mammalian GSK-3 is a substrate of several kinases, including S6K1, a downstream target of TORC1 which phosphorylates GSK-3 to inhibit its kinase activity [53]. It is therefore possible that Mck1 is also regulated by the TOR pathway (Fig 9). Whether the Sch9 kinase, the yeast homologue of S6K1, phosphorylates Mck1 directly to inhibit its activity remains to be decided.
Deletion of RAS2 leads to hyperaccumulation of glycogen [39,54]. A biochemical study attributed the hyperaccumulation of glycogen in the ras2∆ mutants to the glycogen synthase activation state which rises continuously and reaches its peak before the diauxic shift, even though the glycogen phosphorylase activity is up to 40 times higher in the mutant than in the WT strain [55]. Whether the activation state of glycogen synthase in the ras2∆ mutants is enhanced due to defective respiration remains to be decided. Respiratory defects shown by the ras2∆ mutants are distinct from those displayed by mitochondrial respiratory mutants. In the latter mutant cells, both glycogen stores and the glycogen synthase activity are reduced [56–57]. Further kinetic and biochemical studies should provide clues as to how Ras2 interacts with Rim15 and Mck1 to regulate carbon metabolic switch and stress resistance.
We have revealed that Mck1 functions to promote cell separation during the post-diauxic shift phase (Fig 6C and 6D). The role of Mck1 in cell cycle control has been reported previously [58–59]. During the transition between G2/M phases, the Cdk1/Cdc28-Clb activity is abruptly raised to initiate mitosis. Decrease of this high Cdk1 activity is necessary to exit from the cell cycle at the end of mitosis. Mck1 is proposed to inhibit Cdk1-Clb activity after nuclear division to promote exit from mitosis via its interaction with, and phosphorylation of, Clb2 and Mih1 [58]. A delay in mitotic exit has been observed in exponentially growing mck1∆ cells [58]. At the diauxic shift (compare Fig 4C and 4A, 12h), 2C cells were accumulated to a substantial level in the mck1∆ culture as compared to those in the WT population. However, after the diauxic shift, the percentage of S/G2/M cells in the mck1∆ culture was actually similar to or less than that of the same cells in the WT culture (Fig 4C and 4A). In contrast, the >2C cells with two nuclear DNA-containing buds were only accumulated after glucose exhaustion. These observations indicate that the kinases may play distinct roles in cell cycle control under different nutrient conditions. Recently, Rim15 was shown to promote timely entry into mitosis under temperature stress [60]. Homologs of Rim15, named Greatwall kinases, were demonstrated to regulate entry into mitosis in Xenopus egg extracts [61–62] and in Drosophila [63–64]. However, it remains to be decided whether the significant accumulation of 2C cells at the diauxic shift in the rim15∆ and mck1∆ culture (Fig 4B and 4C) is due to defects respectively in mitosis entry and exit.
Cell size homeostasis in budding yeast is controlled at the G1/S boundary called START, primarily by preventing cell division until a critical cell size is attained [65–66]. Under poor growth conditions [67–69] or in the post-diauxic shift phase [31], cell divisions are highly asymmetric, producing very small daughter cells (Fig 5E). We have shown that Mck1 and Rim15 modulate the size of all the cell types, especially the G1 and S/G2/M populations (Fig 6F), suggesting that the two kinases are essential for mitotic cells to grow to the required size before commitment to the next cell cycle (Fig 9). The small-size phenotype ascribed to the mck1∆ mutants has previously been revealed by a genome-wide screen in stationary-phase cultures [70]. In glucose-limited chemostat cultures of prototrophic strains, the cell cycle is spontaneously synchronised with periodic bursts of glycolysis and respiration [71–72]. Metabolic and transcriptomic studies on these periodic cycles have revealed that storage carbohydrates are accumulated during early G1, which are then liquidated at late G1 to drive metabolism and gene expression important for growth and respiration [71–72]. Based on the link between metabolism, cell growth, and the cell cycle, Futcher [73] hypothesised that the accumulation of storage carbohydrates is an important determinant of START and cell size under nutrient-limited conditions. Furthermore, storage carbohydrates provide a ready source of energy when division resumes and are crucial to long-term survival [74]. Our findings that cell size (Fig 6F), resumption of growth from SP (Fig 7B) and chronological lifespan (Fig 7A and 7D) are closely correlated with the amount of storage carbohydrates accumulated in the WT and rim15∆/mck1∆ mutants (Fig 2D and 2E) seem to support Futcher’s hypothesis.
Among the three distinct cell types, Gd cells displayed less DNA fluorescence and smaller cell size than 1C cells at the diauxic shift (Figs 4A, 6E and 6F). Small-size cells with less than 1C DNA signals have previously been reported in the post-diauxic shift cell culture [31] or in the diauxic shift culture overexpressing CLN3 [75]. Moreover, G1 and S/G2/M cells in the mck1∆ or rim15∆ mutant population are smaller (Fig 6F) and they display lower DNA staining signals than those in the wild-type population (day 3 samples in Fig 4). G1 cells in the mck1∆rim15∆ double mutant population have the same size distribution as Gd cells (Fig 6F) and these two populations cannot be differentiated by FACS (Fig 4D). These data appear to support the contention that cell size is an important factor influencing DNA staining or fluorescence detection (although for unknown reasons). However, in WT cell culture, the cell sizes of Gd, G1 and S/G2/M cells are similarly increased from day 1 to day 3 (Fig 5D), DNA staining signals produced by Gd cells increased only marginally but those generated by G1 and S/G2/M cells were enhanced significantly (Fig 4A), suggesting that other mechanisms may contribute to the substantial increase of DNA fluorescence signals in large mother or mother-to-be cells. qPCR experiments confirmed that the ratio between mitochondrial and genomic DNA remained constant at ~35 from 12h to day 3 in the wild-type cell culture (S5 Fig), thus ruling out the possibility that mitochondrial biogenesis leads to increase of DNA signals in large cells. Previous studies have demonstrated that yeast cells duplicate their chromosomes (or segments of chromosomes) to overcome proteotoxic stress [76], adverse environmental conditions [77], DNA damage [78], and nutrient-limitation [79]. Similarly, E. coli cultures at stationary phase contain cells with several chromosomes and those exclusively composed of cells with a single chromosome are never observed, regardless of the growth medium [80]. Whether genomic duplications occur in starved cells and how cell size affects DNA staining or fluorescence signal detection needs to be further clarified. Future work should also aim to elucidate how Mck1 regulates cell size, cell separation and other characteristics associated with quiescent cells and how the activity of Mck1 is regulated by the PKA and TOR pathways. This knowledge, when combined with similar known interactions for Rim15 [19], should provide a mechanistic insight into both quiescence entry and the maintenance of longevity.
Materials and Methods
Strains and plasmids
Strains carrying single-gene deletions were obtained directly from the BY4742 mutant library (Open Biosystems). Strains carrying deletions in multiple genes were generated by combining mutations via either mating and dissection, or by PCR-mediated gene replacement using drug resistance or nutritional markers [81–82]. Deletion mutants of genes coding for non-essential signaling molecules used in this study are selected based on data in Lee et al. [51], and include protein, lipid and metabolite kinases, phosphatases and their regulators. Expression reporter cassettes were constructed in pRS426 in which the transcription of cds coding for red fluorescent protein (RFP, [83]) is controlled by the SSA3 promoter. Similarly, the cds encoding Venus fluorescent protein (VFP, [84]) was fused with that of HSP12 and expressed from the HSP12 promoter. RIM15 and MCK1 under the control of their endogenous promoters were cloned into pRS425 for overexpression studies. The coding sequence of MCK1 was also inserted into pYES2 vector downstream of the GAL1 promoter.
Fluorescence detection and quantification
For quantitative assays of pSSA3-RFP and pHSP12-HSP12-VFP levels in liquid cultures, freshly-grown overnight cultures were inoculated (5% v/v) into SMM medium containing 0.6% glucose which had been dispensed into 96-well microtiter plate. Cell density (OD595nm) and fluorescence intensities were simultaneously monitored in triplicate using a plate reader (BMG Biotech). RFP is excited at 580/±10nm and emits at 610/±10nm, while VFP is excited at 500/±10nm and emits at 540/±10nm. MG132 (a proteasome inhibitor) was added into the growing cell cultures at the early-to-mid exponential phase. The working concentration was 12.5μM for MG132 (50mM stock solution in DMSO or absolute ethanol). Medium-only blanks and WT cells bearing the same constructs were included for each run as negative and positive controls, respectively. After background subtraction, RFP and VFP fluorescence intensities were normalised to cell density. The mean and standard deviation were calculated at each time point; for simplicity, standard errors at regular intervals only are plotted with the means in all Figures.
Determination of storage carbohydrates
The concentrations of glycogen and trehalose (μg glucose per mg of wet cells) was determined following the procedures described by Parrou and Francois [85]. Briefly, cells (~30mg wet weight from 1ml of culture grown in YPD) were treated with 250μl of 0.25M Na2CO3 at 95°C for 4 hours, neutralised with 0.15ml of 1M acetic acid and 0.6ml of 0.2M Na-Acetate buffer (pH = 5.2). Half of the culture was treated with trehalase (0.025u, Sigma) and incubated at 37°C overnight with shaking. The other half was treated with amyloglucosidase (0.6u, Roche) and incubated at 57°C overnight with shaking. The amount of glucose liberated into the supernatant was determined using a glucose assay kit (Sigma).
Phenotypic assays
Stress resistance conferred by cells grown to the transition phases (1 and 3 days) was determined according to Wei et al. [11]. Yeast cells were subjected to treatment at 55°C for 5 or 10 minutes, serially diluted and spotted onto YPD agar to determine their resistance to heat shock. Similarly, cells were directly spotted onto YPD agar containing 2.5, 5 or 7.5mM H2O2 to assay their resistance to oxidative stress. Chronological life span (CLS) of WT and mutant cells was measured for 21 days by counting colony-forming units (CFUs) on YPD agar plates after serial dilutions. CLS was determined every three days by normalising CFUs of stationary-phase cells to that produced by a day 0 culture (after 3 days of growth in YPD). Cell viability at day 12 (day 15 in SP) was also measured by FACS analysis, essentially following the protocol described by Ocampo and Barrientos [86]. Instead of using propidium iodide, 2μM of Sytox Green was used to stain the cells. Excitation was performed using a laser at 488nm and emission detected with a standard 530/30 band pass filter.
Analysis of cell size, cell cycle, budding index and presence of nuclear DNA in buds
SP cells were serially diluted and spread on YPD plates. Cell colonies grown at 30°C for 36–48 hours were imaged and colony size analysed with Cell Profiler (http://www.cellprofiler.org/) using the modified pipeline described by Vokes and Carpenter [87]. Cell cycle status was determined according to Haase and Reed [88] using Sytox Green to stain DNA in fixed cells. Samples were sonicated at low power (2 min) and analysed using a cytometer (LSRFortessa, Becton Dickinson). Data were processed using FlowJo software (www.flowjo.com). Images of cells were taken with a microscope (Olympus BX51) and the objective lenses (Plan N 10×/0.25), captured using QICAM (Q 24720) and Qcapture Pro 6 as the acquisition software. The percentage of budded cells was determined by counting from photographs of these images using ImageJ softwaere (http://imagej.nih.gov/ij/). To decide whether nuclear DNA was present in buds, fluorescent images of cells stained with Sytox green were captured using UPlanSApo (60×/1.35) as the object lenses. These images were exported and processed in Adobe Photoshop CS4.
Miscellaneous
The G1 and Gd cells were sorted from the WT culture (treated and stained with Sytox Green) using a Biorad S3 sorter. Sorted cells were collected and resuspended in 50mM Tris buffer (pH 7.5) and stained with 0.1mg/ml of calcofluor white for 20min at 30°C. Stained cell were washed twice with buffer before imaging. Cells subjected to glucan staining were fixed with 70% ethanol for one hour, washed with PBS buffer twice, and stained with 5mg/ml of Aniline Blue for 20min.
Supporting Information
Zdroje
1. Bartke A, Sun LY, Longo V (2013) Somatotropic signaling: trade-offs between growth, reproductive development, and longevity. Physiol Rev 93 : 571–598. doi: 10.1152/physrev.00006.2012 23589828
2. Johnson SC, Rabinovitch PS, Kaeberlein M (2013) mTOR is a key modulator of ageing and age-related disease. Nature 493 : 338–345. doi: 10.1038/nature11861 23325216
3. Kamada Y, Sekito T, Ohsumi Y (2004) Autophagy in yeast: a TOR-mediated response to nutrient starvation. Curr Top Microbiol Immunol 279 : 73–84. 14560952
4. Gray JV, Petsko GA, Johnston GC, Ringe D, Singer RA, et al. (2004) "Sleeping beauty": quiescence in Saccharomyces cerevisiae. Microbiol Mol Biol Rev 68 : 187–206. 15187181
5. De Virgilio C (2012) The essence of yeast quiescence. FEMS Microbiol Rev 36 : 306–339. doi: 10.1111/j.1574-6976.2011.00287.x 21658086
6. Longo VD, Fabrizio P (2012) Chronological Aging in Saccharomyces cerevisiae. Subcell Biochem 57 : 101–121. doi: 10.1007/978-94-007-2561-4_5 22094419
7. Powers RW 3rd, Kaeberlein M, Caldwell SD, Kennedy BK, Fields S (2006) Extension of chronological life span in yeast by decreased TOR pathway signaling. Genes Dev 20 : 174–184. 16418483
8. Fabrizio P, Pozza F, Pletcher SD, Gendron CM, Longo VD (2001) Regulation of longevity and stress resistance by Sch9 in yeast. Science 292 : 288–290. 11292860
9. Urban J, Soulard A, Huber A, Lippman S, Mukhopadhyay D, et al. (2007) Sch9 is a major target of TORC1 in Saccharomyces cerevisiae. Mol Cell 26 : 663–674. 17560372
10. Fabrizio P, Liou LL, Moy VN, Diaspro A, Valentine JS, et al. (2003) SOD2 functions downstream of Sch9 to extend longevity in yeast. Genetics 163 : 35–46. 12586694
11. Wei M, Fabrizio P, Hu J, Ge H, Cheng C, et al. (2008) Life span extension by calorie restriction depends on Rim15 and transcription factors downstream of Ras/PKA, Tor, and Sch9. PLoS Genet 4: e13. doi: 10.1371/journal.pgen.0040013 18225956
12. Ocampo A, Liu J, Schroeder EA, Shadel GS, Barrientos A (2012) Mitochondrial respiratory thresholds regulate yeast chronological life span and its extension by caloric restriction. Cell Metab 16 : 55–67. doi: 10.1016/j.cmet.2012.05.013 22768839
13. Bonawitz ND, Chatenay-Lapointe M, Pan Y, Shadel GS (2007) Reduced TOR signaling extends chronological life span via increased respiration and upregulation of mitochondrial gene expression. Cell Metab 5 : 265–277. 17403371
14. Schroeder EA, Raimundo N, Shadel GS (2013) Epigenetic silencing mediates mitochondria stress-induced longevity. Cell Metab 17 : 954–964. doi: 10.1016/j.cmet.2013.04.003 23747251
15. Mirisola MG, Longo VD (2013) A radical signal activates the epigenetic regulation of longevity. Cell Metab 17 : 812–813. doi: 10.1016/j.cmet.2013.05.015 23747240
16. Pedruzzi I, Dubouloz F, Cameroni E, Wanke V, Roosen J, et al. (2003) TOR and PKA signaling pathways converge on the protein kinase Rim15 to control entry into G0. Mol Cell 12 : 1607–1613. 14690612
17. Talarek N, Cameroni E, Jaquenoud M, Luo X, Bontron S, et al. (2010) Initiation of the TORC1-regulated G0 program requires Igo1/2, which license specific mRNAs to evade degradation via the 5'-3' mRNA decay pathway. Mol Cell 38 : 345–355. doi: 10.1016/j.molcel.2010.02.039 20471941
18. Luo X, Talarek N, De Virgilio C (2011) Initiation of the yeast G0 program requires Igo1 and Igo2, which antagonize activation of decapping of specific nutrient-regulated mRNAs. RNA Biol 8 : 14–17. 21289492
19. Bontron S, Jaquenoud M, Vaga S, Talarek N, Bodenmiller B, et al. (2013) Yeast endosulfines control entry into quiescence and chronological life span by inhibiting protein phosphatase 2A. Cell Rep 3 : 16–22. doi: 10.1016/j.celrep.2012.11.025 23273919
20. Zhang N, Wu J, Oliver SG (2009) Gis1 is required for transcriptional reprogramming of carbon metabolism and the stress response during transition into stationary phase in yeast. Microbiology 155 : 1690–1698. doi: 10.1099/mic.0.026377-0 19383711
21. Zhang N, Quan Z, Rash B, Oliver SG (2013) Synergistic effects of TOR and proteasome pathways on the yeast transcriptome and cell growth. Open Biol 3 : 120137. doi: 10.1098/rsob.120137 23697803
22. Durchschlag E, Reiter W, Ammerer G, Schuller C (2004) Nuclear localization destabilizes the stress-regulated transcription factor Msn2. J Biol Chem 279 : 55425–55432. 15502160
23. Quan Z, Oliver SG, Zhang N (2011) JmjN interacts with JmjC to ensure selective proteolysis of Gis1 by the proteasome. Microbiology 157 : 2694–2701. doi: 10.1099/mic.0.048199-0 21680636
24. Zhang N, Oliver SG (2010) The transcription activity of Gis1 is negatively modulated by proteasome-mediated limited proteolysis. J Biol Chem 285 : 6465–6476. doi: 10.1074/jbc.M109.073288 20022953
25. Pedruzzi I, Burckert N, Egger P, De Virgilio C (2000) Saccharomyces cerevisiae Ras/cAMP pathway controls post-diauxic shift element-dependent transcription through the zinc finger protein Gis1. EMBO J 19 : 2569–2579. 10835355
26. Martinez-Pastor MT, Marchler G, Schuller C, Marchler-Bauer A, Ruis H, et al. (1996) The Saccharomyces cerevisiae zinc finger proteins Msn2p and Msn4p are required for transcriptional induction through the stress response element (STRE). EMBO J 15 : 2227–2235. 8641288
27. Hirata Y, Andoh T, Asahara T, Kikuchi A (2003) Yeast glycogen synthase kinase-3 activates Msn2p-dependent transcription of stress responsive genes. Mol Biol Cell 14 : 302–312. 12529445
28. Nalley K, Johnston SA, Kodadek T (2006) Proteolytic turnover of the Gal4 transcription factor is not required for function in vivo. Nature 442 : 1054–1057. 16929306
29. Lillie SH, Pringle JR (1980) Reserve carbohydrate metabolism in Saccharomyces cerevisiae: responses to nutrient limitation. J Bacteriol 143 : 1384–1394. 6997270
30. Murakami C, Delaney JR, Chou A, Carr D, Schleit J, et al. (2012) pH neutralization protects against reduction in replicative lifespan following chronological aging in yeast. Cell Cycle 11 : 3087–3096. doi: 10.4161/cc.21465 22871733
31. Li L, Miles S, Melville Z, Prasad A, Bradley G, et al. (2013) Key events during the transition from rapid growth to quiescence in budding yeast require posttranscriptional regulators. Mol Biol Cell 24 : 3697–3709. doi: 10.1091/mbc.E13-05-0241 24088570
32. Wolken DM, McInnes J, Pon LA (2014) Aim44p regulates phosphorylation of Hof1p to promote contractile ring closure during cytokinesis in budding yeast. Mol Biol Cell 25 : 753–762. doi: 10.1091/mbc.E13-06-0317 24451263
33. Bidlingmaier S, Weiss EL, Seidel C, Drubin DG, Snyder M (2001) The Cbk1p pathway is important for polarized cell growth and cell separation in Saccharomyces cerevisiae. Mol Cell Biol 21 : 2449–2462. 11259593
34. Lesage G, Bussey H (2006) Cell wall assembly in Saccharomyces cerevisiae. Microbiol Mol Biol Rev 70 : 317–343. 16760306
35. Broek D, Samiy N, Fasano O, Fujiyama A, Tamanoi F, et al. (1985) Differential activation of yeast adenylate cyclase by wild-type and mutant RAS proteins. Cell 41 : 763–769. 3891097
36. Marchler G, Schuller C, Adam G, Ruis H (1993) A Saccharomyces cerevisiae UAS element controlled by protein kinase A activates transcription in response to a variety of stress conditions. EMBO J 12 : 1997–2003. 8387917
37. Ruiz-Roig C, Vieitez C, Posas F, de Nadal E (2010) The Rpd3L HDAC complex is essential for the heat stress response in yeast. Mol Microbiol 76 : 1049–1062. doi: 10.1111/j.1365-2958.2010.07167.x 20398213
38. Ma L, Ho K, Piggott N, Luo Z, Measday V (2012) Interactions between the kinetochore complex and the protein kinase A pathway in Saccharomyces cerevisiae. G3 (Bethesda) 2 : 831–841. doi: 10.1534/g3.112.002675 22870406
39. Petitjean A, Hilger F, Tatchell K (1990) Comparison of thermosensitive alleles of the CDC25 gene involved in the cAMP metabolism of Saccharomyces cerevisiae. Genetics 124 : 797–806. 2157625
40. Reinders A, Burckert N, Boller T, Wiemken A, De Virgilio C (1998) Saccharomyces cerevisiae cAMP-dependent protein kinase controls entry into stationary phase through the Rim15p protein kinase. Genes Dev 12 : 2943–2955. 9744870
41. Lee P, Paik SM, Shin CS, Huh WK, Hahn JS (2011) Regulation of yeast Yak1 kinase by PKA and autophosphorylation-dependent 14-3-3 binding. Mol Microbiol 79 : 633–646. doi: 10.1111/j.1365-2958.2010.07471.x 21255108
42. Garrett S, Broach J (1989) Loss of Ras activity in Saccharomyces cerevisiae is suppressed by disruptions of a new kinase gene, YAKI, whose product may act downstream of the cAMP-dependent protein kinase. Genes Dev 3 : 1336–1348. 2558053
43. Longo VD (1999) Mutations in signal transduction proteins increase stress resistance and longevity in yeast, nematodes, fruit flies, and mammalian neuronal cells. Neurobiol Aging 20 : 479–486. 10638521
44. Francois J, Parrou JL (2001) Reserve carbohydrates metabolism in the yeast Saccharomyces cerevisiae. FEMS Microbiol Rev 25 : 125–145. 11152943
45. Allen C, Buttner S, Aragon AD, Thomas JA, Meirelles O, et al. (2006) Isolation of quiescent and nonquiescent cells from yeast stationary-phase cultures. J Cell Biol 174 : 89–100. 16818721
46. Li L, Lu Y, Qin LX, Bar-Joseph Z, Werner-Washburne M, et al. (2009) Budding yeast SSD1-V regulates transcript levels of many longevity genes and extends chronological life span in purified quiescent cells. Mol Biol Cell 20 : 3851–3864. doi: 10.1091/mbc.E09-04-0347 19570907
47. Laporte D, Lebaudy A, Sahin A, Pinson B, Ceschin J, et al. (2011) Metabolic status rather than cell cycle signals control quiescence entry and exit. J Cell Biol 192 : 949–957. doi: 10.1083/jcb.201009028 21402786
48. Swinnen E, Wanke V, Roosen J, Smets B, Dubouloz F, et al. (2006) Rim15 and the crossroads of nutrient signalling pathways in Saccharomyces cerevisiae. Cell Div 1 : 3. 16759348
49. Griffioen G, Swinnen S, Thevelein JM (2003) Feedback inhibition on cell wall integrity signaling by Zds1 involves Gsk3 phosphorylation of a cAMP-dependent protein kinase regulatory subunit. J Biol Chem 278 : 23460–23471. 12704202
50. Rayner TF, Gray JV, Thorner JW (2002) Direct and novel regulation of cAMP-dependent protein kinase by Mck1p, a yeast glycogen synthase kinase-3. J Biol Chem 277 : 16814–16822. 11877433
51. Lee J, Moir RD, McIntosh KB, Willis IM (2012) TOR signaling regulates ribosome and tRNA synthesis via LAMMER/Clk and GSK-3 family kinases. Mol Cell 45 : 836–843. doi: 10.1016/j.molcel.2012.01.018 22364741
52. Zimmermann C, Santos A, Gable K, Epstein S, Gururaj C, et al. (2013) TORC1 inhibits GSK3-mediated Elo2 phosphorylation to regulate very long chain fatty acid synthesis and autophagy. Cell Rep 5 : 1036–1046. doi: 10.1016/j.celrep.2013.10.024 24239358
53. Zhang HH, Lipovsky AI, Dibble CC, Sahin M, Manning BD (2006) S6K1 regulates GSK3 under conditions of mTOR-dependent feedback inhibition of Akt. Mol Cell 24 : 185–197. 17052453
54. Tatchell K, Robinson LC, Breitenbach M (1985) RAS2 of Saccharomyces cerevisiae is required for gluconeogenic growth and proper response to nutrient limitation. Proc Natl Acad Sci U S A 82 : 3785–3789. 3889915
55. Fernandez-Banares I, Clotet J, Arino J, Guinovart JJ (1991) Glycogen hyperaccumulation in Saccharomyces cerevisiae ras2 mutant. A biochemical study. FEBS Lett 290 : 38–42. 1655535
56. Yang R, Chun KT, Wek RC (1998) Mitochondrial respiratory mutants in yeast inhibit glycogen accumulation by blocking activation of glycogen synthase. J Biol Chem 273 : 31337–31344. 9813042
57. Enjalbert B, Parrou JL, Vincent O, Francois J (2000) Mitochondrial respiratory mutants of Saccharomyces cerevisiae accumulate glycogen and readily mobilize it in a glucose-depleted medium. Microbiology 146 (Pt 10): 2685–2694. 11021944
58. McQueen J, van Dyk D, Young B, Loewen C, Measday V (2012) The Mck1 GSK-3 kinase inhibits the activity of Clb2-Cdk1 post-nuclear division. Cell Cycle 11 : 3421–3432. doi: 10.4161/cc.21731 22918234
59. Ikui AE, Rossio V, Schroeder L, Yoshida S (2012) A yeast GSK-3 kinase Mck1 promotes Cdc6 degradation to inhibit DNA re-replication. PLoS Genet 8: e1003099. doi: 10.1371/journal.pgen.1003099 23236290
60. Juanes MA, Khoueiry R, Kupka T, Castro A, Mudrak I, et al. (2013) Budding Yeast Greatwall and Endosulfines Control Activity and Spatial Regulation of PP2A(Cdc55) for Timely Mitotic Progression. PLoS Genet 9: e1003575. doi: 10.1371/journal.pgen.1003575 23861665
61. Gharbi-Ayachi A, Labbe JC, Burgess A, Vigneron S, Strub JM, et al. (2010) The substrate of Greatwall kinase, Arpp19, controls mitosis by inhibiting protein phosphatase 2A. Science 330 : 1673–1677. doi: 10.1126/science.1197048 21164014
62. Mochida S, Maslen SL, Skehel M, Hunt T (2010) Greatwall phosphorylates an inhibitor of protein phosphatase 2A that is essential for mitosis. Science 330 : 1670–1673. doi: 10.1126/science.1195689 21164013
63. Yu J, Fleming SL, Williams B, Williams EV, Li Z, et al. (2004) Greatwall kinase: a nuclear protein required for proper chromosome condensation and mitotic progression in Drosophila. J Cell Biol 164 : 487–492. 14970188
64. Rangone H, Wegel E, Gatt MK, Yeung E, Flowers A, et al. (2011) Suppression of scant identifies Endos as a substrate of greatwall kinase and a negative regulator of protein phosphatase 2A in mitosis. PLoS Genet 7: e1002225. doi: 10.1371/journal.pgen.1002225 21852956
65. Fantes PA, Grant WD, Pritchard RH, Sudbery PE, Wheals AE (1975) The regulation of cell size and the control of mitosis. J Theor Biol 50 : 213–244. 1127959
66. Johnston GC, Pringle JR, Hartwell LH (1977) Coordination of growth with cell division in the yeast Saccharomyces cerevisiae. Exp Cell Res 105 : 79–98. 320023
67. Johnston GC, Singer RA, McFarlane S (1977) Growth and cell division during nitrogen starvation of the yeast Saccharomyces cerevisiae. J Bacteriol 132 : 723–730. 334751
68. Johnston GC (1977) Cell size and budding during starvation of the yeast Saccharomyces cerevisiae. J Bacteriol 132 : 738–739. 334753
69. Lord PG, Wheals AE (1980) Asymmetrical division of Saccharomyces cerevisiae. J Bacteriol 142 : 808–818. 6991494
70. Zhang J, Schneider C, Ottmers L, Rodriguez R, Day A, et al. (2002) Genomic scale mutant hunt identifies cell size homeostasis genes in S. cerevisiae. Curr Biol 12 : 1992–2001. 12477387
71. Tu BP, Kudlicki A, Rowicka M, McKnight SL (2005) Logic of the yeast metabolic cycle: temporal compartmentalization of cellular processes. Science 310 : 1152–1158. 16254148
72. Muller D, Exler S, Aguilera-Vazquez L, Guerrero-Martin E, Reuss M (2003) Cyclic AMP mediates the cell cycle dynamics of energy metabolism in Saccharomyces cerevisiae. Yeast 20 : 351–367. 12627401
73. Futcher B (2006) Metabolic cycle, cell cycle, and the finishing kick to Start. Genome Biol 7 : 107. 16677426
74. Sillje HH, Paalman JW, ter Schure EG, Olsthoorn SQ, Verkleij AJ, et al. (1999) Function of trehalose and glycogen in cell cycle progression and cell viability in Saccharomyces cerevisiae. J Bacteriol 181 : 396–400. 9882651
75. Miles S, Li L, Davison J, Breeden LL (2013) Xbp1 directs global repression of budding yeast transcription during the transition to quiescence and is important for the longevity and reversibility of the quiescent state. PLoS Genet 9: e1003854. doi: 10.1371/journal.pgen.1003854 24204289
76. Chen G, Bradford WD, Seidel CW, Li R (2012) Hsp90 stress potentiates rapid cellular adaptation through induction of aneuploidy. Nature 482 : 246–250. doi: 10.1038/nature10795 22286062
77. Yona AH, Manor YS, Herbst RH, Romano GH, Mitchell A, et al. (2012) Chromosomal duplication is a transient evolutionary solution to stress. Proc Natl Acad Sci U S A 109 : 21010–21015. doi: 10.1073/pnas.1211150109 23197825
78. Pavelka N, Rancati G, Zhu J, Bradford WD, Saraf A, et al. (2010) Aneuploidy confers quantitative proteome changes and phenotypic variation in budding yeast. Nature 468 : 321–325. doi: 10.1038/nature09529 20962780
79. Gresham D, Desai MM, Tucker CM, Jenq HT, Pai DA, et al. (2008) The repertoire and dynamics of evolutionary adaptations to controlled nutrient-limited environments in yeast. PLoS Genet 4: e1000303. doi: 10.1371/journal.pgen.1000303 19079573
80. Akerlund T, Nordstrom K, Bernander R (1995) Analysis of cell size and DNA content in exponentially growing and stationary-phase batch cultures of Escherichia coli. J Bacteriol 177 : 6791–6797. 7592469
81. Goldstein AL, McCusker JH (1999) Three new dominant drug resistance cassettes for gene disruption in Saccharomyces cerevisiae. Yeast 15 : 1541–1553. 10514571
82. Longtine MS, McKenzie A 3rd, Demarini DJ, Shah NG, Wach A, et al. (1998) Additional modules for versatile and economical PCR-based gene deletion and modification in Saccharomyces cerevisiae. Yeast 14 : 953–961. 9717241
83. Keppler-Ross S, Noffz C, Dean N (2008) A new purple fluorescent color marker for genetic studies in Saccharomyces cerevisiae and Candida albicans. Genetics 179 : 705–710. doi: 10.1534/genetics.108.087080 18493083
84. Nagai T, Ibata K, Park ES, Kubota M, Mikoshiba K, et al. (2002) A variant of yellow fluorescent protein with fast and efficient maturation for cell-biological applications. Nat Biotechnol 20 : 87–90. 11753368
85. Parrou JL, Francois J (1997) A simplified procedure for a rapid and reliable assay of both glycogen and trehalose in whole yeast cells. Anal Biochem 248 : 186–188. 9177741
86. Ocampo A, Barrientos A (2011) Quick and reliable assessment of chronological life span in yeast cell populations by flow cytometry. Mech Ageing Dev 132 : 315–323. doi: 10.1016/j.mad.2011.06.007 21736893
87. Vokes MS, Carpenter AE (2008) Using CellProfiler for automatic identification and measurement of biological objects in images. Curr Protoc Mol Biol Chapter 14: Unit 14 17.
88. Haase SB, Reed SI (2002) Improved flow cytometric analysis of the budding yeast cell cycle. Cell Cycle 1 : 132–136. 12429922
Štítky
Genetika Reprodukční medicínaČlánek vyšel v časopise
PLOS Genetics
2015 Číslo 6
Nejčtenější v tomto čísle
- Non-reciprocal Interspecies Hybridization Barriers in the Capsella Genus Are Established in the Endosperm
- Translational Upregulation of an Individual p21 Transcript Variant by GCN2 Regulates Cell Proliferation and Survival under Nutrient Stress
- Exome Sequencing of Phenotypic Extremes Identifies and as Interacting Modifiers of Chronic Infection in Cystic Fibrosis
- The Human Blood Metabolome-Transcriptome Interface