
Early Emergence of Ethnic Differences in Type 2 Diabetes Precursors in the UK: The Child Heart and Health Study in England (CHASE Study)
Background:
Adults of South Asian origin living in the United Kingdom have high risks of type 2 diabetes and central obesity; raised circulating insulin, triglyceride, and C-reactive protein concentrations; and low HDL-cholesterol when compared with white Europeans. Adults of African-Caribbean origin living in the UK have smaller increases in type 2 diabetes risk, raised circulating insulin and HDL-cholesterol, and low triglyceride and C-reactive protein concentrations. We examined whether corresponding ethnic differences were apparent in childhood.
Methods and Findings:
We performed a cross-sectional survey of 4,796 children aged 9–10 y in three UK cities who had anthropometric measurements (68% response) and provided blood samples (58% response); ethnicity was based on parental definition. In age-adjusted comparisons with white Europeans (n = 1,153), South Asian children (n = 1,306) had higher glycated haemoglobin (HbA1c) (% difference: 2.1, 95% CI 1.6 to 2.7), fasting insulin (% difference 30.0, 95% CI 23.4 to 36.9), triglyceride (% difference 12.9, 95% CI 9.4 to 16.5), and C-reactive protein (% difference 43.3, 95% CI 28.6 to 59.7), and lower HDL-cholesterol (% difference −2.9, 95% CI −4.5 to −1.3). Higher adiposity levels among South Asians (based on skinfolds and bioimpedance) did not account for these patterns. Black African-Caribbean children (n = 1,215) had higher levels of HbA1c, insulin, and C-reactive protein than white Europeans, though the ethnic differences were not as marked as in South Asians. Black African-Caribbean children had higher HDL-cholesterol and lower triglyceride levels than white Europeans; adiposity markers were not increased.
Conclusions:
Ethnic differences in type 2 diabetes precursors, mostly following adult patterns, are apparent in UK children in the first decade. Some key determinants operate before adult life and may provide scope for early prevention.
: Please see later in the article for the Editors' Summary
Published in the journal:
. PLoS Med 7(4): e32767. doi:10.1371/journal.pmed.1000263
Category:
Research Article
doi:
https://doi.org/10.1371/journal.pmed.1000263
Summary
Background:
Adults of South Asian origin living in the United Kingdom have high risks of type 2 diabetes and central obesity; raised circulating insulin, triglyceride, and C-reactive protein concentrations; and low HDL-cholesterol when compared with white Europeans. Adults of African-Caribbean origin living in the UK have smaller increases in type 2 diabetes risk, raised circulating insulin and HDL-cholesterol, and low triglyceride and C-reactive protein concentrations. We examined whether corresponding ethnic differences were apparent in childhood.
Methods and Findings:
We performed a cross-sectional survey of 4,796 children aged 9–10 y in three UK cities who had anthropometric measurements (68% response) and provided blood samples (58% response); ethnicity was based on parental definition. In age-adjusted comparisons with white Europeans (n = 1,153), South Asian children (n = 1,306) had higher glycated haemoglobin (HbA1c) (% difference: 2.1, 95% CI 1.6 to 2.7), fasting insulin (% difference 30.0, 95% CI 23.4 to 36.9), triglyceride (% difference 12.9, 95% CI 9.4 to 16.5), and C-reactive protein (% difference 43.3, 95% CI 28.6 to 59.7), and lower HDL-cholesterol (% difference −2.9, 95% CI −4.5 to −1.3). Higher adiposity levels among South Asians (based on skinfolds and bioimpedance) did not account for these patterns. Black African-Caribbean children (n = 1,215) had higher levels of HbA1c, insulin, and C-reactive protein than white Europeans, though the ethnic differences were not as marked as in South Asians. Black African-Caribbean children had higher HDL-cholesterol and lower triglyceride levels than white Europeans; adiposity markers were not increased.
Conclusions:
Ethnic differences in type 2 diabetes precursors, mostly following adult patterns, are apparent in UK children in the first decade. Some key determinants operate before adult life and may provide scope for early prevention.
: Please see later in the article for the Editors' Summary
Introduction
Asian populations, both in Asia and in diaspora populations, are facing an epidemic of type 2 diabetes [1]. South Asian adults living in the UK have markedly higher (approximately 3-fold) risks of type 2 diabetes than white Europeans [2]–[4]. In population-based studies, they generally have raised plasma glucose and glycated haemoglobin (HbA1c), fasting insulin, and triglyceride concentrations, higher levels of adiposity (particularly central adiposity), but lower HDL-cholesterol concentrations [2]–[5]. C-reactive protein levels (strongly associated with insulin resistance and type 2 diabetes risk [6],[7]) are also elevated [6],[8]. Among UK South Asians, diabetes prevalence tends to be higher among Bangladeshis and Pakistanis than Indians [3],[5],[9].
Black African-Caribbean adults living in the UK are also at increased risk (approximately 2-fold) of type 2 diabetes when compared with white Europeans [3],[4],[10]. In population-based studies, black African-Caribbeans have generally had raised plasma glucose, HbA1c, and fasting insulin concentrations, though less so than South Asians [3],[4],[10]. Paradoxically, black African-Caribbeans have higher mean HDL-cholesterol levels and lower levels of triglyceride and C-reactive protein than white Europeans [3],[4],[10],[11]. Adiposity (particularly general adiposity) tends to be increased [3],[10]. These disease and risk factor patterns have generally been similar in black adults of both African and Caribbean origins [3],[4].
Early life exposures have been implicated in the aetiology of type 2 diabetes [12]. It is now recognized that the higher risks of type 2 diabetes among Asians (including South Asians) are apparent in early adult life and adolescence both in the US [13] and in the UK [14]. It has been suggested that population-wide differences in diabetes precursors between South Asians and white Europeans could be apparent in childhood [15],[16]. We report here the results of a large-scale population-based study investigating patterns of adiposity, glucose, insulin, related blood lipids, and C-reactive protein among 9 - to 10-y-old UK children of white European and South Asian origin, and specifically including children of Bangladeshi, Pakistani, and Indian origins. The study also aimed to investigate risk factor patterns among black African-Caribbean children (including both African and Caribbean origins).
Methods
The Child Heart and Health Study in England (CHASE Study) is a school-based investigation of the health of British children aged 9–10 y old, living in London, Leicester, and Birmingham. Ethical approval was obtained from the Multicentre Research Ethics Committee (Wales); the study was carried out in accordance with the principles expressed in the Declaration of Helsinki. School-level information on pupil ethnicity was provided by the UK Government Department for Education and Skills. The school sampling frame included all state primary schools in London, Birmingham, and Leicester with between 15% and 50% pupils of white European origin. Two separate random samples, each of 100 schools, were taken. The first included schools in which pupils of South Asian origin comprised 20%–80% of all pupils, stratified by Indian, Pakistani, and Bangladeshi origin. The second included schools in which pupils of black African-Caribbean origin comprised 20%–80% of all pupils, stratified by African and Caribbean origin. All Head Teachers were approached by the Principal Investigator and invited to participate; 140 (70%) agreed. Non-participating schools were replaced by a school from the sampling frame with a similar ethnic mix and in the same or a neighbouring borough. The combined sample included 183 London (between 2 and 19 schools in each of 20 London boroughs), 14 Birmingham, and 3 Leicester schools. Depending on school size, either one or two classes of children were invited to participate.
The Study Research Co-ordinator visited schools in advance to explain details of the study to pupils (and parents where possible) and to answer their questions. Informed written consent was obtained from pupils' parent or guardian. A single survey team including three trained research nurses and a support fieldworker carried out all survey measurements during school terms between October 2004 and February 2007; two weekly visits were made to schools in North-West, North-East, or South London in rotation, with periodic visits to Birmingham and Leicester schools. Participating children were asked to fast overnight and provided a blood sample between 8.30 and 10.30 a.m.; breakfast was then provided. Height was measured to the last complete millimetre with a portable stadiometer (Chasmors Ltd, London, UK) and weight with an electronic digital scale (Tanita Inc, Tokyo, Japan); ponderal index (weight kg/height m3) was used because it was substantially independent of height in this study population. Waist circumference was measured at the midpoint between the lower margin of the ribs and the pelvic crest in the mid-axillary line. Right-sided skinfolds (biceps, triceps, subscapular, suprailiac) were measured; analyses are based on the sum of the four measurements. Leg to arm bioimpedance was measured using the Bodystat 1500 bioimpedance monitor (Bodystat Ltd, Isle of Man, UK); fat mass was derived using equations derived specifically for children using dual energy X-ray absorptiometry (DXA) validation [17] and presented as a fat mass index (fat mass/height5), which was independent of height. Seated blood pressure was measured twice in the right arm after 5 min of rest using an Omron 907 blood pressure recorder, with an appropriately sized cuff. A simplified assessment of pubertal status was made using Tanner scales [18]. Participating children provided questionnaire information on parental and grandparental country of birth and reported any current health problems. The parent or guardian was asked to provide information on the ethnicity of both parents and that of the child, coded using a classification similar to the 2001 UK Census, and on their occupation, coded using the National Statistics Standard Occupational Classification (SOC-2000) [19]. Ethnicity of the children was defined using the ethnicity of both parents or (if not available) the ethnicity of the child; in a small proportion of cases in which parental information was not available (1%), child information on the place of birth of parents and grandparents was used to define ethnic origin. In the analyses presented, “white European” includes children whose ethnic origin was defined as “white British,” “white Irish,” and “white European” (or a combination of these). “South Asian” includes “Indian,” “Pakistani,” “Bangladeshi,” and “Sri Lankan” (or a combination of these). “Other Asian” includes “Asian other” and “other” with a specified Asian place of origin (mainly Afghanistan, China, and Turkey). “Black African-Caribbean” includes “black African,” “black Caribbean,” “black British,” and “black other” (or a combination of these). The “other” ethnic group includes all other categories of individual and mixed ethnic origins. The ethnic subcategories “Indian,” “Pakistani,” and “Bangladeshi” include children whose parents both originated in the same county; “black African” and “black Caribbean” groups include those who originated in the same region.
All laboratory analyses were carried out blind to participant ethnicity. Analyses of HbA1c, glucose, and blood lipids were carried out in the Department of Clinical Biochemistry, Newcastle Hospitals NHS Trust, which received blood samples within 48 h of collection. Glucose was measured in plasma using the hexokinase method. HbA1c was measured in whole blood by ion exchange high performance liquid chromatography; HbA1c values were recalculated to adjust for abnormal haemoglobin variants or for increased amounts of normal variant fetal haemoglobin (HbF) where present. Triglyceride and HDL-cholesterol were measured in serum using an Olympus auto-analyser. Serum, separated and frozen on dry ice after collection, were used for measurement of insulin (Department of Medicine, University of Newcastle, UK) using an ELISA method which does not cross-react with proinsulin [20] and C-reactive protein, which was assayed by ultra-sensitive nephelometry (Dade Behring, Milton Keynes, UK). The homeostasis model assessment (HOMA) model equations were used to provide an estimate of insulin resistance [21].
Statistical Methods
Statistical analyses were carried out using STATA/SE software (Stata/SE 10 for Windows, StataCorp LP, College Station, TX, USA). All main outcome variables followed approximately log-normal distributions, and logarithmic transformation was undertaken; ethnic differences in these variables were expressed as percentages. Multilevel linear regression models fitting school as a random effect were used to take account of the natural clustering of children within school and to provide adjusted means and adjusted ethnic differences in risk markers. Tests of interaction were carried out to examine whether ethnic differences were modified by gender. Heterogeneity between ethnic subcategories within each main ethnic group was tested using likelihood ratio tests. All analyses were adjusted for age in quartiles, observer (physical measurements only), gender, and month; adiposity measures, where included for adjustment, were fitted as continuous variables.
Results
Among 8,641 pupils invited, 5,887 (68%) took part and 5,004 (85% of participants) provided blood samples; 7 children with type 1 diabetes were excluded and analyses are based on 4,796 participants (2,325 boys and 2,471 girls) who fasted overnight. The mean age of participants was 10.0 (SD 0.4) y; this did not differ between ethnic groups (p = 0.84). The study included similar numbers of children of white European, South Asian, and black African-Caribbean origin (n = 1,153, 1,306, and 1,215, respectively), with a smaller number of other Asian children (n = 294) and of other ethnic origins (n = 828). Participation rates were broadly similar among white Europeans, South Asians, other Asians, and other ethnic groups (69%, 72%, 74%, and 68%, respectively) and slightly lower among black African-Caribbeans (66%). Proportions of children providing blood samples were also higher among white Europeans, South Asians, other Asians, and other ethnic groups (88%, 87%, 86%, and 88%, respectively) and lower among black African-Caribbeans (79%). Physical measurement and blood analyte mean values are shown in Table 1 for boys and girls. Girls were slightly taller and heavier on average and had higher mean ponderal index, sum of skinfolds, fat mass index, waist circumference, fasting insulin, insulin resistance, and triglyceride levels; boys had higher levels of HDL-cholesterol and blood glucose. The mean risk factor values in the main ethnic groups are shown in Table 2 and for selected risk factors in Figure 1; differences between Asian groups and white Europeans are shown in Table 3, and differences between black African-Caribbeans and white Europeans are shown in Table 4.


Risk Factors in South Asians and Other Asians
Compared with white Europeans, South Asian children were similar in height, but lighter. They had a lower mean ponderal index and waist circumference, but their mean sum of skinfolds, fat mass index, HbA1c, fasting glucose, fasting insulin, HOMA insulin resistance, C-reactive protein and triglyceride were higher, while HDL-cholesterol levels were lower (Tables 2 and 3, Figure 1). The differences in insulin, triglyceride, HDL-cholesterol, and fat mass index differed between South Asian subcategories, being larger in Bangladeshi children than among Pakistanis and Indians, though they were present among all three ethnic subcategories (Table 3). Glucose levels followed a similar pattern, though heterogeneity between ethnic subcategories was not statistically significant (Table 3). However, while HbA1c levels were higher among all South Asian subcategories, they were least raised among Bangladeshis (Table 3). Other Asians showed similar but less marked differences (Table 3). Compared with white Europeans, they had a higher sum of skinfolds and fat mass index, while other adiposity markers were similar. Levels of HbA1c, fasting insulin, HOMA insulin resistance, triglyceride, and C-reactive protein were higher (though less so than among South Asians) and HDL-cholesterol non-significantly lower. All differences observed were similar among boys and girls (unpublished data).
Risk Factors in Black African-Caribbeans
Compared with white Europeans, black African-Caribbean children were on average markedly taller and heavier. However, their mean ponderal index, waist circumference, sum of skinfolds, and fat mass index were similar, while waist-hip ratio was slightly lower (Tables 2 and 4, Figure 1). In contrast, fasting insulin, HOMA insulin resistance, and HbA1c levels (but not fasting glucose) were higher in black African-Caribbeans (though not as high as in South Asians, particularly for insulin and insulin resistance); mean triglyceride was lower and HDL-cholesterol higher (in contrast with South Asians) (Table 4, Figure 1). Black Caribbean children tended to have higher levels of adiposity (particularly ponderal index) and higher triglyceride when compared with black Africans, while insulin, C-reactive protein, and other risk markers did not differ markedly between these groups (Table 4). All differences observed were similar among boys and girls (unpublished data).
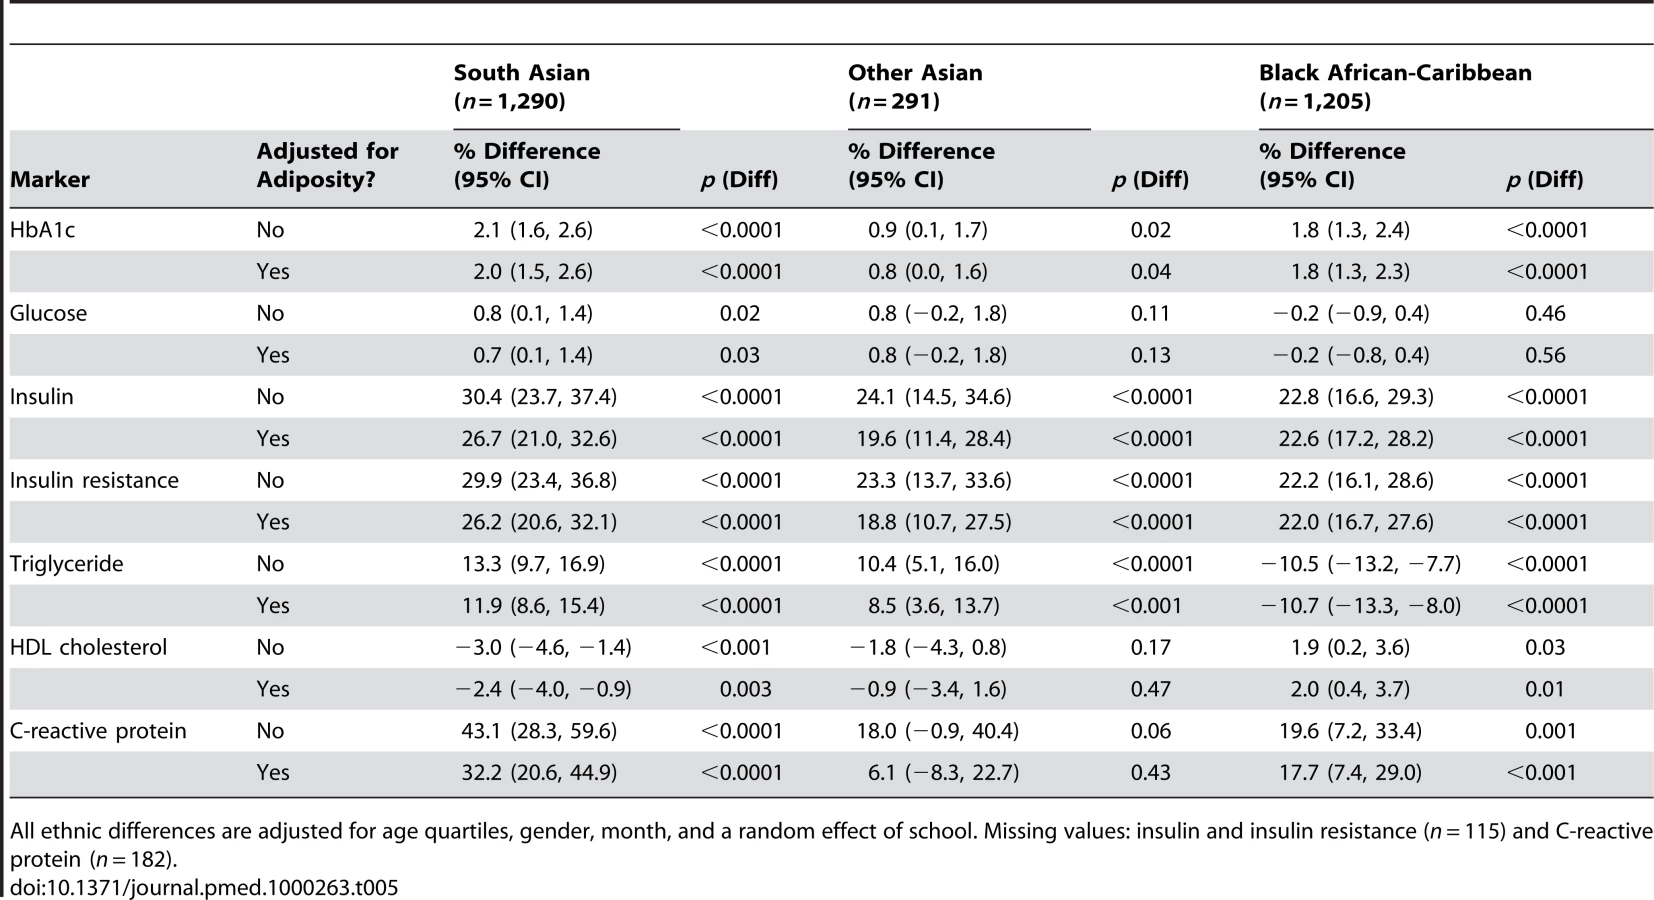
Effect of Adjustment for Adiposity
The effect of adjustment for adiposity (particularly for sum of skinfolds and fat mass index) on ethnic differences in insulin and glucose, blood lipids, and C-reactive protein was examined (Table 5). For South Asians, such adjustment had little effect on the size of HbA1c and glucose differences. Differences in fasting insulin, insulin resistance, triglyceride, HDL-cholesterol, and C-reactive protein were slightly reduced in size, but all remained strongly statistically significant. The pattern for other Asians was very similar, except that in this considerably smaller group adjustment for adiposity reduced the more modest initial differences in HDL-cholesterol and C-reactive protein markedly. For black African-Caribbeans, differences in HbA1c, insulin, insulin resistance, triglyceride, and HDL-cholesterol were not materially affected by adjustment for adiposity. The inclusion of other adiposity measures (particularly ponderal index and waist circumference) in adjustment reduced, rather than increased, the impact of adjustment for adiposity. The addition of C-reactive protein to adiposity adjustments (sum of skinfolds and fat mass index) for insulin, glucose, and blood lipids made no material difference to the results observed.
Supplementary Analyses
The ethnic differences in HbA1c observed were not affected by the exclusion of children with abnormal haemoglobin variants or with increased amounts of normal variant fetal haemoglobin (HbF). The characteristics of participating children with complete fasting measurements (age, gender, social class, height, adiposity) were similar to those of children without such measurements. Additional adjustment for parental social class (related to height but not consistently to the other risk markers studied) had no appreciable effect on the ethnic differences observed (Tables S1, S2). Analyses which made adjustment for pubertal status or excluded children who showed evidence of pubertal development had no material effect on the ethnic differences observed. The ethnic differences in C-reactive protein levels were unaffected by the exclusion of children reporting a current health problem.
Discussion
There is growing evidence that the higher prevalences of type 2 diabetes in ethnic minority groups (particularly South Asians) are apparent in young people as well as in middle age, both in the UK [14] and in the US [22],[23]. The present study extends these observations and preliminary findings in small numbers of South Asian (predominantly Pakistani) children and adolescents [15],[16],[24],[25] by demonstrating (for the first time in South Asian diaspora populations) that ethnic group differences in type 2 diabetes precursors are present in apparently healthy children at the end of the first decade. South Asian children have higher levels of HbA1c, insulin, triglyceride, and C-reactive protein and lower levels of HDL-cholesterol; the differences are particularly marked among children of Bangladeshi origin. The study also provides novel information on the risk profiles of UK black African-Caribbean children, who have higher levels of HbA1c, insulin, C-reactive protein, and (paradoxically) HDL-cholesterol, with lower levels of triglyceride. These patterns (particularly for insulin resistance) are consistent with differences between African-American and white European origin children in the US, both in the Bogalusa Heart Study [26] and in the nationwide NHANES Study [27].
The emerging differences in hyperglycaemia and insulin resistance correspond closely with established UK adult patterns of type 2 diabetes risk, markedly increased among South Asians and moderately increased among black African-Caribbeans; information on other Asian adults in the UK is very limited [2],[3],[5],[10]. The particularly marked insulin resistance observed among Bangladeshi children is consistent with the very high rates of type 2 diabetes among Bangladeshi adults [3]–[5]. Patterns of triglyceride and HDL-cholesterol (high-low in South Asians, low-high in black African-Caribbeans) are consistent with patterns observed in the respective UK adult populations [3]–[5] and (in the case of black African-Caribbeans) with patterns in African Americans in the US [28]; the different triglyceride and HDL-cholesterol patterns are clearly distinct from patterns of hyperglycaemia and insulin resistance, as previously noted [29]. The increased levels of C-reactive protein observed in both South Asians and black African-Caribbeans (associated with insulin resistance and the metabolic syndrome in both adults and children [7],[30]) are more consistent with the hyperglycaemia and insulin resistance observed in these children, and with the high levels of C-reactive protein reported in UK South Asian adults [3],[6],[8]. However, they are less consistent with levels in UK black African-Caribbean adults, which tend to be lower than in white Europeans [11].
The present study was designed to be sufficiently large to detect even modest (0.2 SD) differences in risk markers between major ethnic groups, and to include balanced representation of South Asian children of Indian, Pakistani, and Bangladeshi origin, and of black African-Caribbean children of African and Caribbean origin, sampled randomly from the eligible populations. The study included children from three UK cities which together account for more than two-thirds of all South Asians and black African-Caribbeans living in the UK. Inclusion of children of both white European and ethnic minority origin within all schools ensured that ethnic comparisons were carried out on a within-school basis. Classification of ethnicity was based primarily on self-reported parental ethnicity, which agreed closely with ethnicity defined using other approaches, particularly parental and grand-parental place of origin. Although the overall response rates (particularly for blood sampling) were only moderate, they were comparable with or higher than those in many previous studies [3],[5],[31]; the characteristics of respondents who provided complete data were not appreciably different from those respondents who did not. Response rates were, however, similar in all ethnic groups except black African-Caribbeans, and are not likely to have accounted for the risk marker patterns observed. It was particularly striking that the most marked risk factor differences occurred in South Asians and white Europeans, groups with very similar response rates. Ethnic differences in characteristics such as height between the ethnic groups (black African-Caribbeans markedly taller, South Asians shorter) are entirely consistent with those reported in earlier national surveys [3],[4],[32], supporting the representativeness of the population studied.
The ethnic differences in HbA1c, insulin, triglyceride, and C-reactive protein and lower levels of HDL-cholesterol observed in the present study did not appear to be accounted for by ethnic differences in adiposity, or by the influence of socioeconomic status. Most previous UK studies examining adiposity patterns in children from different ethnic groups have measured weight-for-height indices (particularly body mass index) [3],[4],[33], which appears to be unreliable for ethnic group comparisons [34]. In the present study, a wider range of adiposity markers suitable for school-based survey use were included, among which skinfold thickness measurements and bioelectrical impedance are particularly valuable for adiposity assessment [35]. Using these measurements, it appeared that South Asian children had higher levels of overall adiposity, a finding consistent with the results of a previous study using DXA measurements in slightly older children [36]. However, taking account of ethnic differences in adiposity defined by these measurements had little or no effect on the ethnic differences in insulin and other metabolic markers; additional adjustment for C-reactive protein (suggested to be a marker of adiposity complementary to anthropometric measurements [37]) had no additional effect. While further studies using gold standard adiposity markers are needed, the results suggest that the ethnic differences in diabetes precursors do not solely reflect ethnic differences in adiposity, consistent with earlier reports both in South Asians [15],[16] and in African Americans [38]. Earlier investigators have emphasized the potential importance of socioeconomic status in explaining ethnic differences in chronic disease risk [39]. In the present study population, socio-economic status, though positively related to height, was not consistently associated with the diabetes precursors measured. The absence of consistent associations between socioeconomic status and diabetes precursors in childhood is entirely consistent with reports from earlier UK studies [40],[41] and suggests that socioeconomic factors are not responsible for these emerging ethnic differences.
The ethnic differences in childhood insulin, triglyceride, HbA1c, and C-reactive protein levels observed here, though smaller (both relatively and absolutely) than those reported in adults [2],[3],[42], are appreciable in size (respectively, 30%, 13%, 2%, and 43% differences between South Asians and white Europeans). The results imply that ethnic differences in type 2 diabetes in the UK, originally described in first generation immigrants, are persisting in UK-born South Asian and black African-Caribbean immigrants (more than 80% of study participants in all the main ethnic groups in the present study were UK born). They also suggest that at least some of the aetiological factors responsible for ethnic differences in insulin resistance and type 2 diabetes are operating well before adult life, potentially offering opportunities for early prevention. The observations could be relevant not only in the UK but in other settings in which ethnic differences in type 2 diabetes emerge at an early age. In the United States, for example, high risks of type 2 diabetes are apparent in African Americans and Asian Americans in the second decade of life [13],[22],[23]. Relevant exposures could be operating in childhood, in infancy, or in fetal life [12], though the contributions of specific exposures may well differ between specific ethnic groups. Lower levels of physical activity in childhood could be important, particularly among South Asians [43]; childhood diet could also be relevant. Ethnic differences in early postnatal growth could play an important role [44]. Fetal undernutrition and low birth weight are related to type 2 diabetes risk [45] and are highly prevalent among UK South Asians (particularly Bangladeshis) [46]. Fetal undernutrition could lead to ethnic differences in body composition and insulin resistance very early in life [47], though this has not yet been examined in UK South Asians. Ethnic differences in maternal factors influencing type 2 diabetes risk in offspring (particularly maternal obesity and gestational hyperglycaemia) [48],[49] could also play an important role.
The implications of the results for prevention require careful consideration. The new epidemic of early onset type 2 diabetes occurring in many Western societies affects all sections of the population [50], and key preventive measures in childhood (particularly directed to increasing physical activity levels, improving dietary nutrient content, and preventing overweight and obesity) are likely to be widely desirable [50]. However, there is a particularly urgent need for preventive measures in high-risk ethnic groups [1],[14], in which the benefits of prevention are potentially greater [51]. Since such prevention includes educational elements, it is likely to address culturally sensitive issues. Such interventions may therefore need to be specifically tailored to the needs of particular ethnic groups [52].
Supporting Information
Zdroje
1. ChanJC
MalikV
JiaW
KadowakiT
YajnikCS
2009 Diabetes in Asia: epidemiology, risk factors, and pathophysiology. JAMA 301 2129 2140
2. McKeiguePM
ShahB
MarmotMG
1991 Relation of central obesity and insulin resistance with high diabetes prevalence and cardiovascular risk in South Asians. Lancet 337 382 386
3. Health Survey for England 2004 2006 The health of ethnic minority groups London The Information Centre
4. ErensB
PrimatestaP
Prior G Health Survey for England 2001 The Health of Ethnic Minority Groups '99 London The Stationery Office
5. BhopalR
UnwinN
WhiteM
YallopJ
WalkerL
1999 Heterogeneity of coronary heart disease risk factors in Indian, Pakistani, Bangladeshi, and European origin populations: cross sectional study. BMJ 319 215 220
6. ForouhiNG
SattarN
McKeiguePM
2001 Relation of C-reactive protein to body fat distribution and features of the metabolic syndrome in Europeans and South Asians. Int J Obes Relat Metab Disord 25 1327 1331
7. LaaksonenDE
NiskanenL
NyyssonenK
PunnonenK
TuomainenTP
2004 C-reactive protein and the development of the metabolic syndrome and diabetes in middle-aged men. Diabetologia 47 1403 1410
8. ChambersJC
EdaS
BassettP
KarimY
ThompsonSG
2001 C-reactive protein, insulin resistance, central obesity, and coronary heart disease risk in Indian Asians from the United Kingdom compared with European whites. Circulation 104 145 150
9. WildSH
FischbacherC
BrockA
GriffithsC
BhopalR
2007 Mortality from all causes and circulatory disease by country of birth in England and Wales 2001-2003. J Public Health (Oxf) 29 191 198
10. ChaturvediN
McKeiguePM
MarmotMG
1994 Relationship of glucose intolerance to coronary risk in Afro-Caribbeans compared with Europeans. Diabetologia 37 765 772
11. HealdAH
AndersonSG
IvisonF
LaingI
GibsonJM
2003 C-reactive protein and the insulin-like growth factor (IGF)-system in relation to risk of cardiovascular disease in different ethnic groups. Atherosclerosis 170 79 86
12. KuhD
Ben-ShlomoY
2004 A life course approach to chronic disease epidemiology. 2nd edition ed Oxford Oxford University Press
13. LiuLL
YiJP
BeyerJ
Mayer-DavisEJ
DolanLM
2009 Type 1 and type 2 diabetes in Asian and Pacific Islander U.S. youth: the SEARCH for diabetes in youth study. Diabetes Care 32 Suppl 2 S133 S140
14. EhtishamS
HattersleyAT
DungerDB
BarrettTG
2004 First UK survey of paediatric type 2 diabetes and MODY. Arch Dis Child 89 526 529
15. WhincupPH
GilgJA
PapacostaO
SeymourC
MillerGJ
2002 Early evidence of ethnic differences in cardiovascular risk: cross sectional comparison of British South Asian and white children. BMJ 324 635
16. WhincupPH
GilgJA
OwenCG
OdokiK
AlbertiKG
2005 British South Asians aged 13–16 years have higher fasting glucose and insulin levels than Europeans. Diabet Med 22 1275 1277
17. ClaseyJ
BradleyK
BradleyJ
LongD
2007 A new BIA equation estimating the body composition of young children. Obesity 15 Supplement A127
18. TannerJM
1962 Growth at adolescence. 1st edition Oxford Blackwell Scientific
19. Office for National Statistics About the Standard Occupational Classification (SOC2000). Available: http://www.ons.gov.uk/about-statistics/classifications/current/SOC2000/about-soc2000/index.html. Accessed 25 February 2010
20. AndersenL
DinesenB
JorgensenPN
PoulsenF
RoderME
1993 Enzyme immunoassay for intact human insulin in serum or plasma. Clin Chem 39 578 582
21. LevyJC
MatthewsDR
HermansMP
1998 Correct homeostasis model assessment (HOMA) evaluation uses the computer program. Diabetes Care 21 2191 2192
22. Mayer-DavisEJ
BeyerJ
BellRA
DabeleaD
D'AgostinoRJr
2009 Diabetes in African American youth: prevalence, incidence, and clinical characteristics: the SEARCH for Diabetes in Youth Study. Diabetes Care 32 Suppl 2 S112 S122
23. BellRA
Mayer-DavisEJ
BeyerJW
D'AgostinoRBJr
LawrenceJM
2009 Diabetes in non-Hispanic white youth: prevalence, incidence, and clinical characteristics: the SEARCH for Diabetes in Youth Study. Diabetes Care 32 Suppl 2 S102 S111
24. CookDG
MendallMA
WhincupPH
CareyIM
BallamL
2000 C-reactive protein concentration in children: relationship to adiposity and other cardiovascular risk factors. Atherosclerosis 149 139 150
25. EhtishamS
CrabtreeN
ClarkP
ShawN
BarrettT
2005 Ethnic differences in insulin resistance and body composition in United Kingdom adolescents. J Clin Endocrinol Metab 90 3963 3969
26. SvecF
NastasiK
HiltonC
BaoW
SrinivasanSR
1992 Black-white contrasts in insulin levels during pubertal development. The Bogalusa Heart Study. Diabetes 41 313 317
27. FordES
LiC
ImperatoreG
CookS
2006 Age, sex, and ethnic variations in serum insulin concentrations among U.S. youth: findings from the National Health and Nutrition Examination Survey 1999–2002. Diabetes Care 29 2605 2611
28. LiC
FordES
MengYX
MokdadAH
ReavenGM
2008 Does the association of the triglyceride to high-density lipoprotein cholesterol ratio with fasting serum insulin differ by race/ethnicity? Cardiovasc Diabetol 7 4
29. ZorattiR
GodslandIF
ChaturvediN
CrookD
CrookD
2000 Relation of plasma lipids to insulin resistance, nonesterified fatty acid levels, and body fat in men from three ethnic groups: relevance to variation in risk of diabetes and coronary disease. Metabolism 49 245 252
30. FordES
AjaniUA
MokdadAH
2005 The metabolic syndrome and concentrations of C-reactive protein among U.S. youth. Diabetes Care 28 878 881
31. BaranowskiT
CooperDM
HarrellJ
HirstK
KaufmanFR
2006 Presence of diabetes risk factors in a large U.S. eighth-grade cohort. Diabetes Care 29 212 217
32. HardingS
MaynardM
CruickshankJK
GrayL
2006 Anthropometry and blood pressure differences in black Caribbean, African, South Asian and white adolescents: the MRC DASH study. J Hypertens 24 1507 1514
33. HardingS
TeyhanA
MaynardMJ
CruickshankJK
2008 Ethnic differences in overweight and obesity in early adolescence in the MRC DASH study: the role of adolescent and parental lifestyle. Int J Epidemiol 37 162 172
34. World Health Organization Expert Consultation 2004 Appropriate body-mass index for Asian populations and its implications for policy and intervention strategies. Lancet 363 157 163
35. WellsJC
FewtrellMS
2006 Measuring body composition. Arch Dis Child 91 612 617
36. ShawNJ
CrabtreeNJ
KibirigeMS
FordhamJN
2007 Ethnic and gender differences in body fat in British schoolchildren as measured by DXA. Arch Dis Child 92 872 875
37. OdaE
2007 CRP may be superior to anthropometric markers of obesity. Circ J 71 1332 1333
38. KleinDJ
AronsonFL
HarlanWR
BartonBA
SchreiberGB
2004 Obesity and the development of insulin resistance and impaired fasting glucose in black and white adolescent girls: a longitudinal study. Diabetes Care 27 378 383
39. BhopalR
HayesL
WhiteM
UnwinN
HarlandJ
2002 Ethnic and socio-economic inequalities in coronary heart disease, diabetes and risk factors in Europeans and South Asians. J Public Health Med 24 95 105
40. WhincupPH
CookDG
AdsheadF
TaylorS
PapacostaO
1996 Cardiovascular risk factors in British children from towns with widely differing adult cardiovascular mortality. BMJ 313 79 84
41. BattyGD
LeonDA
2002 Socio-economic position and coronary heart disease risk factors in children and young people. Evidence from UK epidemiological studies. Eur J Public Health 12 263 272
42. BarbatoA
CappuccioFP
FolkerdEJ
StrazzulloP
SampsonB
2004 Metabolic syndrome and renal sodium handling in three ethnic groups living in England. Diabetologia 47 40 46
43. OwenCG
NightingaleCM
RudnickaAR
CookDG
EkelundU
2009 Ethnic and gender differences in physical activity levels among 9–10-year-old children of white European, South Asian and African-Caribbean origin: the Child Heart Health Study in England (CHASE Study). Int J Epidemiol 38 1082 1093
44. BansalN
AyoolaOO
GemmellI
VyasA
KoudsiA
2008 Effects of early growth on blood pressure of infants of British European and South Asian origin at one year of age: the Manchester children's growth and vascular health study. J Hypertens 26 412 418
45. WhincupPH
KayeSJ
OwenCG
HuxleyR
CookDG
2008 Birth weight and risk of type 2 diabetes: a systematic review. JAMA 300 2886 2897
46. MoserK
StanfieldKM
LeonDA
2008 Birthweight and gestational age by ethnic group, England and Wales 2005: introducing new data on births. Health Stat Q 22 55
47. YajnikCS
LubreeHG
RegeSS
NaikSS
DeshpandeJA
2002 Adiposity and hyperinsulinemia in Indians are present at birth. J Clin Endocrinol Metab 87 5575 5580
48. FranksPW
LookerHC
KobesS
TougerL
TataranniPA
2006 Gestational glucose tolerance and risk of type 2 diabetes in young Pima Indian offspring. Diabetes 55 460 465
49. MetzgerBE
LoweLP
DyerAR
TrimbleER
ChaovarindrU
2008 Hyperglycemia and adverse pregnancy outcomes. N Engl J Med 358 1991 2002
50. Fagot-CampagnaA
PettittDJ
EngelgauMM
BurrowsNR
GeissLS
2000 Type 2 diabetes among North American children and adolescents: an epidemiologic review and a public health perspective. J Pediatr 136 664 672
51. HallLML
SattarN
GillJMR
2008 Risk of metabolic and vascular disease in South Asians: potential mechanisms for increased insulin resistance. Future Lipidology 3 411 424
52. MaynardMJ
BakerG
RawlinsE
AndersonA
HardingS
2009 Developing obesity prevention interventions among minority ethnic children in schools and places of worship: The DEAL (Diet and Active Living) study. BMC Public Health 9 480
Štítky
Interní lékařstvíČlánek vyšel v časopise
PLOS Medicine
2010 Číslo 4
- Alternativní léčebné možnosti u hypercholesterolemie při intoleranci statinů
- Vliv kombinace nutraceutik na remodelaci levé komory srdeční u osob s metabolickým syndromem
- Nutraceutika a jejich ovlivnění mírného kardiometabolického rizika
- Princip účinku medu v léčbě chronických i infikovaných ran
- Superoxidovaný roztok a jeho využití v léčbě ran
Nejčtenější v tomto čísle
- Preoperative/Neoadjuvant Therapy in Pancreatic Cancer: A Systematic Review and Meta-analysis of Response and Resection Percentages
- Economic Appraisal of Ontario's Universal Influenza Immunization Program: A Cost-Utility Analysis
- China's Engagement with Global Health Diplomacy: Was SARS a Watershed?
- Laboratory Capacity Building in Asia for Infectious Disease Research: Experiences from the South East Asia Infectious Disease Clinical Research Network (SEAICRN)