
Oral tetrahydrouridine and decitabine for non-cytotoxic epigenetic gene regulation in sickle cell disease: A randomized phase 1 study
In a clinical trial, Yogen Saunthararajah and colleagues target DNA methyltransferase with small molecules to reactivate fetal hemoglobin which inhibits polymerisation of mutated sickle cell hemoglobin.
Published in the journal:
. PLoS Med 14(9): e32767. doi:10.1371/journal.pmed.1002382
Category:
Research Article
doi:
https://doi.org/10.1371/journal.pmed.1002382
Summary
In a clinical trial, Yogen Saunthararajah and colleagues target DNA methyltransferase with small molecules to reactivate fetal hemoglobin which inhibits polymerisation of mutated sickle cell hemoglobin.
Introduction
Sickle cell disease (SCD) is a congenital hemolytic anemia caused by polymerization and precipitation of mutated sickle hemoglobin (HbS, α2βS2) in red blood cells (RBCs). This decreases RBC life span by >90%, causing severe anemia. The unhealthy RBCs also adhere to and occlude blood vessels. Ensuing tissue hypoxia damages all organs, triggers severe pain, and compromises immunity. In low-income countries, most children with SCD do not survive to adulthood. Even in high-income countries, morbidity can be severe and life spans are reduced by several decades—the median life expectancy for people with SCD in the United States is approximately 45 years [1,2].
RBCs at the fetal stage of life contain fetal hemoglobin (HbF, α2γ2). Normal adult hemoglobin (HbA, α2β2) polymerizes with HbS, while HbF intercalates with but does not polymerize with HbS [3–5]. HbF thus interrupts SCD pathophysiology at its inception [3,4], and higher HbF correlates with fewer vaso-occlusive pain crises, less renal damage, less pulmonary hypertension, fewer strokes, and longer survival [1,6–12] (reviewed in [5]). That is, any increase in HbF provides some benefit. Those few SCD patients who inherit HbF at 20%–30% of total hemoglobin (hereditary persistence of fetal hemoglobin, HPFH) have essentially normal life spans [13–15]. Decades of research has hence been directed towards pharmacologic recapitulation of this naturally selected protective state [5]. A key observation directing early efforts was that HbF is enriched during bone marrow recovery from extreme stress [16–21]. Cytotoxic (cell killing) drugs can create such stress, leading to evaluation in SCD of the oral ribonucleotide reductase inhibitor hydroxyurea [20–22]. In a pivotal trial, hydroxyurea (15–35 mg/kg) increased HbF for 2 years in approximately 50% of the adult SCD patients treated [22,23]. HbF induction correlated strongly with increased RBC half-life [24,25], fewer pain crises [23], and better quality of life [26]. Trial patients with HbF levels >0.5 g/dL survived longer [8]. Average HbF increases at 2 years, however, were modest (3.6%) [20–23,27]. Moreover, HbF increases were particularly unlikely in patients with the lowest baseline HbF levels and thus at highest risk of morbidity and mortality [23,25,28,29], and even patients with excellent initial HbF inductions demonstrated diminishing inductions over time [23,30]. Lower and less durable HbF increases also correlated with fewer reticulocytes (<300,000 × 109/L) and neutrophils (<7.5 × 10⁹/L) at baseline. This correlation underscores that HbF induction by cytotoxicity requires reserves of hematopoietic precursors sufficient to repeatedly mount recoveries from bone marrow stress that destroys their counterparts [21,23]. Cumulative attrition of these reserves occurs via vaso-occlusion in the marrow and to the kidneys [23,25,28,29]. This is a problem even separate from considerations of sustainable HbF induction via cytotoxicity: in SCD, erythropoiesis has to operate at >10-fold the normal rate to barely sustain hemoglobin levels compatible with life, and dwindling compensatory capacity is a major cause of early death [8,23,31,32]. Therefore, new, non-cytotoxic, durable, and more potent methods of inducing HbF are needed.
The chromatin-modifying enzyme DNA methyltransferase 1 (DNMT1) maintains methylation marks on DNA through cell division. DNMT1 is also a corepressor—it executes the biochemical work of silencing genes for sequence-specific DNA-binding factors, e.g., BCL11A and TR2/TR4, that direct epigenetic silencing of the HbF gene (γ-globin, HBG) [33–45]. The deoxycytidine analog decitabine can deplete DNMT1—a nitrogen substituted for a carbon in the decitabine pyrimidine ring covalently binds to DNMT1 and causes its degradation [46]. Importantly, the decitabine deoxyribose moiety is unmodified; thus, it can incorporate into the elongating DNA strand during S-phase without terminating chain extension or causing cytotoxicity [47,48]. High concentrations of decitabine, however, do produce off-target anti-metabolite effects and cytotoxicity, in significant part via the uridine moiety degradation products that can misincorporate into DNA or inhibit thymidylate synthase [49,50]. Decitabine regimens approved by the US Food and Drug Administration (FDA) for the treatment of myeloid cancer, having evolved out of the traditional cytotoxic intent of oncology, utilize such cytotoxic doses and require pulse-cycled administration to recover from cytotoxic side effects. We therefore redesigned decitabine application for non-cytotoxic, molecularly-targeted therapy of non-malignant and malignant diseases [43,51–54]. Specifically, we selected demonstrably non-cytotoxic yet DNMT1-depleting doses, used a subcutaneous route of administration to blunt Cmax, and administered these doses frequently and in distributed fashion (2–3X/week) to increase the fraction of target cells exposed in S-phase, as DNMT1-depletion by decitabine is S-phase–dependent [43,51–54]. This approach increased HbF by >10% in SCD patients who had no HbF response to hydroxyurea in the pivotal clinical trial (i.e., a mean change in HbF after 2 years of treatment with hydroxyurea of 0.3%) [42,43,55]. Hindering wide clinical application of decitabine in this way, however, are a number of limitations with its pharmacology: it has a very brief plasma half-life of only minutes [56,57] (a problem since DNMT1-depletion is S-phase, and hence exposure-time, dependent); has negligible solid tissue distribution (a problem when target cells reside in solid tissues, e.g., erythroid precursors in the spleen in β-thalassemia); and hence also has negligible oral bioavailability (a problem for worldwide and long-term therapy). These pharmacology problems have a common cause: rapid deamination/inactivation of decitabine to uridine degradation products by the pyrimidine metabolism enzyme cytidine deaminase (CDA) that is highly expressed in tissues such as the intestines and liver [58–62].
Thus, we combined a CDA inhibitor, oral tetrahydrouridine (THU), with oral decitabine: THU is a uridine analog competitive inhibitor of CDA that, although not FDA-approved for any indication (new chemical entity), has not caused toxicity to animals or to humans in several clinical trials, including a trial with oral administration exceeding a year [40,59–61,63–69]. Here, building on encouraging results from pre-clinical in vivo studies [70], we report the first-in-human clinical translation of oral THU–decitabine for HbF induction in SCD. Specific goals were to evaluate safety of oral THU–decitabine and recommend a phase 2 dose for DNMT1-depletion and HbF induction in SCD [70].
Materials and methods
Ethics statement
All research involving human participants was approved by the Cleveland Clinic and University of Illinois at Chicago Institutional Review Boards (IRBs), and all clinical investigation was conducted according to the principles expressed in the Declaration of Helsinki. Written informed consent was obtained from the participants on the IRB approved protocol. The protocol number was Case 10z11. The United States FDA Investigational New Drug number is 112,914.
Study design
This was a single-blind dose-escalating phase 1 clinical trial with a maximum of 5 decitabine dose levels. Five patients were enrolled at each dose level, randomized with 3 : 2 odds to study drugs versus placebo (5 cohorts of 5 randomized patients).
This design was not altered during the course of the study.
Patient population
Written informed consent was obtained prior to treatment in all patients. The treatment population was adult (≥18 years of age) SCD (SS or S-β-thalassemia) patients who despite standard-of-care hydroxyurea for ≥6 months (or being intolerant or unwilling to take hydroxyurea) were at risk of early death as defined by published criteria [8]. These criteria were at least 1 of the following: (i) HbF <0.5 g/dL, (ii) 3 or more pain episodes per year requiring parenteral narcotics, (iii) 1 or more acute chest syndrome episodes, and (iv) total hemoglobin <9 g/dL and absolute reticulocyte count ≤250,000 × 109/L.
Interventions
Decitabine and THU were synthesized by Ash Stevens (Detroit, MI). Drugs were stored in glass bottles at −20°C. Bottles were opened after equilibration to room temperature. The appropriate amount of drug was weighed out and reconstituted with water for consumption by patients in the clinic within 30 minutes of drug reconstitution. Placebo was an equivalent amount of water without study drug.
Fixed-dose oral THU 10 mg/kg was administered 60 minutes before oral decitabine at 0.01, 0.02, 0.04, 0.08, or 0.16 mg/kg (Figs 1, 2A and 2B). Repeat dose administration 2X/week for 8 weeks, instead of single dose administration, was used to assess safety and efficacy—to increase the likelihood that the dose identified for further studies would be safe and efficacious for the intended application of chronic disease modification (Fig 2A and 2B).


Patients at each dose level were monitored weekly to determine if next treatments should be withheld based on laboratory endpoints; in previous clinical trials, the most sensitive indices of decitabine biologic activity were an increase in the platelet count and a decrease in the absolute neutrophil count (ANC). The plan was to use threshold values of these parameters not associated with clinical toxic events, being within the range observed in patients with SCD during their routine care with hydroxyurea and/or splenectomy, to trigger dose modification, and thereby maintain safety [43,51]. These thresholds were ANC <1.5 × 10⁹/L and platelets >1,200 × 109/L. Non-hematologic toxicity ≥grade 3 attributed to study drug was also to trigger a dose modification, as was decitabine Cmax > 0.2 μM. Drug was to be held until recovery below these thresholds, when drug was to be restarted with a 25% decrease in dose.
Concurrent hydroxyurea therapy was explicitly disallowed, with a requirement for a 28-day washout period from the last hydroxyurea dose to initiation of study drug or placebo.
Outcomes
The primary endpoint was ≥ grade 3 non-hematologic toxicity. In addition, the a priori study design required dose modification for platelets >1,200 × 109/L, or neutrophils <1.5 × 10⁹/L. Our goal was to provide evidence in favor of a null hypothesis that patients in treated groups (oral THU-decitabine 2X/week over 8 weeks; n = 15) do not experience treatment-related events requiring dose modification more than patients in the placebo group (n = 10). Secondary endpoints included (i) sickle cell crisis frequency (efficacy), (ii) coagulation (D-dimer) and inflammatory (C-reactive protein [CRP]) pathway activity (efficacy), (iii) HbF levels measured by high-performance liquid chromatography (HPLC) (efficacy and pharmacodynamics of decitabine), (iv) DNA methylation levels at repetitive elements in buffy coat DNA (pharmacodynamics of decitabine), and (v) DNMT1 levels in buffy coat cells (pharmacodynamics of decitabine). A priori secondary endpoints not measured for cost and technical reasons were CDA genotype and CDA functional activity in serum.
Sample size
The study employed a randomized design to identify an oral dose of decitabine that can be administered twice a week in combination with oral THU over an 8-week period without requiring dose modification. We used a standard 3+3 dose escalation design with at most 5 dose levels. There would thus have been 6 in the maximum dose group if a dose-limiting toxicity had been detected. Such a 6-patient group would have detected at least 1 toxicity with a probability of 0.88 if it occurred in 30% of the population; this value is calculated as 1 minus the probability of zero toxicities, i.e., 1 − 0.76. Ten patients were treated with placebos, 2 at each dose level, so the maximum sample size was 15 + 10 = 25. If a dose modification was required because of ANC < 1.5 × 10⁹/L or platelets > 1200 × 109/L or ≥ grade 3 non-hematologic toxicity attributed to the study drug, in 1 or more of the 3 patients who received the study drug at a dose-level cohort, the plan was to accrue another cohort of 5 new patients (3 : 2 study-drug:placebo) with the treatment dose based on the cumulative dose administered to patients receiving the study drug in the preceding cohort. The Safety and Intent-To-Treat (ITT) populations included all enrolled patients receiving at least one dose of decitabine.
Randomization procedures
Randomization was at the University of Illinois at Chicago by Dr. Michael Pacini using a randomization table created on www.randomization.com. Patients were randomly allocated to study drug treatment versus placebo.
Blinding
Patients, but not investigators, were blinded as to the assigned treatment. The experimental treatment was highly diluted in water. Therefore, the method of patient blinding was administration of water placebo with similar appearance, volume, and taste as the study drug.
Pharmacokinetics
Blood was collected for pharmacokinetic analysis at 0, 2, 4, and 24 hours after the first decitabine dose (week 1). Blood samples were drawn over a period of less than 1 minute into tubes pre-loaded with heparin and THU 10 μg/ml (to prevent in vitro metabolism by CDA) and immediately transferred onto ice. Samples were then centrifuged as soon as possible at 600 g for 5 minutes at 4°C. After separation, plasma was transferred in 0.2 ml aliquots into pre-frozen vials and stored frozen at −80°C until shipment to Ohio State University for analysis (shipment on dry ice) by a liquid chromatography tandem mass spectrometry (LCMS/MS) method that has been previously described in detail for determination of decitabine in human, baboon, mouse, and rat plasma [56,57,70]. Pharmacokinetic data were analyzed using non-compartmental methods or a 2-compartment model with instantaneous/intravenous input using the R package PKLMfit. The model-fitting method allowed estimation of terminal half-lives for some data sets. The AUClast (the area under the curve from the time of dosing to the last measurable concentration) was calculated by the linear trapezoidal method.
DNMT1 protein measurement by flow cytometry of peripheral blood mononuclear cells (pharmacodynamic analyses)
Phlebotomized whole blood was layered over Histopaque. The interface was collected and washed with phosphate-buffered saline (PBS). Cell suspensions of approximately 200,000 cells were fixed with 4% paraformaldehyde for 30 minutes on ice. Cells were spun down, washed in PBS, and suspended in 70% ethanol and stored at −20°C for subsequent batched analyses. For analyses, patient samples were thawed and centrifuged. All procedures were performed on ice and all centrifugations were done at 400 g for 5 minutes at 4°C. The pellet was hydrated overnight in 1 ml sterile, distilled water to partially reverse the alcohol fixation. After incubation, samples were centrifuged and then resuspended in 1 ml PBS/2% bovine serum albumin (BSA) and incubated for 30 minutes to block nonspecific antibody binding. Following centrifugation, unlabeled anti-DNMT1 antibody [EPR 3522] (0.0625 μg/test; Abcam; catalog no. ab92314) was added in a final volume of 100 μl and incubated for 1 hour. Samples were washed 3 times: each wash was a 10-minute incubation with 1 ml PBS/2% BSA followed by centrifugation. After the third wash, CD64-Alexa Fluor 488 (5 μl/test; BioLegend; catalog no. 305010), Cyclin A2-PE (4μl/test; Beckman Coulter; catalog no. B15092), CD33-APC/Cy7 (5 μl/test; BioLegend; catalog no. 366614), and F(ab′)2-goat anti-rabbit IgG (H+L) Alexa Fluor 647 (0.0938 μg/test; Life Technologies; catalog no. A21246) were added in a final volume of 100 μl and incubated for 1 hour. After the incubation and without washing, 3.5 ml PBS containing 0.5 μg/ml DAPI was added to each sample. All samples were analyzed on an Attune NxT Acoustic Focusing Cytometer (Life Technologies) at a flow rate of 500 μl per minute. Compensation was performed with CompBeads Set Anti-Mouse Ig, κ (BD Biosciences; catalog no. 552843) and Flow Cytometry Protein G Antibody Binding Beads (Bangs Laboratories, Inc.; catalog no. 554/11863).
Data analysis
Data were normalized to the instrument using 8-peak SPHERO Rainbow Calibration Particles (Spherotech; catalog no. RCP-30-5A). WinList 3D v8.0 (Verity Software House) was used for post-acquisition analysis. Doublet discrimination was performed using the DAPI area and peak signals. Gated singlet events were displayed in a bivariate plot of cyclin A2 versus DNA content to identify S + G2 + M phase cells as both cyclin A2 positive and >2C DNA. These color-evented cells were used as a guide to set the boundary between DNMT1 positive and negative events. The median DNMT1-negative value was subtracted from the median DNMT1-positive value. This net value was further processed by normalization using linear regression of 8 peak bead sets between runs performed on different days.
Methylation level of LINE-1 repetitive element CpG by pyrosequencing
DNA was purified from peripheral blood mononuclear cells (isolated by Ficoll-Hypaque density centrifugation) using the Wizard Genomic DNA Purification Kit (Promega). DNA was bisulfite-converted using EZ DNA Lightning Methylation kit (Zymo Research). The PCR primers were 10 pmol of 5′ - TTTTTTGAGTTAGGTGTGGG-3′ and 10 pmol of biotinylated-5′-TCTCACTAAAAAATACCAAAC-3′. PCR cycling conditions were: cycle temperature of 94°C for 30 seconds, 60°C for 30 seconds, and 72°C for 30 seconds, for 45 cycles to consume all the biotinylated primers. The biotinylated strand was captured on streptavidin sepharose beads (Amersham Biosciences, Uppsala, Sweden) and annealed with the sequencing primer 5′-GGGTGGGAGTGAT-3′. The methylation degree of long interspersed nuclear elements (LINE-1) was computed at 3 CpG sites pyrosequenced with the Pyromark Q24 Pyrosequencer (Qiagen) using the dispensation order GTCGATTAGTAGTCAGTCGTATTGTATC.
Clinical pathology tests
Blood counts, blood chemistries, total bilirubin, HbF, LDH, and D-dimer levels were standard clinical pathology tests through the CLIA-certified Clinical Pathology Laboratory at the University of Illinois at Chicago.
Measurement of HbF levels
Analysis of globin chains was performed on a TSP Spectra HPLC system using a LiChristopher 100 RP-8 column and a gradient of acetonitrile-methanol-NaCl as per the standard CLIA-certified Clinical Pathology Laboratory methods at University of Illinois at Chicago. For quantification of F-cells by flow cytometry, peripheral blood samples were fixed and stained with phycoerythrin-conjugated anti-HbF (Caltag) per manufacturer’s instructions. A normal adult negative control and cord blood positive control were run with each Becton-Dickinson FacsCalibur (Sunnyvale, CA) analysis.
Statistics
For statistical comparisons of adverse events (AEs) between placebo and each dose group, we performed exact tests of the null hypothesis that the rate parameters of Poisson distributed AEs are equal. Relative risks are given as the ratio of such rate parameters. Thus, differences are insignificant if relative risks confidence intervals include 1. The R function poisson.test(), an exact test, was used. Pain, the most frequent AE, was analyzed similarly.
For time course analyses of HbF and total hemoglobin endpoints in placebo versus each dose group, linear functions of time were fitted to each patient’s time course of measurements on-treatment. The slopes of such fits versus the dose that the patient received were fitted to linear dose-response to generate P values of such slopes of slopes, i.e., lines in dose-response plots. This approach controls for inter-patient differences in initial values as per the planned mixed-effects modeling.
Results
Patient flow and characteristics
The trial protocol is provided as S1 Text, the CONSORT statement as S2 Text, and the patient flow is shown in Fig 2C. Twenty-seven patients were screened and 25 eligible patients enrolled at the University of Illinois at Chicago with the first patient starting the study drug on Sept 5, 2012 and the last patient receiving the last dose of the study drug on Jan 6, 2016. Patients met inclusion criteria for high-risk disease despite standard of care, and hydroxyurea treatment was discontinued at least 28 days prior to initiation of the study drug or placebo [8] (Fig 2D). Placebo-treated patients were older than study drug–treated patients, a difference produced randomly. Median age of the 4 male and 21 female patients was 34 years (range 23–56) (Fig 2E). Baseline laboratory values reflected hemolytic anemia and were similar in drug - and placebo-treated patients (Fig 2E).
AEs
The primary endpoint of ≥ grade 3 non-hematologic toxicities was not triggered, nor did any patients trigger the platelets >1,200 × 109/L, or neutrophils <1.5 × 10⁹/L thresholds requiring dose modification. There were no grade 4 AEs (Fig 3A).

This study was not designed or powered to demonstrate clinical benefit (e.g., reduction in grade 3 AEs from SCD). Such grade 3 AEs unrelated to the study drug occurring in study drug–treated patients were sickle cell vaso-occlusive pain crises (X14) and a pulmonary embolus (Fig 3B). Of these 15 events in study drug–treated patients, 2 events occurred prior to study drug administration (between study enrollment and initiation of drug), and 6 events occurred after discontinuation of study drug, including 3 events in week 3 or 4 of post-drug follow-up (Fig 3B). The pulmonary embolus occurred in a patient with prior history of this complication and without baseline or on-treatment platelet count elevations (a cohort 2 patient). All patients except for one had required emergency room or hospital admission for sickle cell vaso-occlusive pain crises between 1 and 18 times in the 12 months prior to study enrollment (Fig 3B). By including the event occurring prior to study drug administration, the rate of grade 3 sickle cell vaso-occlusive pain crises was statistically significantly increased in cohort 4 versus placebo patients: cohort 4 patients had a rate of this complication in the 12 months preceding study enrollment that was more than 2-fold greater than the rate in placebo-treated patients (Fig 3B).
The most frequent AE of any grade in placebo - and study drug–treated patients was pain from vaso-occlusive sickle cell crisis (Fig 3A). The rates of vaso-occlusive pain crisis AEs of all grades appeared lower in THU-decitabine dose level versus placebo-treated patients except in cohort 4, as noted above (Fig 4). The overall pattern of AEs was similar in placebo - and study drug–treated patients (Fig 4).

No patients discontinued the study drug or placebo because of AEs.
Decitabine pharmacokinetics
Samples for decitabine pharmacokinetic measurements by LCMS/MS were obtained immediately prior to and at 2, 4, and 24 hours after decitabine administration in 12 of 15 study drug–treated patients (dictated by venous access). Decitabine was detected in the plasma even at the lowest decitabine dose level of 0.01 mg/kg, and a dose-dependent increase was observed (Fig 5A). The highest dose of oral decitabine, 0.16 mg/kg (cohort 5), produced decitabine plasma concentrations at 2 hours from 39–54 nM (Cmax). The dose level below this, 0.08 mg/kg (cohort 4), produced Cmax of 9–21 nM (Fig 5A).

Molecular pharmacodynamics
The intended molecular pharmacodynamic effect with oral THU-decitabine therapy is DNMT1 depletion. DNMT1 protein levels were measured by flow cytometric analysis of peripheral blood mononuclear cells obtained at baseline, 3, 6, and 8 weeks after initiation of treatment. DNMT1 protein levels decreased by >75% from baseline in 2 of the 3 decitabine 0.16 mg/kg–treated patients (cohort 5), and by approximately 50% in all 0.08 mg/kg–treated patients (cohort 4), but not in patients with lower decitabine doses or in placebo-treated patients (Fig 5B). An expected consequence of DNMT1 depletion is reduction in DNA methylation at LINE-1 repetitive element CpGs, a measurement that has been used in other clinical trials of DNMT1-depleting drugs [71]. LINE-1 CpG methylation was measured in peripheral blood mononuclear cells obtained at baseline, 4, 8, and 10 weeks after initiation of therapy. LINE-1 CpG methylation decreased consistently by approximately 10% with decitabine at 0.16 mg/kg (cohort 5), but not with lower decitabine doses or in placebo-treated patients (Fig 5C).
Induction of HbF
The primary efficacy objective with non-cytotoxic DNMT1 depletion in patients with SCD is to increase HbF expression in erythroid precursors, and thereby to decrease HbS polymerization and stop the SCD pathophysiological cascade at its inception (Fig 1). HbF was measured by HPLC in the Clinical Pathology Laboratory and also by flow cytometric quantification of HbF content in individual RBCs. HbF percentage (HbF%) increases by HPLC were observed with decitabine 0.08 mg/kg and 0.16 mg/kg (cohorts 4 and 5, respectively), but not with other decitabine dose levels or placebo (Fig 6A–6D, S1 Fig, S1 Data). Rates of increase in HbF% (time-slope estimates) increased with dose (P < 0.001) (Fig 6B). The largest HbF increases were in cohort 5 with increases of 4%, 9%, and 9%, corresponding to absolute HbF increases of 0.4, 0.85, and 1.1 g/dL from baseline (Fig 6A–6D). Upon study drug discontinuation, HbF plateaued for 2 weeks and then began to decline (Fig 6A and 6C). By flow cytometry, major increases in RBC enriched for HbF (F-cells) were observed in cohorts 4 and 5, with the largest F-cell increases in cohort 5 patients, up 2.1-, 2.1 - and 1.4-fold, thereby reaching levels up to approximately 40%, 65%, and 80% of total RBCs, respectively (Fig 6E and 6F, S2 Fig). F-cells did not increase with placebo (Fig 6E and 6F). F-cells plateaued in the 2 weeks after study drug discontinuation (Fig 6D).

Total hemoglobin and other hematology/efficacy parameters
Non-cytotoxic DNMT1 depletion by decitabine in vitro and in vivo is known to bias commitment decisions of multi-potent hematopoietic precursors towards erythroid and megakaryocyte lineage-fate and away from granulocyte-monocyte fate [43,51,53,72]. That is, non-cytotoxic DNMT1 depletion is expected to increase hemoglobin and platelets and concurrently decrease neutrophils. Hemoglobin levels increased in all cohort 4 and 5 (0.08 and 0.16 mg/kg, respectively) patients (in one cohort 4 patient, an isolated large increase in hemoglobin and ANC coincided with a pneumonia diagnosis and dehydration) (Fig 7A, S1 Fig, S1 Data). The total hemoglobin increases from baseline to maximum during 8 weeks of treatment at 0.16 mg/kg dose (cohort 5) were 1.2, 1.8, and 1.9 g/dL (Fig 7A). Rates of increase in total hemoglobin (time-slope estimates) increased with dose (P = 0.01) (Fig 7B). Total hemoglobin increased even as reticulocyte counts decreased; that is, better quality and efficiency of HbF-enriched erythropoiesis permitted increases in hemoglobin with fewer reticulocytes (Fig 7C). Also indicating better RBC quality were biomarkers of hemolysis, thrombophilia, and inflammation, namely serum LDH, total bilirubin, D-dimer, and CRP levels, all of which improved in cohorts 4 and 5 (Fig 7D–7G, S1 Fig, S1 Data).
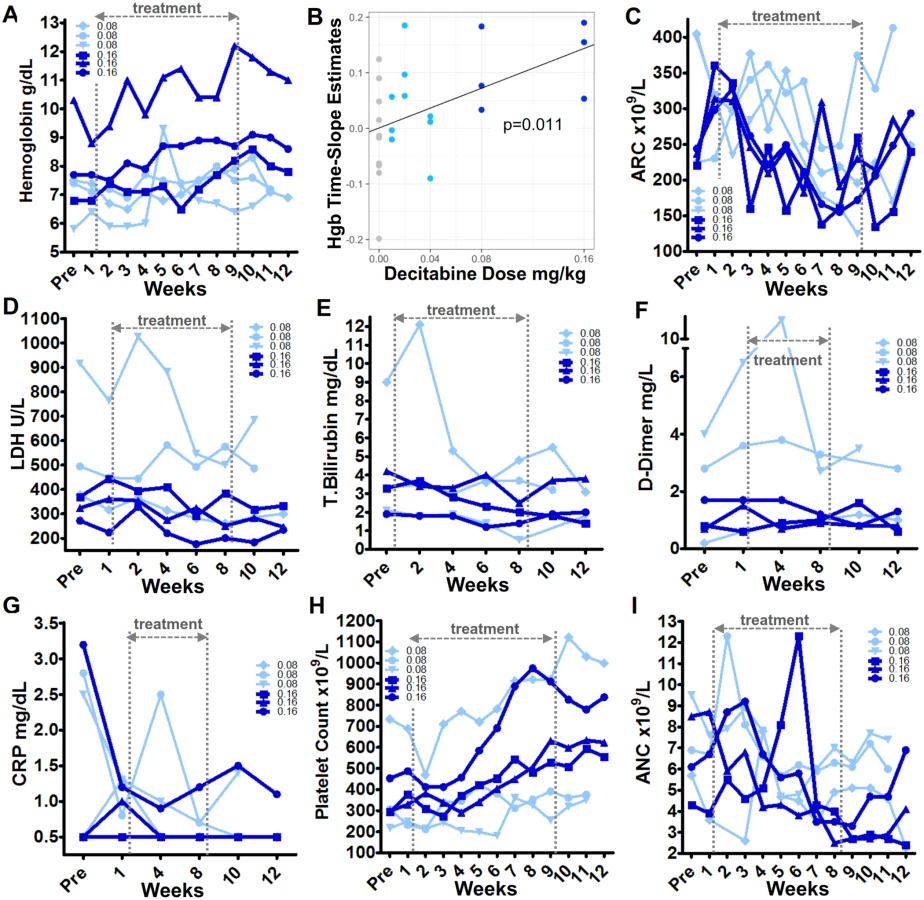
In parallel, as expected with non-cytotoxic DNMT1 depletion, platelets increased concurrently with neutrophil decreases (Fig 7H and 7I). Platelet and neutrophil counts on therapy did not reach a priori–defined triggers for dose modification: neither a platelet count of >1,200 × 109/L, nor an ANC <1.5 ×10⁹/L, were reached, as the highest platelet count on therapy was 1,122 × 109/L in a patient with a pretreatment count of 733 × 109/L, and the lowest ANC on therapy was 1.6 × 10⁹/L in a patient with a pretreatment count of 1.8 × 10⁹/L (Fig 7H and 7I). In contrast to the clear trends in myeloid lineages, there was no clear pattern of change in absolute lymphocyte counts on therapy (S1 Fig).
All blood counts reverted towards baseline 2 weeks after discontinuation of study drug (Fig 7).
Discussion
This first-in-human clinical trial evaluated safety of oral THU-decitabine, and identified an appropriate dose, for DNMT1 depletion and HbF induction in SCD [70]. Oral THU-decitabine was safe and well-tolerated in this study and produced a wide decitabine concentration-time profile (low Cmax, long Tmax) ideal for non-cytotoxic DNMT1 depletion, since DNMT1 depletion can occur at low nanomolar concentrations but depends on exposure timing [46,73–75]. Increases in fetal and total hemoglobin expected to be clinically significant were produced at the highest decitabine dose administered, 0.16 mg/kg, accompanied by improvements in laboratory biomarkers of hemolysis, coagulation, and inflammation. The side effects were a concurrent increase in platelets and decrease in neutrophils, expected with non-cytotoxic DNMT1 depletion.
The main limitation was narrow ability to document clinical benefits, because this was a first-in-human study with a single-blind design, with only a small number of patients treated at each decitabine dose level, and for only 8 weeks. Non-blinding of investigators could produce over - or under-reporting of AEs. The major rationale for not blinding investigators to treatment assignment was the intent to use intra-patient dose modification for decitabine Cmax > 0.2 μM, study drug–related ≥ grade 3 toxicity, platelets > 1,200 × 109/L, or neutrophils < 1.5 × 10⁹/L. In the study, intra-patient dose modification was not triggered.
Doses of oral decitabine administered after oral THU were escalated from a very low starting level (0.01 mg/kg), to find the minimal decitabine doses active in depleting DNMT1 without cytotoxicity. Our specific pharmacokinetic objectives were to (i) distribute decitabine through the most CDA-enriched tissues, intestines and liver, which need to be surmounted for oral bioavailability; (ii) extend decitabine half-life/Tmax to hours, instead of minutes, to increase S-phase–dependent DNMT1 depletion; (iii) avoid off-target cytotoxicity by maintaining Cmax in the range of >5 nM and <200 nM (nucleotide pool imbalance, DNA-damage, and cytotoxicity correlates with Cmax > 500 nM (reviewed in [76])). These pharmacokinetic objectives were met: mini-doses of oral decitabine administered 60 minutes after THU 10 mg/kg traversed the intestines and liver to produce systemic exposure with a wide decitabine concentration-time profile (Cmax approximately 50 nM at 0.16 mg/kg decitabine, Tmax of hours instead of minutes). By contrast, intravenous administration of decitabine produces a very high Cmax and very brief half-life of minutes. Although continuous intravenous or subcutaneous infusion can in principle lower Cmax and extend Tmax, such approaches are impractical, expensive, and do not solve the problem of negligible distribution into CDA-rich solid tissues—target cells residing in such tissues remain unexposed to treatment [62,77,78]. Increasing intravenous or subcutaneous dose is not a solution for uneven tissue distribution, since toxic exposures are produced in sensitive CDA-poor tissues (e.g., bone marrow) while negligible distribution into CDA-rich tissues persists [62,77]. Similarly, attempting to overcome the intestinal/liver CDA first-pass barrier with high oral doses risks luminal drug concentrations toxic to intestinal enterocytes while systemic exposures remain suboptimal [70,79]. Subcutaneous administration blunts Cmax but does not resolve short half-life and uneven tissue distribution problems [70].
The molecular pharmacodynamic objective of DNMT1 depletion and its corollary, hypomethylation of repetitive element LINE-1 CpG, were produced in peripheral blood mononuclear cells most consistently by oral decitabine 0.16 mg/kg (approximately 5 mg/m2). The degree of LINE-1 CpG hypomethylation generated was comparable to that produced by intravenous decitabine regimens FDA-approved to treat myeloid malignancies, that infuse an appoximately four-fold higher intravenous daily dose of 20 mg/m2/day for 5 days. However, instead of being pulse-cycled, the hypomethylation with oral THU-decitabine is sustained week to week [80,81]. Also contrasting with intravenous infusion, decitabine exposure was throughout CDA-rich solid tissues, demonstrated by its distribution through intestine and liver into plasma where it was measured. This is clinically pertinent beyond oral bioavailability, since target cells may reside in CDA-rich tissues, e.g., erythroid precursors in the spleen in β-thalassemia [62,77,80].
We previously compared head-to-head in the same non-human primates (n = 14) HbF induction by hydroxyurea or cytarabine versus 5-azacytidine (a prodrug of decitabine); 5-azacytidine produced 2 to 20-fold greater increases in HbF than cytarabine or hydroxyurea, without the cytotoxic side effects of cytarabine and hydroxyurea and with consistent effects in older animals less able to respond to cytarabine or hydroxyurea [21]. From this, we repositioned parenterally administered decitabine for non-cytotoxic DNMT1 depletion in SCD patients who had not benefitted from hydroxyurea. In these trials, HbF increases plateaued at >10% from baseline after 12 weeks of treatment, including in patients with essentially 0% HbF increases after 2 years of monitored treatment with hydroxyurea in the pivotal clinical trial [42,43]. The observations here are in line with these previous observations: 8 weeks of treatment with oral THU-decitabine 0.16 mg/kg 2X/week increased HbF 4%–9% from baseline, again in patients who had not benefitted from hydroxyurea. F-cells increased by >2-fold, up to approximately 80% of the total RBC population. Total hemoglobin increased 1.2–1.9 g/dL even as reticulocyte counts decreased, reflecting the better efficiency and quality of HbF-enriched erythropoiesis, also shown by improvements in biomarkers of hemolysis, thrombophilia, and inflammation (LDH, bilirubin, D-dimer, CRP). By way of comparison, transfusion of 1 unit of blood increases hemoglobin by approximately 1 g/dL, and hydroxyurea in the pivotal trial increased total hemoglobin by an average of 0.6 g/dL. Previous parenteral decitabine trials evaluated RBC adhesion to thrombospondin and laminin, RBC hemoglobin concentration, and RBC phosphatidylserine exposure, documenting improvements in these parameters as well [43,51].
In parallel, as expected with non-cytotoxic DNMT1 depletion, platelet counts increased while neutrophil counts concurrently decreased [43,51–53], although remaining within ranges observed in SCD or β-thalassemia patients receiving standard-of-care interventions such as splenectomy or hydroxyurea. Platelet increases and neutrophil decreases are dose/frequency–limiting parameters. In a previous clinical trial in which subcutaneous decitabine was administered up to 3X/week, the more frequent administration, expected to produce DNMT1 depletion in a greater fraction of the erythroid precursor population, did produce even larger increases in HbF and total hemoglobin; however, there were correspondingly greater platelet increases and neutrophil decreases [43]. Platelet increases in SCD, already a thrombophilia, are a concern. The trade-off with better RBC quality, however, is worth closer examination. Several groups have found that platelet activation in β-hemoglobinopathies is by diseased RBC and the endothelial damage they cause [82–94]. In thrombophilic myeloproliferative neoplasms also, thrombotic risk has been found to be a function of qualitative defects in RBC and platelets and not higher platelet counts (reviewed in [95]). Similarly, no link between higher platelets and thrombosis was observed in series of post-splenectomy β-thalassemia patients [91,92], nor during 12–15 years of follow-up of >5,000 normal individuals [96]. The improvement in RBC quality produced by HbF induction thus explains improvements in thrombophilia biomarkers (D-dimer, Von Willebrand factor [vWF] propeptide, RBC adhesion to thrombospondin and laminin, SVCAM1 [endothelial damage biomarker]) in this and previous studies of decitabine, despite concurrent platelet count increases to >800 × 109/L [43]. In short, an association between platelet count and thrombosis risk, though intuitive and possible, is not clear cut in ex and in vivo studies, while qualitative RBC defects, improved by HbF induction, are linked (reviewed in [83]). Future trials of non-cytotoxic DNMT1 depletion will need to continue to carefully monitor the risks/benefits of better RBC quality and higher platelets.
Viscosity that increases with hematocrit also contributes to thrombophilia [97]. That non-cytotoxic DNMT1 depletion produces large increases in total hemoglobin could thus mean that this approach is less suited to SCD subtypes with relatively high hematocrits at baseline, e.g., S-β+-thalassemia or S-C disease, even if RBC quality is improved concurrently by HbF induction. This question will need evaluation in future clinical trials.
Another risk is that high concentrations of decitabine can be DNA damaging and mutagenic and hence potentially pro-oncogenic. DNA damage can also be cytotoxic; this is a concern independent of potential oncogenicity because of the extraordinary demands on SCD bone marrow to compensate for severe hemolytic anemia—dwindling of such compensation by vaso-occlusive damage and age contributes to early death [8,23,31,32,98]. A major rationale for oral THU-decitabine, therefore, is creating decitabine pharmacology that reduces off-target anti-metabolite effects, DNA-damage, and cytotoxicity. First, combination with THU decreases formation of uridine degradation products that contribute significantly to off-target DNA damage and cytotoxicity [49,50]. Second, oral THU-decitabine produces a low Cmax–extended Tmax concentration-time profile that is conducive to DNMT1 depletion without measurable DNA damage or cytotoxicity, shown extensively in vitro (reviewed in [76]), in non-human primates [21,70], and in clinical trials in which very low doses of decitabine were administered subcutaneously by metronomic schedules [43,51,52]; the clinical trials documented non-cytotoxic DNMT1 depletion by a number of assays including bone marrow evaluation of DNMT1 protein levels, cellularity, γH2AX, and sub-G1 fraction, and peripheral blood evaluation of erythrocyte micronucleus and VDJ recombination assays [43,51,52].
Also regarding concerns of oncogenicity, DNMT1 is highly validated as a molecular target to prevent and treat cancer, offering a p53-independent mechanism of action distinct from conventional anti-metabolite therapy and preserving normal dividing cells (excellent therapeutic index) [43,51–54,76,99–103] (reviewed in [104]). These properties of DNMT1 as a molecular target for oncotherapy likely explain why decitabine and the related 5-azacytidine are the only drugs FDA-approved to treat all subtypes of myelodysplastic syndromes, a type of myeloid malignancy usually seen in the elderly in which better outcomes depend on improving blood counts [52,76,99,100,105,106].
Oral THU-decitabine, like standard-of-care hydroxyurea, could be teratogenic and should be restricted accordingly.
Many patients with myeloid malignancies have been treated chronically for years with metronomic very-low-dose decitabine without significant side effects [52]. Although THU is a new chemical entity that is not FDA-approved for any indication, there have been no side effects observed in clinical trials, some with treatment durations up to and exceeding a year (reviewed in [70,107]). The absence of side effects with THU likely reflects the adaptive network structure of pyrimidine metabolism that is robust to inhibition of CDA; THU has been shown to have no effect on nucleotide pool sizes [108]. Also supporting that its inhibition can be non-detrimental to normal physiology is large natural variation in CDA levels between species [109]. Mostly, THU has been used to try to increase anti-metabolite, DNA-damaging effects of coadministered cytotoxic cytidine analogues, an approach that increases systemic toxicity. Here, by contrast, the intent was to create lower Cmax, extended Tmax, more equitable tissue distribution and decrease uridine degradation products of decitabine for non-cytotoxic (non-toxic), molecularly targeted therapy goals (reviewed in [76,99]).
Fetal hemoglobin induction involves chromatin remodeling of the HbF gene locus (HBG) [110]. Cytotoxicity generates this remodeling indirectly, via bone marrow stress [21,110,111] (S3 Fig). The inefficiency of this approach versus directly inhibiting epigenetic enzymes is underscored by greater HbF increases produced by <1/1,000th the molar amount of decitabine versus hydroxyurea in the same patients (decitabine approximately 0.2 mg/kg 2X/week versus hydroxyurea approximately 20 mg/kg daily) [43,112] (S3 Fig). Several other drug development efforts are thus also directed towards direct inhibition of epigenetic enzymes that silence HbF (HBG). Besides DNMT1, enzymes targeted include histone deacetylases (HDAC), KDM1A/LSD1, and PRMT5. DNMT1-depleting and HDAC-inhibiting drugs are already FDA-approved for other clinical indications. Potential application of marketed HDAC inhibitors for HbF induction is limited by pleiotropic roles of HDAC in cells outside of chromatin, rendering it difficult to separate anti-metabolite/cytotoxicity from epigenetic effects [113–117]. The limitations of marketed parenteral decitabine also apply to 5-azacytidine, a decitabine prodrug. By depleting DNMT1 protein, decitabine and 5-azacytidine disrupt its scaffolding functions for other epigenetic enzymes such as LSD1/KDM1A [118,119]. This potent epigenetic effect, and its known safety profile, justify efforts to improve decitabine pharmacology and accessibility.
HbF is the most powerful known natural modulator of the root cause of SCD pathophysiology. This clinical trial affirms that substantial HbF and total hemoglobin increases can be produced by inhibiting an epigenetic enzyme that mediates HbF silencing and by rationally avoiding cytotoxicity. The oral route of administration and safety profile of the agent used for this purpose, oral THU-decitabine, could have global health implications. Further clinical development and evaluation are thus warranted.
Supporting Information
Zdroje
1. Platt OS, Brambilla DJ, Rosse WF, Milner PF, Castro O, Steinberg MH, et al. (1994) Mortality in sickle cell disease. Life expectancy and risk factors for early death. N Engl J Med 330 : 1639–1644. doi: 10.1056/NEJM199406093302303 7993409
2. Lanzkron S, Carroll CP, Haywood C Jr. (2013) Mortality rates and age at death from sickle cell disease: U.S., 1979–2005. Public Health Reports 128 : 110–116. doi: 10.1177/003335491312800206 23450875
3. Goldberg MA, Husson MA, Bunn HF (1977) Participation of hemoglobins A and F in polymerization of sickle hemoglobin. J Biol Chem 252 : 3414–3421. 16902
4. Nagel RL, Bookchin RM, Johnson J, Labie D, Wajcman H, Isaac-Sodeye WA, et al. (1979) Structural bases of the inhibitory effects of hemoglobin F and hemoglobin A2 on the polymerization of hemoglobin S. Proc Natl Acad Sci U S A 76 : 670–672. 284392
5. Akinsheye I, Alsultan A, Solovieff N, Ngo D, Baldwin CT, Sebastiani P, et al. (2011) Fetal hemoglobin in sickle cell anemia. Blood 118 : 19–27. doi: 10.1182/blood-2011-03-325258 21490337
6. Platt OS, Thorington BD, Brambilla DJ, Milner PF, Rosse WF, Vichinsky E, et al. (1991) Pain in sickle cell disease. Rates and risk factors. N Engl J Med 325 : 11–16. doi: 10.1056/NEJM199107043250103 1710777
7. Powars DR, Weiss JN, Chan LS, Schroeder WA (1984) Is there a threshold level of fetal hemoglobin that ameliorates morbidity in sickle cell anemia? Blood 63 : 921–926. 6200161
8. Steinberg MH, Barton F, Castro O, Pegelow CH, Ballas SK, Kutlar A, et al. (2003) Effect of hydroxyurea on mortality and morbidity in adult sickle cell anemia: risks and benefits up to 9 years of treatment. JAMA 289 : 1645–1651. doi: 10.1001/jama.289.13.1645 12672732
9. Atweh GF, Schechter AN (2001) Pharmacologic induction of fetal hemoglobin: raising the therapeutic bar in sickle cell disease. Curr Opin Hematol 8 : 123–130. 11224687
10. Powars DR, Elliott-Mills DD, Chan L, Niland J, Hiti AL, Opas LM, et al. (1991) Chronic renal failure in sickle cell disease: risk factors, clinical course, and mortality. Ann Intern Med 115 : 614–620. 1892333
11. Lebensburger J, Johnson SM, Askenazi DJ, Rozario NL, Howard TH, Hilliard LM (2011) Protective role of hemoglobin and fetal hemoglobin in early kidney disease for children with sickle cell anemia. Am J Hematol 86 : 430–432. doi: 10.1002/ajh.21994 21523807
12. Aban I, Baddam S, Hilliard LM, Howard TH, Feig DI, Lebensburger JD (2017) Severe anemia early in life as a risk factor for sickle-cell kidney disease. Blood 129 : 385–387. doi: 10.1182/blood-2016-09-738104 27919909
13. Conley CL, Weatherall DJ, Richardson SN, Shepard MK, Charache S (1963) Hereditary persistence of fetal hemoglobin: a study of 79 affected persons in 15 Negro families in Baltimore. Blood 21 : 261–281. 14022587
14. Perrine RP, Pembrey ME, John P, Perrine S, Shoup F (1978) Natural history of sickle cell anemia in Saudi Arabs. A study of 270 subjects. Ann Intern Med 88 : 1–6. 619731
15. Ngo DA, Aygun B, Akinsheye I, Hankins JS, Bhan I, Luo HY, et al. (2012) Fetal haemoglobin levels and haematological characteristics of compound heterozygotes for haemoglobin S and deletional hereditary persistence of fetal haemoglobin. Br J Haematol 156 : 259–264. doi: 10.1111/j.1365-2141.2011.08916.x 22017641
16. DeSimone J, Biel SI, Heller P (1978) Stimulation of fetal hemoglobin synthesis in baboons by hemolysis and hypoxia. Proc Natl Acad Sci U S A 75 : 2937–2940. 96444
17. DeSimone J, Heller P, Adams JG (1979) Hemopoietic stress and fetal hemoglobin synthesis: comparative studies in vivo and in vitro. Blood 54 : 1176–1181. 115514
18. DeSimone J, Heller P, Amsel J, Usman M (1980) Magnitude of the fetal hemoglobin response to acute hemolytic anemia in baboons is controlled by genetic factors. J Clin Invest 65 : 224–226. doi: 10.1172/JCI109654 6765958
19. DeSimone J, Heller P, Biel M, Zwiers D (1981) Genetic relationship between fetal Hb levels in normal and erythropoietically stressed baboons. Br J Haematol 49 : 175–183. 6170305
20. DeSimone J, Biel M, Heller P (1982) Maintenance of fetal hemoglobin (HbF) elevations in the baboon by prolonged erythropoietic stress. Blood 60 : 519–523. 6178456
21. Lavelle D, DeSimone J, Heller P, Zwiers D, Hall L (1986) On the mechanism of Hb F elevations in the baboon by erythropoietic stress and pharmacologic manipulation. Blood 67 : 1083–1089. 2420395
22. Charache S, Terrin ML, Moore RD, Dover GJ, Barton FB, Eckert SV, et al. (1995) Effect of hydroxyurea on the frequency of painful crises in sickle cell anemia. Investigators of the Multicenter Study of Hydroxyurea in Sickle Cell Anemia. N Engl J Med 332 : 1317–1322. doi: 10.1056/NEJM199505183322001 7715639
23. Steinberg MH, Lu ZH, Barton FB, Terrin ML, Charache S, Dover GJ (1997) Fetal hemoglobin in sickle cell anemia: determinants of response to hydroxyurea. Multicenter Study of Hydroxyurea. Blood 89 : 1078–1088. 9028341
24. Ballas SK, Marcolina MJ, Dover GJ, Barton FB (1999) Erythropoietic activity in patients with sickle cell anaemia before and after treatment with hydroxyurea. Br J Haematol 105 : 491–496. 10233426
25. Charache S, Dover GJ, Moore RD, Eckert S, Ballas SK, Koshy M, et al. (1992) Hydroxyurea: effects on hemoglobin F production in patients with sickle cell anemia. Blood 79 : 2555–2565. 1375104
26. Ballas SK, Barton FB, Waclawiw MA, Swerdlow P, Eckman JR, Pegelow CH, et al. (2006) Hydroxyurea and sickle cell anemia: effect on quality of life. Health and Quality of Life Outcomes 4 : 59. doi: 10.1186/1477-7525-4-59 16942629
27. Segal JB, Strouse JJ, Beach MC, Haywood C, Witkop C, Park H, et al. (2008) Hydroxyurea for the treatment of sickle cell disease. Evidence Report/technology Assessment: 1–95.
28. Machado RF, Anthi A, Steinberg MH, Bonds D, Sachdev V, Kato GJ, et al. (2006) N-terminal pro-brain natriuretic peptide levels and risk of death in sickle cell disease. JAMA 296 : 310–318. doi: 10.1001/jama.296.3.310 16849664
29. Ware RE, Eggleston B, Redding-Lallinger R, Wang WC, Smith-Whitley K, Daeschner C, et al. (2002) Predictors of fetal hemoglobin response in children with sickle cell anemia receiving hydroxyurea therapy. Blood 99 : 10–14. 11756146
30. Green NS, Manwani D, Qureshi M, Ireland K, Sinha A, Smaldone AM (2016) Decreased fetal hemoglobin over time among youth with sickle cell disease on hydroxyurea is associated with higher urgent hospital use. Pediatric Blood & Cancer 63 : 2146–2153.
31. West MS, Wethers D, Smith J, Steinberg M (1992) Laboratory profile of sickle cell disease: a cross-sectional analysis. The Cooperative Study of Sickle Cell Disease. J Clin Epidemiol 45 : 893–909. 1624972
32. Saraf S, Farooqui M, Infusino G, Oza B, Sidhwani S, Gowhari M, et al. (2011) Standard clinical practice underestimates the role and significance of erythropoietin deficiency in sickle cell disease. Br J Haematol 153 : 386–392. doi: 10.1111/j.1365-2141.2010.08479.x 21418176
33. van der Ploeg LH, Flavell RA (1980) DNA methylation in the human gamma delta beta-globin locus in erythroid and nonerythroid tissues. Cell 19 : 947–958. 6247075
34. Mavilio F, Giampaolo A, Care A, Migliaccio G, Calandrini M, Russo G, et al. (1983) Molecular mechanisms of human hemoglobin switching: selective undermethylation and expression of globin genes in embryonic, fetal, and adult erythroblasts. Proc Natl Acad Sci U S A 80 : 6907–6911. 6316333
35. Tagle DA, Koop BF, Goodman M, Slightom JL, Hess DL, Jones RT (1988) Embryonic epsilon and gamma globin genes of a prosimian primate (Galago crassicaudatus). Nucleotide and amino acid sequences, developmental regulation and phylogenetic footprints. J Mol Biol 203 : 439–455. 3199442
36. DeSimone J, Heller P, Hall L, Zwiers D (1982) 5-Azacytidine stimulates fetal hemoglobin synthesis in anemic baboons. Proc Natl Acad Sci U S A 79 : 4428–4431. 6181507
37. Ley TJ, DeSimone J, Anagnou NP, Keller GH, Humphries RK, Turner PH, et al. (1982) 5-azacytidine selectively increases gamma-globin synthesis in a patient with beta+ thalassemia. N Engl J Med 307 : 1469–1475. doi: 10.1056/NEJM198212093072401 6183586
38. Ley TJ, DeSimone J, Noguchi CT, Turner PH, Schechter AN, Heller P, et al. (1983) 5-Azacytidine increases gamma-globin synthesis and reduces the proportion of dense cells in patients with sickle cell anemia. Blood 62 : 370–380. 6191799
39. Charache S, Dover G, Smith K, Talbot CC Jr., Moyer M, Boyer S (1983) Treatment of sickle cell anemia with 5-azacytidine results in increased fetal hemoglobin production and is associated with nonrandom hypomethylation of DNA around the gamma-delta-beta-globin gene complex. Proc Natl Acad Sci U S A 80 : 4842–4846. 6192443
40. Dover GJ, Charache S, Boyer SH, Vogelsang G, Moyer M (1985) 5-Azacytidine increases HbF production and reduces anemia in sickle cell disease: dose-response analysis of subcutaneous and oral dosage regimens. Blood 66 : 527–532. 2411310
41. Lowrey CH, Nienhuis AW (1993) Brief report: treatment with azacitidine of patients with end-stage beta-thalassemia. N Engl J Med 329 : 845–848. doi: 10.1056/NEJM199309163291205 7689171
42. Koshy M, DeSimone J, Molokie R, Dorn L, van der Galien T, Bressler L (1998) Augmentation of fetal hemoglobin (HbF) levels by low-dose short-duration 5 '-aza-2-deoxycytidine (decitabine) administration in sickle cell anemia patients who had no HbF elevation following hydroxyurea therapy. Blood 92 : 30b–30b.
43. Saunthararajah Y, Hillery CA, Lavelle D, Molokie R, Dorn L, Bressler L, et al. (2003) Effects of 5-aza-2 '-deoxycytidine on fetal hemoglobin levels, red cell adhesion, and hematopoietic differentiation in patients with sickle cell disease. Blood 102 : 3865–3870. doi: 10.1182/blood-2003-05-1738 12907443
44. Xu J, Bauer DE, Kerenyi MA, Vo TD, Hou S, Hsu YJ, et al. (2013) Corepressor-dependent silencing of fetal hemoglobin expression by BCL11A. Proc Natl Acad Sci U S A 110 : 6518–6523. doi: 10.1073/pnas.1303976110 23576758
45. Cui S, Kolodziej KE, Obara N, Amaral-Psarris A, Demmers J, Shi L, et al. (2011) Nuclear receptors TR2 and TR4 recruit multiple epigenetic transcriptional corepressors that associate specifically with the embryonic beta-type globin promoters in differentiated adult erythroid cells. Mol Cell Biol 31 : 3298–3311. doi: 10.1128/MCB.05310-11 21670149
46. Santi DV, Garrett CE, Barr PJ (1983) On the mechanism of inhibition of DNA-cytosine methyltransferases by cytosine analogs. Cell 33 : 9–10. 6205762
47. Covey JM, D'Incalci M, Tilchen EJ, Zaharko DS, Kohn KW (1986) Differences in DNA damage produced by incorporation of 5-aza-2'-deoxycytidine or 5,6-dihydro-5-azacytidine into DNA of mammalian cells. Cancer Res 46 : 5511–5517. 2428479
48. Schermelleh L, Haemmer A, Spada F, Rosing N, Meilinger D, Rothbauer U, et al. (2007) Dynamics of Dnmt1 interaction with the replication machinery and its role in postreplicative maintenance of DNA methylation. Nucleic Acids Res 35 : 4301–4312. doi: 10.1093/nar/gkm432 17576694
49. Zauri M, Berridge G, Thezenas ML, Pugh KM, Goldin R, Kessler BM, et al. (2015) CDA directs metabolism of epigenetic nucleosides revealing a therapeutic window in cancer. Nature 524 : 114–118. doi: 10.1038/nature14948 26200337
50. Almqvist H, Axelsson H, Jafari R, Dan C, Mateus A, Haraldsson M, et al. (2016) CETSA screening identifies known and novel thymidylate synthase inhibitors and slow intracellular activation of 5-fluorouracil. Nat Commun 7 : 11040. doi: 10.1038/ncomms11040 27010513
51. Olivieri NF, Saunthararajah Y, Thayalasuthan V, Kwiatkowski J, Ware RE, Kuypers FA, et al. (2011) A pilot study of subcutaneous decitabine in beta-thalassemia intermedia. Blood 118 : 2708–2711. doi: 10.1182/blood-2011-03-341909 21700776
52. Saunthararajah Y, Sekeres M, Advani A, Mahfouz R, Durkin L, Radivoyevitch T, et al. (2015) Evaluation of noncytotoxic DNMT1-depleting therapy in patients with myelodysplastic syndromes. J Clin Invest 125 : 1043–1055. doi: 10.1172/JCI78789 25621498
53. Milhem M, Mahmud N, Lavelle D, Araki H, DeSimone J, Saunthararajah Y, et al. (2004) Modification of hematopoietic stem cell fate by 5aza 2 ' deoxycytidine and trichostatin A. Blood 103 : 4102–4110. doi: 10.1182/blood-2003-07-2431 14976039
54. Hu Z, Negrotto S, Gu X, Mahfouz R, Ng KP, Ebrahem Q, et al. (2010) Decitabine maintains hematopoietic precursor self-renewal by preventing repression of stem cell genes by a differentiation-inducing stimulus. Mol Cancer Ther 9 : 1536–1543. doi: 10.1158/1535-7163.MCT-10-0191 20501800
55. DeSimone J, Koshy M, Dorn L, Lavelle D, Bressier L, Molokie R, et al. (2002) Maintenance of elevated fetal hemoglobin levels by decitabine during dose interval treatment of sickle cell anemia. Blood 99 : 3905–3908. 12010787
56. Liu Z, Marcucci G, Byrd JC, Grever M, Xiao J, Chan KK (2006) Characterization of decomposition products and preclinical and low dose clinical pharmacokinetics of decitabine (5-aza-2'-deoxycytidine) by a new liquid chromatography/tandem mass spectrometry quantification method. Rapid Commun Mass Spectrom 20 : 1117–1126. doi: 10.1002/rcm.2423 16523529
57. Liu Z, Liu S, Xie Z, Blum W, Perrotti D, Paschka P, et al. (2007) Characterization of in vitro and in vivo hypomethylating effects of decitabine in acute myeloid leukemia by a rapid, specific and sensitive LC-MS/MS method. Nucleic Acids Res 35: e31. doi: 10.1093/nar/gkl1156 17264127
58. Camiener GW, Smith CG (1965) Studies of the enzymatic deamination of cytosine arabinoside. I. Enzyme distribution and species specificity. Biochem Pharmacol 14 : 1405–1416. 4956026
59. Neil GL, Moxley TE, Kuentzel SL, Manak RC, Hanka LJ (1975) Enhancement by tetrahydrouridine (NSC-112907) of the oral activity of 5-azacytidine (NSC-102816) in L1210 leukemic mice. Cancer Chemother Rep 59 : 459–465. 54211
60. DeSimone J, Heller P, Molokie RE, Hall L, Zwiers D (1985) Tetrahydrouridine, cytidine analogues, and hemoglobin F. Am J Hematol 18 : 283–288. 2579548
61. Beumer JH, Eiseman JL, Parise RA, Joseph E, Covey JM, Egorin MJ (2008) Modulation of gemcitabine (2',2'-difluoro-2'-deoxycytidine) pharmacokinetics, metabolism, and bioavailability in mice by 3,4,5,6-tetrahydrouridine. Clin Cancer Res 14 : 3529–3535. doi: 10.1158/1078-0432.CCR-07-4885 18519786
62. Ebrahem Q, Mahfouz R, Ng KP, Saunthararajah Y (2012) High cytidine deaminase expression in the liver provides sanctuary for cancer cells from decitabine treatment effects. Oncotarget 3 : 1137–1145. doi: 10.18632/oncotarget.597 23087155
63. Riccardi R, Chabner B, Glaubiger DL, Wood J, Poplack DG (1982) Influence of tetrahydrouridine on the pharmacokinetics of intrathecally administered 1-beta-D-arabinofuranosylcytosine. Cancer Res 42 : 1736–1739. 6896013
64. Kreis W, Budman DR, Chan K, Allen SL, Schulman P, Lichtman S, et al. (1991) Therapy of refractory/relapsed acute leukemia with cytosine arabinoside plus tetrahydrouridine (an inhibitor of cytidine deaminase)—a pilot study. Leukemia 5 : 991–998. 1961042
65. Wong PP, Currie VE, Mackey RW, Krakoff IH, Tan CT, Burchenal JH, et al. (1979) Phase I evaluation of tetrahydrouridine combined with cytosine arabinoside. Cancer Treat Rep 63 : 1245–1249. 383291
66. Ho DH, Bodey GP, Hall SW, Benjamin RS, Brown NS, Freireich EJ, et al. (1978) Clinica, pharmacology of tetrahydrouridine. J Clin Pharmacol 18 : 259–265. 641214
67. Kreis W, Woodcock TM, Gordon CS, Krakoff IH (1977) Tetrahydrouridine: Physiologic disposition and effect upon deamination of cytosine arabinoside in man. Cancer Treat Rep 61 : 1347–1353. 589600
68. Marsh JH, Kreis W, Barile B, Akerman S, Schulman P, Allen SL, et al. (1993) Therapy of refractory/relapsed acute myeloid leukemia and blast crisis of chronic myeloid leukemia with the combination of cytosine arabinoside, tetrahydrouridine, and carboplatin. Cancer Chemother Pharmacol 31 : 481–484. 8453688
69. Goldenthal EI, Cookson KM, Geil RG, Wazeter FX (1974) Preclinical toxicologic evaluation of tetrahydrouridine (NSC-112907) in beagle dogs and rhesus monkeys. Cancer Chemother Rep3 5 : 15–16.
70. Lavelle D, Vaitkus K, Ling Y, Ruiz MA, Mahfouz R, Ng KP, et al. (2012) Effects of tetrahydrouridine on pharmacokinetics and pharmacodynamics of oral decitabine. Blood 119 : 1240–1247. doi: 10.1182/blood-2011-08-371690 22160381
71. Aparicio A, North B, Barske L, Wang X, Bollati V, Weisenberger D, et al. (2009) LINE-1 methylation in plasma DNA as a biomarker of activity of DNA methylation inhibitors in patients with solid tumors. Epigenetics 4 : 176–184. 19421002
72. Saunthararajah Y, Sekeres M, Advani A, Mahfouz R, Durkin L, Radivoyevitch T, et al. (2015) Evaluation of noncytotoxic DNMT1-depleting therapy in patients with myelodysplastic syndromes. J Clin Invest. 2;125(3):1043–55. doi: 10.1172/JCI78789 25621498
73. Santi DV, Norment A, Garrett CE (1984) Covalent bond formation between a DNA-cytosine methyltransferase and DNA containing 5-azacytosine. Proc Natl Acad Sci U S A 81 : 6993–6997. 6209710
74. Patel K, Dickson J, Din S, Macleod K, Jodrell D, Ramsahoye B (2010) Targeting of 5-aza-2'-deoxycytidine residues by chromatin-associated DNMT1 induces proteasomal degradation of the free enzyme. Nucleic Acids Res 38 : 4313–4324. doi: 10.1093/nar/gkq187 20348135
75. Creusot F, Acs G, Christman JK (1982) Inhibition of DNA methyltransferase and induction of Friend erythroleukemia cell differentiation by 5-azacytidine and 5-aza-2'-deoxycytidine. J Biol Chem 257 : 2041–2048. 6173384
76. Saunthararajah Y (2013) Key clinical observations after 5-azacytidine and decitabine treatment of myelodysplastic syndromes suggest practical solutions for better outcomes. Hematology Am Soc Hematol Educ Program 2013 : 511–521. doi: 10.1182/asheducation-2013.1.511 24319226
77. Schrump DS, Fischette MR, Nguyen DM, Zhao M, Li X, Kunst TF, et al. (2006) Phase I study of decitabine-mediated gene expression in patients with cancers involving the lungs, esophagus, or pleura. Clin Cancer Res 12 : 5777–5785. doi: 10.1158/1078-0432.CCR-06-0669 17020984
78. Jansen RS, Rosing H, Wijermans PW, Keizer RJ, Schellens JH, Beijnen JH (2012) Decitabine triphosphate levels in peripheral blood mononuclear cells from patients receiving prolonged low-dose decitabine administration: a pilot study. Cancer Chemotherapy and Pharmacol 69 : 1457–1466.
79. Garcia-Manero G, Gore SD, Cogle C, Ward R, Shi T, Macbeth KJ, et al. (2011) Phase I study of oral azacitidine in myelodysplastic syndromes, chronic myelomonocytic leukemia, and acute myeloid leukemia. J Clin Oncol 29 : 2521–2527. doi: 10.1200/JCO.2010.34.4226 21576646
80. Stewart DJ, Issa JP, Kurzrock R, Nunez MI, Jelinek J, Hong D, et al. (2009) Decitabine effect on tumor global DNA methylation and other parameters in a phase I trial in refractory solid tumors and lymphomas. Clin Cancer Res 15 : 3881–3888. doi: 10.1158/1078-0432.CCR-08-2196 19470736
81. Fang F, Balch C, Schilder J, Breen T, Zhang S, Shen C, et al. (2010) A phase 1 and pharmacodynamic study of decitabine in combination with carboplatin in patients with recurrent, platinum-resistant, epithelial ovarian cancer. Cancer 116 : 4043–4053. doi: 10.1002/cncr.25204 20564122
82. Goldschmidt N, Spectre G, Brill A, Zelig O, Goldfarb A, Rachmilewitz E, et al. (2008) Increased platelet adhesion under flow conditions is induced by both thalassemic platelets and red blood cells. Thrombosis and Haemostasis 100 : 864–870. 18989531
83. Zhang D, Xu C, Manwani D, Frenette PS (2016) Neutrophils, platelets, and inflammatory pathways at the nexus of sickle cell disease pathophysiology. Blood 127 : 801–809. doi: 10.1182/blood-2015-09-618538 26758915
84. Habib A, Kunzelmann C, Shamseddeen W, Zobairi F, Freyssinet JM, Taher A (2008) Elevated levels of circulating procoagulant microparticles in patients with beta-thalassemia intermedia. Haematologica 93 : 941–942. doi: 10.3324/haematol.12460 18460647
85. Gladwin MT, Kato GJ (2008) Hemolysis-associated hypercoagulability in sickle cell disease: the plot (and blood) thickens! Haematologica 93 : 1–3. doi: 10.3324/haematol.12318 18166776
86. Ataga KI, Moore CG, Hillery CA, Jones S, Whinna HC, Strayhorn D, et al. (2008) Coagulation activation and inflammation in sickle cell disease-associated pulmonary hypertension. Haematologica 93 : 20–26. doi: 10.3324/haematol.11763 18166781
87. Whelihan MF, Zachary V, Orfeo T, Mann KG (2012) Prothrombin activation in blood coagulation: the erythrocyte contribution to thrombin generation. Blood 120 : 3837–3845. doi: 10.1182/blood-2012-05-427856 22968460
88. Ruf A, Pick M, Deutsch V, Patscheke H, Goldfarb A, Rachmilewitz EA, et al. (1997) In-vivo platelet activation correlates with red cell anionic phospholipid exposure in patients with beta-thalassaemia major. Br J Haematol 98 : 51–56. 9233563
89. Tripodi A, Cappellini MD, Chantarangkul V, Padovan L, Fasulo MR, Marcon A, et al. (2009) Hypercoagulability in splenectomized thalassemic patients detected by whole-blood thromboelastometry, but not by thrombin generation in platelet-poor plasma. Haematologica 94 : 1520–1527. doi: 10.3324/haematol.2009.010546 19648162
90. Whelihan MF, Mooberry MJ, Zachary V, Bradford RL, Ataga KI, Mann KG, et al. (2013) The contribution of red blood cells to thrombin generation in sickle cell disease: meizothrombin generation on sickled red blood cells. J Thromb Haemost 11 : 2187–2189. doi: 10.1111/jth.12423 24119168
91. Chuncharunee S, Archararit N, Ungkanont A, Jootar S, Angchaisuksiri P, Bunyaratavej A, et al. (2000) Etiology and incidence of thrombotic and hemorrhagic disorders in Thai patients with extreme thrombocytosis. J Med Assoc Thai 83 Suppl 1: S95–100.
92. Hathirat P, Mahaphan W, Chuansumrit A, Pintadit P, Sasanakul W, Isarangkura P (1993) Platelet counts in thalassemic children before and after splenectomy. Southeast Asian J Trop Med Public Health 24 Suppl 1 : 213–215.
93. Setty BN, Kulkarni S, Rao AK, Stuart MJ (2000) Fetal hemoglobin in sickle cell disease: relationship to erythrocyte phosphatidylserine exposure and coagulation activation. Blood 96 : 1119–1124. 10910931
94. Setty BN, Kulkarni S, Dampier CD, Stuart MJ (2001) Fetal hemoglobin in sickle cell anemia: relationship to erythrocyte adhesion markers and adhesion. Blood 97 : 2568–2573. 11313243
95. Tefferi A (2008) Platelet count in essential thrombocythemia: the more the better? Blood 112 : 3526–3527. doi: 10.1182/blood-2008-07-168807 18840727
96. van der Bom JG, Heckbert SR, Lumley T, Holmes CE, Cushman M, Folsom AR, et al. (2009) Platelet count and the risk for thrombosis and death in the elderly. J Thromb Haemost 7 : 399–405. doi: 10.1111/j.1538-7836.2008.03267.x 19143922
97. Swerdlow PS (2006) Red cell exchange in sickle cell disease. Hematology Am Soc Hematol Educ Program: 48–53. doi: 10.1182/asheducation-2006.1.48 17124039
98. de Haan G, Nijhof W, Van Zant G (1997) Mouse strain-dependent changes in frequency and proliferation of hematopoietic stem cells during aging: correlation between lifespan and cycling activity. Blood 89 : 1543–1550. 9057635
99. Saunthararajah Y, Triozzi P, Rini B, Singh A, Radivoyevitch T, Sekeres M, et al. (2012) p53-Independent, normal stem cell sparing epigenetic differentiation therapy for myeloid and other malignancies. Semin Oncol 39 : 97–108. doi: 10.1053/j.seminoncol.2011.11.011 22289496
100. Ng KP, Ebrahem Q, Negrotto S, Mahfouz RZ, Link KA, Hu Z, et al. (2011) p53 independent epigenetic-differentiation treatment in xenotransplant models of acute myeloid leukemia. Leukemia 25 : 1739–1750. doi: 10.1038/leu.2011.159 21701495
101. Negrotto S, Ng KP, Jankowska AM, Bodo J, Gopalan B, Guinta K, et al. (2012) CpG methylation patterns and decitabine treatment response in acute myeloid leukemia cells and normal hematopoietic precursors. Leukemia 26 : 244–254. doi: 10.1038/leu.2011.207 21836612
102. Tsai HC, Li H, Van Neste L, Cai Y, Robert C, Rassool FV, et al. (2012) Transient Low Doses of DNA-Demethylating Agents Exert Durable Antitumor Effects on Hematological and Epithelial Tumor Cells. Cancer Cell 21 : 430–446. doi: 10.1016/j.ccr.2011.12.029 22439938
103. Momparler RL, Cote S, Momparler LF (2013) Epigenetic action of decitabine (5-aza-2'-deoxycytidine) is more effective against acute myeloid leukemia than cytotoxic action of cytarabine (ARA-C). Leuk Res. 37 : 980–984. doi: 10.1016/j.leukres.2013.04.019 23660386
104. Velcheti V, Radivoyevitch T, Saunthararajah Y (2017) Higher-Level Pathway Objectives of Epigenetic Therapy: A Solution to the p53 Problem in Cancer. Am Soc Clin Oncol Educ Book 37 : 812–824. doi: 10.14694/EDBK_174175 28561650
105. Negrotto S, Hu Z, Alcazar O, Ng KP, Triozzi P, Lindner D, et al. (2011) Noncytotoxic differentiation treatment of renal cell cancer. Cancer Res 71 : 1431–1441. doi: 10.1158/0008-5472.CAN-10-2422 21303982
106. Alcazar O, Achberger S, Aldrich W, Hu Z, Negrotto S, Saunthararajah Y, et al. (2012) Epigenetic regulation by decitabine of melanoma differentiation in vitro and in vivo. Int J Cancer 131 : 18–29. doi: 10.1002/ijc.26320 21796622
107. Terse P, Engelke K, Chan K, Ling Y, Sharpnack D, Saunthararajah Y, et al. (2014) Subchronic oral toxicity study of decitabine in combination with tetrahydrouridine in CD-1 mice. Int J of Toxicol 33 : 75–85.
108. Heinemann V, Plunkett W (1989) Modulation of deoxynucleotide metabolism by the deoxycytidylate deaminase inhibitor 3,4,5,6-tetrahydrodeoxyuridine. Biochem Pharmacol 38 : 4115–4121. 2688654
109. Dedrick RL, Forrester DD, Cannon JN, el-Dareer SM, Mellett LB (1973) Pharmacokinetics of 1-beta-D-arabinofuranosylcytosine (ARA-C) deamination in several species. Biochem Pharmacol 22 : 2405–2417. 4200888
110. Goren A, Simchen G, Fibach E, Szabo PE, Tanimoto K, Chakalova L, et al. (2006) Fine tuning of globin gene expression by DNA methylation. PLoS ONE 1(1): e46. doi: 10.1371/journal.pone.0000046 17183675
111. Platt OS, Orkin SH, Dover G, Beardsley GP, Miller B, Nathan DG (1984) Hydroxyurea enhances fetal hemoglobin production in sickle cell anemia. J Clin Invest 74 : 652–656. doi: 10.1172/JCI111464 6205021
112. Saunthararajah Y, Lavelle D, DeSimone J (2004) DNA hypo-methylating agents and sickle cell disease. Brit J Haematol 126 : 629–636.
113. Scuto A, Kirschbaum M, Kowolik C, Kretzner L, Juhasz A, Atadja P, et al. (2008) The novel histone deacetylase inhibitor, LBH589, induces expression of DNA damage response genes and apoptosis in Ph - acute lymphoblastic leukemia cells. Blood 111 : 5093–5100. doi: 10.1182/blood-2007-10-117762 18349321
114. Lee JH, Choy ML, Ngo L, Foster SS, Marks PA (2010) Histone deacetylase inhibitor induces DNA damage, which normal but not transformed cells can repair. Proc Natl Acad Sci U S A 107 : 14639–14644. doi: 10.1073/pnas.1008522107 20679231
115. Conti C, Leo E, Eichler GS, Sordet O, Martin MM, Fan A, et al. (2010) Inhibition of histone deacetylase in cancer cells slows down replication forks, activates dormant origins, and induces DNA damage. Cancer Res 70 : 4470–4480. doi: 10.1158/0008-5472.CAN-09-3028 20460513
116. Gaymes TJ, Padua RA, Pla M, Orr S, Omidvar N, Chomienne C, et al. (2006) Histone deacetylase inhibitors (HDI) cause DNA damage in leukemia cells: a mechanism for leukemia-specific HDI-dependent apoptosis? Mol Cancer Res 4 : 563–573. doi: 10.1158/1541-7786.MCR-06-0111 16877702
117. Minucci S, Pelicci PG (2006) Histone deacetylase inhibitors and the promise of epigenetic (and more) treatments for cancer. Nat Rev Cancer 6 : 38–51. doi: 10.1038/nrc1779 16397526
118. Clements EG, Mohammad HP, Leadem BR, Easwaran H, Cai Y, Van Neste L, et al. (2012) DNMT1 modulates gene expression without its catalytic activity partially through its interactions with histone-modifying enzymes. Nucleic Acids Res 40 : 4334–4346. doi: 10.1093/nar/gks031 22278882
119. Brenner C, Luciani J, Bizet M, Ndlovu M, Josseaux E, Dedeurwaerder S, et al. (2016) The interplay between the lysine demethylase KDM1A and DNA methyltransferases in cancer cells is cell cycle dependent. Oncotarget 7 : 58939–58952. doi: 10.18632/oncotarget.10624 27449289
Štítky
Interní lékařstvíČlánek vyšel v časopise
PLOS Medicine
2017 Číslo 9
- Alternativní léčebné možnosti u hypercholesterolemie při intoleranci statinů
- Vliv kombinace nutraceutik na remodelaci levé komory srdeční u osob s metabolickým syndromem
- Nutraceutika a jejich ovlivnění mírného kardiometabolického rizika
- Princip účinku medu v léčbě chronických i infikovaných ran
- Superoxidovaný roztok a jeho využití v léčbě ran
Nejčtenější v tomto čísle
- Effectiveness of food supplements in increasing fat-free tissue accretion in children with moderate acute malnutrition: A randomised 2 × 2 × 3 factorial trial in Burkina Faso
- Oral tetrahydrouridine and decitabine for non-cytotoxic epigenetic gene regulation in sickle cell disease: A randomized phase 1 study
- Keeping it real: A journal editor in clinic
- Sustained effectiveness and cost-effectiveness of Counselling for Alcohol Problems, a brief psychological treatment for harmful drinking in men, delivered by lay counsellors in primary care: 12-month follow-up of a randomised controlled trial