
The epidemiology of adolescents living with perinatally acquired HIV: A cross-region global cohort analysis
In an analysis of data on adolescents with HIV infection in 51 countries, Valériane Leroy and colleagues report on antiretroviral treatment and outcomes.
Published in the journal:
. PLoS Med 15(3): e32767. doi:10.1371/journal.pmed.1002514
Category:
Research Article
doi:
https://doi.org/10.1371/journal.pmed.1002514
Summary
In an analysis of data on adolescents with HIV infection in 51 countries, Valériane Leroy and colleagues report on antiretroviral treatment and outcomes.
Introduction
It is estimated that almost 2.1 million (uncertainty bounds 1.4–2.7 million) adolescents aged 10–19 years are living with either perinatally or horizontally acquired HIV [1,2]. Prior to 2005, children perinatally infected with HIV in most of the world had poor access to antiretroviral therapy (ART), with high mortality during infancy and poor survival beyond childhood [3]. With the expansion of effective ART initially in Europe and North America, subsequently in South America and Asia, and now in Africa, the population of children living with perinatally acquired HIV surviving into adolescence and early adulthood is growing [1,4,5].
By the time children perinatally infected with HIV reach the developmental transition period of adolescence, they have been living for a decade with a chronic disease that even with ART treatment can still result in substantial morbidity [6]. Globally, it is recognized that adolescents living with perinatally acquired HIV (APHs) experience poorer HIV-related outcomes compared to younger children and adults, including higher mortality and virologic treatment failure rates and poorer retention in care [1,7–15]. Studies assessing the outcomes of APHs over time and across geographic and economic settings are limited [16]. Based on studies in adults, after 2 years on ART, HIV-associated mortality in South Africa approached that in the United States, and the differential between South Africa and Europe was substantially reduced [17]. As the global community pursues attainment of the Sustainable Development Goals by 2030, particularly to ensure healthy lives and promote wellbeing for all at all ages (Goal 3), to achieve gender equality (Goal 5), and to reduce inequality within and among countries (Goal 10), multiregional direct comparisons of APH outcomes can inform the appropriate policy responses to meet the needs of this dynamic and complex population of adolescents living with HIV [18].
The primary objective of this Collaborative Initiative for Paediatric HIV Education and Research (CIPHER) global project was to describe the global epidemiology of APH in terms of geographic and temporal trends of patient and treatment characteristics at entry into care, ART start, entry into adolescence (age 10 years), and last visit. Our secondary objective was to compare the outcomes of mortality, transfer out, and lost to follow-up (LTFU) between 10 and 15 years of age across regions, country income groups (CIGs), and birth cohorts.
Methods
Primary data collection by all participating networks was approved by their respective research ethics boards of authority, and consent or assent for study participation was provided by participants as required. The pooling of data and analysis at the UCT data center was approved by the University of Cape Town Health Research Ethics Committee (UCT HREC reference 264/2014). The study concept and a priori analysis plan are available in supplementary material (S1 Analysis Plan). All analyses were prespecified.
Study methods
The CIPHER Cohort Collaboration is a global network of observational pediatric HIV cohorts or cohort networks convened by CIPHER of the International AIDS Society. The following 12 cohort networks contributed data to this collaborative project: Baylor International Pediatric AIDS Initiative at Texas Children’s Hospital (BIPAI); European Pregnancy and Paediatric HIV Cohort Collaboration (EPPICC); International Epidemiology Databases to Evaluate AIDS (IeDEA)—Asia Pacific; IeDEA—Central Africa; IeDEA—East Africa; IeDEA—Southern Africa; IeDEA—West Africa; Caribbean, Central and South America Network for HIV Research (CCASAnet); Pediatric Late Outcomes Protocol (PACTG/IMPAACT 219/219c); Prospective Surveillance Study of Long-term Outcomes in HIV-infected Infants, Children and Adolescents (IMPAACT P1074); Médecins Sans Frontières (MSF) Pediatric Cohorts; Pediatric HIV/AIDS Cohort Study Adolescent Master Protocol (PHACS AMP); and Identifying Optimal Models for Care in Africa (Optimal Models-ICAP). The data contributed by the networks were drawn from a range of care settings, including dedicated research cohorts, routine care cohorts, and programmatic services. Using a standardized data transfer protocol based on the HIV Cohorts Data Exchange Protocol [19] and following quality checks and queries at the central University of Cape Town data center, individual-level data on 183,119 children infected with HIV were merged in May 2016. Participants contributed data to only a single network and there was no duplication of participants amongst networks.
Analytic methods
We conducted a retrospective cohort analysis. APHs were defined as children infected with HIV with at least one documented HIV care visit prior to age 10 years, as a proxy for perinatally acquired HIV, and as having at least one additional HIV care visit after 10 years of age. Children with known nonvertical routes of HIV infection, e.g., horizontal transmission from blood products, unsafe injections, or sexual abuse, were excluded. Our primary analysis described patient and treatment characteristics of APH at key time points, including first HIV-associated clinic visit, ART start, age 10 years, and last visit, and compared these characteristics by geographic region, CIG, and birth cohort. Observation time was censored at 19 years of age in adolescents with follow-up beyond this age.
The first visit was defined as the first recorded date in the database of any contact with a healthcare facility for HIV-related care, and first visit measurements (height, CD4 T lymphocyte counts and percentages, and HIV viral load) were taken as the closest measurement to the first visit date but could be no later than 182 days after the first visit. If ART was started within 182 days of the first visit, only measurements up to 14 days after ART start were considered. The date of ART start was defined as the earliest date in the network database of initiation of any two antiretroviral drugs prior to the year 2000 or three or more antiretroviral drugs from the year 2000 or later. Measurements at ART start were taken as those closest to the ART start date but limited to a window of 182 days prior to or 14 days after ART start. Measurements at age 10 years were taken as those closest to the child’s 10th birthday, limited to a window of 182 days either side of the 10th birthday. The last visit was defined as the last date of any recorded visit, laboratory test, or ART record. Measurements at the last visit were taken as those closest to the last visit date, within a window of 18 months prior to the last visit date, to allow for only annual monitoring in stable patients on ART. It is possible for there to be overlap, with individual measurements classified as occurring at more than 1 time point, e.g., a measurement classified as a first visit measurement can also be classified as an ART start measurement and similarly for measurements at age 10 years and last visit. World Health Organization (WHO) height-for-age Z-scores (HAZs) were calculated for APHs in all regions from the measured heights using the WHO “igrowup_restricted” Stata macro for HAZ up to 5 years of age [20] and the “who2007” Stata macro for HAZ from 5–19 years of age [21]. Stunting was defined as HAZ < −2 standard deviations from the mean. Viral suppression was considered as an HIV viral load measurement of less than 400 copies/ml or less than the level of detection of the test at the time, if greater than 400 copies/ml. Geographic regions were categorized as Europe, North America, South America and the Caribbean, South and Southeast Asia, and sub-Saharan Africa. CIGs were assigned according to World Bank CIG classification for the median year of first visit for each country [22]. Birth cohorts were categorized as born prior to 1995, born between 1995 and 1999, and born between 2000 and 2005.
Our secondary analysis focused on patient outcomes between 10 and 15 years of age and classified as mortality, transfer out, LTFU, or alive and retained in care. Mortality included all-cause mortality, as reported in the database. Transfer out included documented transfer to a different HIV care site for any reason. LTFU was defined as no observed visit for more than 365 days before the last observed visit for the cohort. APHs classified as LTFU were censored 365 days after their last observed visit. APHs considered to be alive and in care at database closure were those not known to have died or transferred and with an observed visit within 365 days prior to the last visit for the cohort. Cumulative incidence functions for the outcomes mortality, transfer out, and LTFU at 15 years of age were calculated using competing risks analysis for the whole cohort as well as by region, CIG, and birth period, with person-time accruing from age 10 years [23]. Cumulative incidence functions for birth cohorts stratified separately by region or by CIG were calculated for the outcomes at 13 years of age due to few APHs in the most recent birth cohort having reached the age of 15 years. Transfer out and LTFU were both considered to be competing risks for mortality rather than censoring events. This approach was chosen because the survival distribution of adolescents transferred out or LTFU is likely to be different to those retained in care, with better survival in stable transferred patients and poorer survival in patients LTFU and possibly no longer on ART [23]. For comparison, cumulative mortality estimates at 15 years of age were also calculated using the Kaplan-Meier product limit estimator.
Mortality hazard ratios (HRs) and 95% confidence intervals (CIs) were calculated for geographic regions using Cox proportional hazard models, with Europe as the reference group. Continuous variables, including age, CD4 count, and CD4 percent were included in the Cox models as continuous variables after confirming a linear relationship with mortality. Proportionality assumptions were evaluated using the Schoenfeld test. Adjusted HRs (aHRs) were calculated, adjusting for baseline differences between regions. Missing CD4 and height measurements were imputed for the multivariable models using multiple imputation (MI) by chained equations [24]. The imputation model contained all measured variables and used predictive mean matching for CD4 counts. Imputation of missing CD4 measurements was performed for all countries and subsequently also restricted to only countries with at least 50 CD4 measurements at first visit or, for countries with fewer than 50 APHs, at least 50% of APHs with CD4 measurements at first visit. Sensitivity analyses were conducted to better understand how LTFU may have biased mortality estimates. Firstly, inverse probability weighting (IPW) was applied to the multivariable model, giving greater weight to APHs not LTFU but with characteristics similar to APHs who were LTFU. Secondly, under varying assumptions about the proportion of LTFU that could be due to mortality, mortality was randomly assigned to a proportion of APHs that were originally classified as LTFU [25]. Unadjusted HRs (uHRs) as well as cumulative incidence functions were recalculated under these assumptions. All analyses were conducted using Stata version 13.0 (StataCorp, College Station, TX, USA), and the “stcompet” package was used to calculate the cumulative incidence functions from the competing risks analysis. Figures were plotted using the ggplot2 package in R version 3.2.2 (R Foundation for Statistical Computing, Vienna, Austria).
Results
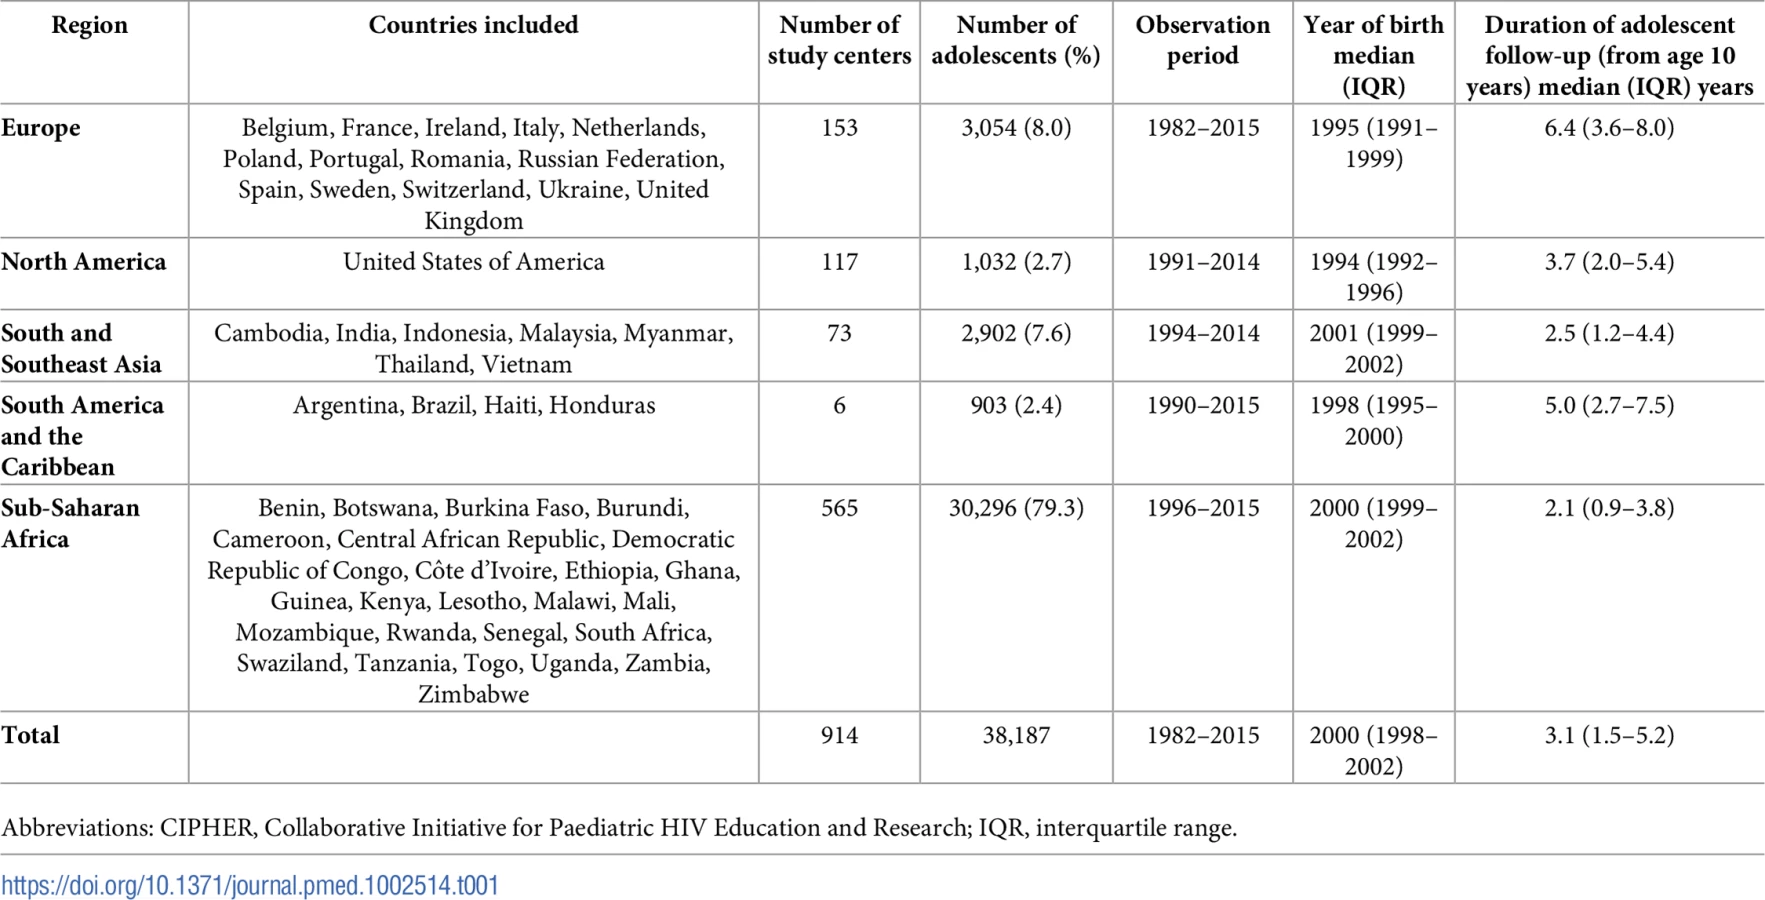
Of the 183,119 children included in the CIPHER multiregional dataset, a total of 38,187 APHs were included (Fig 1), from 51 countries across 5 regions of the world, with 79% from sub-Saharan Africa (Table 1). Observation started as early as 1982 in Europe and 1996 in sub-Saharan Africa and continued until at least 2014 in all regions. The median (interquartile range [IQR]) year of birth was earliest in North America (1994 [1992–1996]) and latest in South and Southeast Asia, (2001 [1999–2002]). A total of 112,976 person-years were observed between 10 and 19 years of age, and the median (IQR) duration of adolescent follow-up was longest in Europe (6.4 [3.6–8.0] years) and shortest in sub-Saharan Africa (2.1 [0.9–3.8] years) (Table 1). Overall, 44% (46/104) of included cohorts provided data only on APHs that had ever received ART.

Comparison by geographic region
More than two-thirds of APHs living in sub-Saharan Africa and South and Southeast Asia were born between 2000 and 2005, compared to only 7% of APHs in North America (Table 2). In all regions, approximately half of the APHs were female. Median (IQR) age at first visit differed substantially by region, ranging from 0.7 (0.3–2.1) years in North America to 7.1 (5.3–8.6) years in sub-Saharan Africa. Similarly, APHs in North America started ART at a median (IQR) age of 0.9 (0.4–2.6) years, compared to 7.9 (6.0–9.3) years in sub-Saharan Africa (Table 2, Fig 2 Panel A). In the 61% of APHs with a CD4 count or percent measurement recorded at ART start, the median (IQR) CD4 count was 321 (165–575), with substantial variation by region (Table 2). Similarly, median (IQR) CD4 percent at ART start varied by region and was highest in North America (28% [20%–36%]) and lowest in South and Southeast Asia (10% [4%–16%]). By age 10 years and last visit there was less variation in CD4 percent by region (Fig 2 Panel B). Median (IQR) HAZ at first visit and ART start was well below WHO normative data in all regions and lowest in South and Southeast Asia, at −2.36 (−3.26–−1.42) at first visit and −2.41 (−3.31–−1.51) at ART start (Fig 2 Panel C). In APHs in Europe and North America, HAZ improved by age 10 years and last visit, but at least 25% of APHs in South and Southeast Asia, South America and the Caribbean, and sub-Saharan Africa remained stunted at their last visit (Table 2). Eighty-eight percent of APHs received ART at some stage, of whom 12% started ART after age 10 years and 80% remained on ART at their last visit. Of the 7,401 (19%) APHs not known to be on ART at their last visit, 62% were ART naïve. Only 38% of all APHs had an HIV viral load recorded at some stage, and this proportion was lowest in sub-Saharan Africa, at 25% (Table 2). Of those with an HIV viral load measurement and on ART at their last visit, 72% (9,388/13,114) were virologically suppressed.


By competing risks analysis, the cumulative incidence estimates (95% CI) at 15 years of age for mortality, transfers out, and LTFU for all APHs were 2.6% (2.4%–2.8%), 15.6% (15.1%–16.0%), and 11.3% (10.9%–11.8%), respectively (Table 2). Cumulative incidence of mortality before any other competing event occurred was estimated to be lowest in Europe (0.8% [0.5%–1.1%]) and highest in South America and the Caribbean (4.4% [3.1%–6.1%]) (Table 2). However, LTFU before mortality or transfer out was lowest in South America and the Caribbean (4.8% [3.4%–6.7%]) and highest in sub-Saharan Africa (13.2% [12.6%–13.7%]). Transfers out before mortality or LTFU were also highest in sub-Saharan Africa (19.3% [18.7%–20.0%]). Cumulative mortality (95% CI) when estimated by the Kaplan-Meier product limit estimator was similar, at 3.0% (2.8%–3.3%) for the total cohort, ranging from 0.8% (0.5%–1.2%) in Europe to 4.7% (3.3%–6.6%) in South America and the Caribbean (S1 Table).
Comparison by CIG
Sixty-five percent of all APHs in this cohort lived in low-income countries, 7.9% in lower-middle-income-, 17.5% upper-middle-income-, and 9.7% in high-income countries. Variation in characteristics by CIG followed the geographic region trends, with younger age, higher CD4 percent, and less impaired HAZ at first visit and ART start in APHs in high-income countries compared to upper-middle-, lower-middle-, or low-income countries (Table 3, Fig 3). Mortality before transfer out or LTFU was lowest in high-income countries (0.9% [0.6%–1.3%]) and highest in low-income countries (3.5% [3.1%–3.8%]) (Table 3). However, LTFU before mortality or transfer out was highest in upper-middle-income countries (12.8% [11.8%–13.9%]).


Comparison by birth cohort
Fifty-eight percent of all APHs were born in the year 2000 or later, ranging from 0.3% living in North America and 2.8% in high-income countries to 86.9% living in sub-Saharan Africa and 73.6% in low-income countries (S2 Table). Three-quarters (76.7%) of APHs born prior to 1995 lived in Europe and North America, and age at first visit and ART start appeared to be younger and CD4 count, CD4 percent, and HAZ at first visit and ART start appeared to be better in this group compared to those born in later calendar periods (S2 Table, S1 Fig). However, for the two more recent birth cohorts, the majority of APHs were from sub-Saharan Africa, and age at first visit and ART start was younger and CD4 count higher in APHs born during 2000–2005 than 1995–1999. HAZ, however, did not show any improvement over time at ART start or at last visit for APHs born between 2000 and 2005 compared to APHs born between 1995 and 1999. Mortality before transfer or LTFU was lowest in APHs born between 2000 and 2005 (1.84% [95% CI 1.50%–2.23%]), although LTFU in this group was also more than double that of the previous 2 birth periods (23.34% [95% CI 19.96%–26.88%]). When looking at birth cohort trends by region, mortality declined in every region for APHs born between 2000 and 2005 compared to those born in the earlier birth cohorts, and no mortality was observed in the most recent APH birth cohort in Europe, North America, and South America and the Caribbean (S3 Table). However, LTFU increased for APHs born between 2000 and 2005 in all regions except South America and the Caribbean.
Mortality hazards compared by region
Relative to Europe, the unadjusted mortality HR (95% CI) was significantly higher in South and Southeast Asia (3.21 [2.03–5.07]), South America and the Caribbean (6.07 [3.87–9.50]), and sub-Saharan Africa (4.35 [3.02–6.28]) but not in North America (1.70 [0.87–3.31]) (Table 4, model 1). After controlling for baseline characteristics, including sex, birth cohort, age at first visit, and any ART received, the aHR increased slightly for North America and decreased for sub-Saharan Africa (Table 4, model 2). Inclusion of IPW in the model marginally reduced the HR further for all regions except North America (Table 4, model 3). Adjustment for CD4 measures, either as CD4 count or CD4 percent, at first visit only or time-updated and with or without MI for missing CD4 measures, also altered the individual region aHRs relative to Europe, but the general pattern remained of elevated mortality in all regions relative to Europe and substantially elevated mortality in sub-Saharan Africa and South America and the Caribbean (Table 4 and S4 Table).

Sensitivity analyses
In sensitivity analyses, under varying assumptions of the proportion of APHs classified as LTFU who may be cases of unascertained mortality, the cumulative incidence for mortality before transfer out or LTFU in sub-Saharan Africa could be as high as 14.9% (95% CI 14.3%–15.5%) if 100% of APHs LTFU was truly mortality (S5 Table). Under the assumption that 100% of LTFU is due to mortality in all regions, the relative difference in mortality is attenuated in all regions in comparison to Europe, with the highest uHR in sub-Saharan Africa, at 1.46 (95% CI 1.33–1.61) (S6 Table). If it is differentially assumed that, in sub-Saharan Africa, 50% of LTFU is unascertained mortality but only 5% in all other regions, the uHR for mortality in sub-Saharan Africa may be as high as 7.09 (95% CI 5.45–9.23), relative to Europe.
Discussion
To our knowledge, this is the largest analysis of APHs to date, describing the characteristics and outcomes of more than 38,000 APHs across more than 100,000 person-years of follow-up during adolescence, from 5 regions of the world, including 14 of the 15 highest adolescent HIV burden countries [1] and across low-, middle-, and high-income countries. This analysis essentially describes characteristics of and care for younger adolescents (10–14 years of age), 79% of whom were living in sub-Saharan Africa. Our findings show that APHs in North America and Europe, as well as high-income group countries, generally presented to care and started ART at a younger age and with higher CD4 counts, and less impaired height, compared to other regions or CIGs. Conversely, age at presentation to care and ART start was highest in sub-Saharan Africa. Despite probable under-ascertained mortality in some regions, the hazard of HIV-associated mortality during adolescence was substantially higher in sub-Saharan Africa, South and Southeast Asia, and South America and the Caribbean than in Europe. Results suggested that mortality may also have been higher in North America than in Europe. Analysis by CIG followed these geographic trends, with results suggesting younger age, higher CD4 percent, and less impaired height at first visit and ART start in high-income countries compared to middle - or low-income countries.
Results also suggested a marked difference in regional and income group distributions across birth cohort groups. APHs from North America and Europe and, likewise, high-income countries predominated in the earliest birth cohort, with minimal representation from Asia and Africa, while the most recent birth cohort was dominated by APHs living in sub-Saharan Africa. Younger age, higher CD4, and less impaired growth in the earliest birth cohort reflected this regional and CIG distribution. These vastly different characteristics of APHs across regions and over time require careful adjustment and interpretation due to different effects of variables across time. Nevertheless, some improvements for all APHs born after 2000 compared to those born during 1995–1999 are evident, including younger age and higher CD4 count at first presentation and ART start. This trend is expected, as criteria for initiating ART have progressively become less restrictive, with higher or no CD4 thresholds, and access to ART has expanded across the globe [3,26–29]. Despite this, height was still severely impacted in APHs in the most recent birth cohort. This may reflect that, although APHs born during 2000–2005 started ART earlier than APHs born during 1995–1999, they still only started at a median of 7 years of age, having missed the benefits of early ART on growth and probably also cognition and other morbidities, although the latter two outcomes were not evaluated in this analysis [30–32].
Comparing mortality across the regions is limited by high LTFU in sub-Saharan Africa relative to other regions. Furthermore, LTFU rates in Europe may be overestimated due to a reporting delay for some cohorts. Higher LTFU has been described in cohorts with shorter durations of follow-up, in which people may not yet have had the opportunity to return to care, while in cohorts of longer durations, people previously considered LTFU subsequently return to care [33]. This could affect patients born in the most recent birth cohorts in our analysis, particularly in sub-Saharan Africa. Methods have advanced in adult HIV cohort research to informatively adjust mortality estimates for under-ascertainment in those LTFU, informed by studies that actively traced patients LTFU to determine their vital status [34–37]. However, a recent systematic review identified few such tracing studies in children or adolescents living with HIV [25]. One study from Malawi traced 201 children who were LTFU and, of the 79% who were successfully traced, 11% had died, 26% had transferred to another clinic, and 25% were alive but no longer on ART [38]. A better understanding of how program LTFU can bias mortality estimates specifically in adolescents is needed to truly understand the impact on mortality in adolescents living with HIV [1].
This study has limitations. As mode of transmission is generally poorly captured in routine care cohorts, we used a pragmatic definition of APH and included only children infected with HIV who had entered care before age 10 years. This was done to ensure exclusion of adolescents with horizontally acquired HIV, who have a very different disease profile during adolescence to APHs [39]. As a result of this approach, we may have excluded a relatively small but important group of APHs diagnosed and entering care after age 10 years [40,41]. Our analysis does not include Nigeria, a country with the second largest burden of adolescents living with HIV and the only country in which mortality in younger adolescents (10–14 years of age) is estimated to be rising [1]. Furthermore, the North American region is represented only by the US in this analysis, and findings may not necessarily be generalizable to other North American countries. Our analysis may overrepresent APHs treated in healthcare settings with higher standards of care compared to the general population of adolescents, thus underestimating true mortality in APHs. Additionally, approximately 44% of included cohorts collect data only on children started on ART; thus, the proportion on ART observed in this analysis is likely overestimated for some regions. HIV viral load measurements were sparsely available and possibly selectively performed in the lower CIGs, with likely targeting of HIV viral load measurements to children with clinical or immunological failure, in which HIV viral load testing is not part of routine monitoring. This would result in overestimation of the proportion of patients with an unsuppressed HIV viral load, and these HIV viral load data should be interpreted with care in this analysis.
The current generation of APHs, and those represented in this CIPHER analysis, largely reflect children infected with HIV who survived early childhood without ART but at the same time experienced substantial growth morbidity and possibly other morbidities not measured in this analysis. This current generation may be substantially different to future cohorts of APHs, who will have been more likely to have started ART in infancy and may be affected by different issues. It is expected that APH survival will continue to improve with greater access to early infant diagnosis and universal ART for all people living with HIV [42]. Although the population of APHs is likely to decline in the future due to declines in new perinatally acquired HIV infections, there is still a lot of work to be done to achieve equality in health and survival for all APHs, irrespective of geographic location. Collaborations such as CIPHER enable us to monitor current global temporal trends in APH outcomes over time to ensure that this and future generations of APHs across the globe have the potential to thrive and contribute to society, outcomes that were denied to previous generations of children infected with HIV.
In summary, our analysis of a large cohort of APHs between 1982 and 2014 across several regions of the globe suggests that APHs generally entered HIV care at an earlier age in high-income countries compared to other CIGs. Despite probable under-ascertainment, mortality continued to be substantially higher in sub-Saharan Africa, South and Southeast Asia, and South America and the Caribbean than in Europe and warrants further monitoring and understanding.
Supporting Information
Zdroje
1. UNAIDS. UNAIDS 2016 Estimates, 2017 [cited 2017 December 27]. Available from: http://aidsinfo.unaids.org/.
2. World Health Organization, Health for the world's adolescents: a second chance in the second decade. Geneva, Switzerland: World Health Organization; 2014 [cited 2017 January 06]. Available from: http://apps.who.int/adolescent/second-decade/files/1612_MNCAH_HWA_Executive_Summary.pdf.
3. Davies MA, Gibb D, Turkova A. Survival of HIV-1 vertically infected children. Curr Opin HIV AIDS. 2016;11(5):455–64. doi: 10.1097/COH.0000000000000303 27716730
4. Judd A, Doerholt K, Tookey PA, Sharland M, Riordan A, Menson E, et al. Morbidity, mortality, and response to treatment by children in the United Kingdom and Ireland with perinatally acquired HIV infection during 1996–2006: planning for teenage and adult care. Clin Infect Dis. 2007;45(7):918–24. doi: 10.1086/521167 17806062
5. Johnson LF, Davies MA, Moultrie H, Sherman GG, Bland RM, Rehle TM, et al. The effect of early initiation of antiretroviral treatment in infants on pediatric AIDS mortality in South Africa: a model-based analysis. Pediatr Infect Dis J. 2012;31(5):474–80. doi: 10.1097/INF.0b013e3182456ba2 22189531
6. Lowenthal ED, Bakeera-Kitaka S, Marukutira T, Chapman J, Goldrath K, Ferrand RA. Perinatally acquired HIV infection in adolescents from sub-Saharan Africa: a review of emerging challenges. Lancet Infect Dis. 2014;14(7):627–39. doi: 10.1016/S1473-3099(13)70363-3 24406145
7. Judd A, Chappell E, Doerholt K, Galli L, Giaquinto C, Gibb D, et al. Long-term trends in mortality and AIDS-defining events among perinatally HIV-infeced children across Europe and Thailand. International AIDS Conference; 19 July 2016; Durban, South Africa 2016.
8. Zanoni BC, Mayer KH. The adolescent and young adult HIV cascade of care in the United States: exaggerated health disparities. AIDS Patient Care STDS. 2014;28(3):128–35. doi: 10.1089/apc.2013.0345 24601734
9. Salou M, Dagnra AY, Butel C, Vidal N, Serrano L, Takassi E, et al. High rates of virological failure and drug resistance in perinatally HIV-1-infected children and adolescents receiving lifelong antiretroviral therapy in routine clinics in Togo. J Int AIDS Soc. 2016;19(1):20683. doi: 10.7448/IAS.19.1.20683 27125320
10. Kahana SY, Jenkins RA, Bruce D, Fernandez MI, Hightow-Weidman LB, Bauermeister JA, et al. Structural Determinants of Antiretroviral Therapy Use, HIV Care Attendance, and Viral Suppression among Adolescents and Young Adults Living with HIV. PLoS ONE. 2016;11(4):e0151106. doi: 10.1371/journal.pone.0151106 27035905
11. Maskew M, Bor J, MacLeod W, Carmona S, Sherman G, Fox MP. The youth treatment bulge in South Africa: increasing numbers, inferior outcomes among adolescents on ART. International AIDS Conference; 19 July 2016; Durban, South Africa 2016.
12. Nsanzimana S, Kanters S, Remera E, Forrest JI, Binagwaho A, Condo J, et al. HIV care continuum in Rwanda: a cross-sectional analysis of the national programme. Lancet HIV. 2015;2(5):e208–e15. doi: 10.1016/S2352-3018(15)00024-7 26423003
13. Fish R, Judd A, Jungmann E, O'Leary C, Foster C, Network HIVYP. Mortality in perinatally HIV-infected young people in England following transition to adult care: an HIV Young Persons Network (HYPNet) audit. HIV Med. 2014;15(4):239–44. doi: 10.1111/hiv.12091 24112550
14. Judd A, Lodwick R, Noguera-Julian A, Gibb DM, Butler K, Costagliola D, et al. Higher rates of triple-class virological failure in perinatally HIV-infected teenagers compared with heterosexually infected young adults in Europe. HIV Med. 2016;18 : 171–80. doi: 10.1111/hiv.12411 27625109
15. Schomaker M, Leroy V, Wolfs T, Technau KG, Renner L, Judd A, et al. Optimal timing of antiretroviral treatment initiation in HIV-positive children and adolescents: a multiregional analysis from Southern Africa, West Africa and Europe. Int J Epidemiol. 2016:dyw097. Epub 2016 Jun 24. doi: 10.1093/ije/dyw097 27342220
16. Kekitiinwa A, Lee KJ, Walker AS, Maganda A, Doerholt K, Kitaka SB, et al. Differences in factors associated with initial growth, CD4 and viral load responses to ART in HIV-infected children in Kampala, Uganda and the United Kingdom/Ireland. J Acquir Immune Defic Syndr. 2008;49(4):384–92. doi: 10.1097/QAI.0b013e31818cdef5 18931630
17. Boulle A, Schomaker M, May MT, Hogg RS, Shepherd BE, Monge S, et al. Mortality in patients with HIV-1 infection starting antiretroviral therapy in South Africa, Europe, or North America: a collaborative analysis of prospective studies. PLoS Med. 2014;11(9):e1001718. doi: 10.1371/journal.pmed.1001718 25203931
18. United Nations. Transforming our world: the 2030 agenda for sustainable development 2015 [cited 2017 January 18]. Available from: https://sustainabledevelopment.un.org/post2015/transformingourworld/publication.
19. EuroCoord. HIV Cohorts Data Exchange Protocol 2017 [cited 2017 February 20]. Available from: http://www.hicdep.org/.
20. World Health Organization. WHO Anthro (version 3.2.2, January 2011) 2011 [cited 2017 February 20]. Available from: http://www.who.int/childgrowth/software/en/.
21. World Health Organization. WHO growth standard for school aged children and adolescents (who2007_standard) 2007 [cited 2017 February 20]. Available from: http://www.who.int/entity/growthref/tools/who2007_stata.zip.
22. World Bank. World Bank Analytical Classifications: Country Analytical History 2016 [cited 2016 March 15]. Available from: https://datahelpdesk.worldbank.org/knowledgebase/articles/906519-world-bank-country-and-lending-groups.
23. Putter H, Fiocco M, Geskus RB. Tutorial in biostatistics: competing risks and multi-state models. Stat Med. 2007;26 : 2389–430. doi: 10.1002/sim.2712 17031868
24. White IR, Royston P, Wood AM. Multiple imputation using chained equations. Stat Med. 2011;30 : 377–99. doi: 10.1002/sim.4067 21225900
25. Zurcher K, Mooser A, Anderegg N, Tymejczyk O, Couvillon MJ, Nash D, et al. Outcomes of HIV-positive Patients Lost to Follow-up in African Treatment Programs. Trop Med Int Health. 2017;22(4):375–87. doi: 10.1111/tmi.12843 28102610
26. Fatti G, Bock P, Eley B, Mothibi E, Grimwood A. Temporal trends in baseline characteristics and treatment outcomes of children starting antiretroviral treatment: an analysis in four provinces in South Africa, 2004–2009. J Acquir Immune Defic Syndr. 2011;58(3):e60–7. doi: 10.1097/QAI.0b013e3182303c7e 21857355
27. UNAIDS. The Gap Report 2014 [cited 2017 January 18]. Available from: http://www.unaids.org/en/resources/documents/2014/20140716_UNAIDS_gap_report.
28. World Health Organization. Antiretroviral therapy for HIV infection in infants and children. Recommendations for a public health approach: 2010 revision 2010 [cited 2017 January 18]. Available from: http://www.who.int/hiv/pub/paediatric/infants2010/en/.
29. World Health Organization. Consolidated guidelines on the use of antiretroviral drugs for treating and preventing HIV infection. Recommendations for a public health approach—Second edition. Geneva, Switzerland 2016 [cited 2017 January 06]. Available from: http://www.who.int/hiv/pub/arv/arv-2016/en/.
30. Sutcliffe CG, van Dijk JH, Munsanje B, Hamangaba F, Sinywimaanzi P, Thuma PE, et al. Weight and height z-scores improve after initiating ART among HIV-infected children in rural Zambia: a cohort study. BMC Infect Dis. 2011;11 : 54. doi: 10.1186/1471-2334-11-54 21362177
31. Laughton B, Cornell M, Grove D, Kidd M, Springer PE, Dobbels E, et al. Early antiretroviral therapy improves neurodevelopmental outcomes in infants. AIDS. 2012;26(13):1685–90. doi: 10.1097/QAD.0b013e328355d0ce 22614886
32. Cotton MF, Violari A, Otwombe K, Panchia R, Dobbels E, Rabie H, et al. Early time-limited antiretroviral therapy versus deferred therapy in South African infants infected with HIV: results from the children with HIV early antiretroviral (CHER) randomised trial. Lancet. 2013;382(9904):1555–63. doi: 10.1016/S0140-6736(13)61409-9 24209829
33. Johnson LF, Estill J, Keiser O, Cornell M, Moolla H, Schomaker M, et al. Do increasing rates of loss to follow-up in antiretroviral treatment programs imply deteriorating patient retention? Am J Epidemiol. 2014;180(12):1208–12. doi: 10.1093/aje/kwu295 25399412
34. Brinkhof MW, Pujades-Rodriguez M, Egger M. Mortality of patients lost to follow-up in antiretroviral treatment programmes in resource-limited settings: systematic review and meta-analysis. PLoS ONE. 2009;4(6):e5790. doi: 10.1371/journal.pone.0005790 19495419
35. Brinkhof MW, Spycher BD, Yiannoutsos C, Weigel R, Wood R, Messou E, et al. Adjusting mortality for loss to follow-up: analysis of five ART programmes in sub-Saharan Africa. PLoS ONE. 2010;5(11):e14149. doi: 10.1371/journal.pone.0014149 21152392
36. Geng EH, Glidden DV, Emenyonu N, Musinguzi N, Bwana MB, Neilands TB, et al. Tracking a sample of patients lost to follow-up has a major impact on understanding determinants of survival in HIV-infected patients on antiretroviral therapy in Africa. Trop Med Int Health. 2010;15 Suppl 1 : 63–9.
37. Egger M, Spycher BD, Sidle J, Weigel R, Geng EH, Fox MP, et al. Correcting mortality for loss to follow-up: a nomogram applied to antiretroviral treatment programmes in sub-Saharan Africa. PLoS Med. 2011;8(1):e1000390. doi: 10.1371/journal.pmed.1000390 21267057
38. Ardura-Garcia C, Feldacker C, Tweya H, Chaweza T, Kalulu M, Phiri S, et al. Early tracing of children lost to follow-up from antiretroviral treatment: true outcomes and future risks. J Acquir Immune Defic Syndr. 2015;70(5):e160–e7. doi: 10.1097/QAI.0000000000000772 26218409
39. Koech E, Teasdale CA, Wang C, Fayorsey R, Alwar T, Mukui IN, et al. Characteristics and outcomes of HIV-infected youth and young adolescents enrolled in HIV care in Kenya. AIDS. 2014;28(18):2729–38. doi: 10.1097/QAD.0000000000000473 25493599
40. Ferrand RA, Munaiwa L, Matsekete J, Bandason T, Nathoo K, Ndhlovu CE, et al. Undiagnosed HIV infection among adolescents seeking primary health care in Zimbabwe. Clin Infect Dis. 2010;51(7):844–51. doi: 10.1086/656361 20804412
41. Pegurri E, Konings E, Crandall B, Haile-Selassie H, Matinhure N, Naamara W, et al. The missed HIV-positive children of Ethiopia. PLoS ONE. 2015;10(4):e0124041. doi: 10.1371/journal.pone.0124041 25879446
42. UNAIDS. Prevention Gap Report 2016 [cited 2017 February 02]. Available from: http://www.unaids.org/sites/default/files/media_asset/2016-prevention-gap-report_en.pdf.
Štítky
Interní lékařstvíČlánek vyšel v časopise
PLOS Medicine
2018 Číslo 3
- Alternativní léčebné možnosti u hypercholesterolemie při intoleranci statinů
- Vliv kombinace nutraceutik na remodelaci levé komory srdeční u osob s metabolickým syndromem
- Nutraceutika a jejich ovlivnění mírného kardiometabolického rizika
- Princip účinku medu v léčbě chronických i infikovaných ran
- Superoxidovaný roztok a jeho využití v léčbě ran
Nejčtenější v tomto čísle
- Forced anal examinations to ascertain sexual orientation and sexual behavior: An abusive and medically unsound practice
- Polycystic ovary syndrome, androgen excess, and the risk of nonalcoholic fatty liver disease in women: A longitudinal study based on a United Kingdom primary care database
- The current and potential health benefits of the National Health Service Health Check cardiovascular disease prevention programme in England: A microsimulation study
- Cardiovascular disease and multimorbidity: A call for interdisciplinary research and personalized cardiovascular care