
Patterns of Regulatory Variation in Diverse Human Populations
The genetic basis of gene expression variation has long been studied with the aim to understand the landscape of regulatory variants, but also more recently to assist in the interpretation and elucidation of disease signals. To date, many studies have looked in specific tissues and population-based samples, but there has been limited assessment of the degree of inter-population variability in regulatory variation. We analyzed genome-wide gene expression in lymphoblastoid cell lines from a total of 726 individuals from 8 global populations from the HapMap3 project and correlated gene expression levels with HapMap3 SNPs located in cis to the genes. We describe the influence of ancestry on gene expression levels within and between these diverse human populations and uncover a non-negligible impact on global patterns of gene expression. We further dissect the specific functional pathways differentiated between populations. We also identify 5,691 expression quantitative trait loci (eQTLs) after controlling for both non-genetic factors and population admixture and observe that half of the cis-eQTLs are replicated in one or more of the populations. We highlight patterns of eQTL-sharing between populations, which are partially determined by population genetic relatedness, and discover significant sharing of eQTL effects between Asians, European-admixed, and African subpopulations. Specifically, we observe that both the effect size and the direction of effect for eQTLs are highly conserved across populations. We observe an increasing proximity of eQTLs toward the transcription start site as sharing of eQTLs among populations increases, highlighting that variants close to TSS have stronger effects and therefore are more likely to be detected across a wider panel of populations. Together these results offer a unique picture and resource of the degree of differentiation among human populations in functional regulatory variation and provide an estimate for the transferability of complex trait variants across populations.
Published in the journal:
. PLoS Genet 8(4): e32767. doi:10.1371/journal.pgen.1002639
Category:
Research Article
doi:
https://doi.org/10.1371/journal.pgen.1002639
Summary
The genetic basis of gene expression variation has long been studied with the aim to understand the landscape of regulatory variants, but also more recently to assist in the interpretation and elucidation of disease signals. To date, many studies have looked in specific tissues and population-based samples, but there has been limited assessment of the degree of inter-population variability in regulatory variation. We analyzed genome-wide gene expression in lymphoblastoid cell lines from a total of 726 individuals from 8 global populations from the HapMap3 project and correlated gene expression levels with HapMap3 SNPs located in cis to the genes. We describe the influence of ancestry on gene expression levels within and between these diverse human populations and uncover a non-negligible impact on global patterns of gene expression. We further dissect the specific functional pathways differentiated between populations. We also identify 5,691 expression quantitative trait loci (eQTLs) after controlling for both non-genetic factors and population admixture and observe that half of the cis-eQTLs are replicated in one or more of the populations. We highlight patterns of eQTL-sharing between populations, which are partially determined by population genetic relatedness, and discover significant sharing of eQTL effects between Asians, European-admixed, and African subpopulations. Specifically, we observe that both the effect size and the direction of effect for eQTLs are highly conserved across populations. We observe an increasing proximity of eQTLs toward the transcription start site as sharing of eQTLs among populations increases, highlighting that variants close to TSS have stronger effects and therefore are more likely to be detected across a wider panel of populations. Together these results offer a unique picture and resource of the degree of differentiation among human populations in functional regulatory variation and provide an estimate for the transferability of complex trait variants across populations.
Introduction
One of the fundamental questions of human population genetics is the extent to which human populations from around the world differ from one another. Population differentiation can be seen from the perspective of history, where neutral DNA sequence variation is used to reconstruct the relationships between populations given models of demography, migration, and genetic drift. The recent revolution of experimental approaches that address genome function has allowed the characterization of population differentiation with respect to variants that alter genome function. To date, two types of functional variants have attracted the most attention (i) variants that alter protein coding sequence (non-synonymous variants), and (ii) variants that are associated with levels of gene expression, i.e., regulatory variants that are also referred to as eQTLs (expression Quantitative Trait Loci). While there have been extensive studies of human population differentiation with respect to protein coding variants [1], [2], little is known about the degree of population differentiation of regulatory variants, either for those with regulatory effects on nearby genes (cis-eQTLs) or those acting over longer genomic distances (trans-eQTLs). This deficit of knowledge needs to be addressed given that it is likely that: (i) a large number of high-frequency eQTLs exist in human populations; (ii) cis-regulatory variation contributes to both population-selective effects [3], [4] and common disease signals [5], [6], [7]; (iii) a large fraction of species' differentiation is driven by regulatory changes [8], [9], [10].
An extensive number of studies have characterized the level and patterns of regulatory variation and eQTLs over the last decade. eQTLs have been studied in lymphoblastoid cell lines (LCLs) from the HapMap populations [11], [12], [13], [14], [15], in single tissues such as fat, osteoblasts and brain (cortex) [16], [17], [18], as well as across multiple tissues and cell types of the same individual to enable direct comparison of differential cis-regulatory effects [19], [20]. Collectively, these studies have demonstrated an abundance of eQTLs in all tissues, and have revealed a substantial tissue - and cell-type specific component of eQTLs. While these studies have partly addressed the degree of population differentiation among human populations for eQTLs [15], [21], they have been limited to only several well-defined populations, and in particular have not contrasted geographically proximate populations. In this study we describe the first analysis of eQTL differentiation among eight human population samples, including three populations from Africa and four admixed populations, using genome-wide expression data for 726 individuals and dense genotyping of over 1.2 million common SNPs; this comprises the most comprehensive dataset and analysis used for this purpose to date.
Methods
RNA preparation
Total RNA was extracted from lymphoblastoid cell lines of the 726 individuals of 8 HapMap populations. The numbers of individuals of each population includes: CEU: 109 Caucasians living in Utah USA, of northern and western European ancestry, CHB: 80 Han Chinese from Beijing, China, GIH: 82 Gujarati Indians in Houston, TX, USA, JPT: 82 Japanese in Tokyo, Japan, LWK: 82 Luhya in Webuye, Kenya, MEX: 45 Mexican ancestry in Los Angeles, CA, USA, MKK: 138 Maasai in Kinyawa, Kenya, and YRI: 108 Yoruba in Ibadan, Nigeria (International HapMap Constortium 2005; Coriell, Camden, New Jersey, United States). Two in vitro transcription (IVT) reactions were performed as one-quarter scale Message Amp II reactions (Ambion, Austin, Texas, United States) for each RNA extraction using 200 ng of total RNA as previously described [13]. 1.5 µg of the cRNA was hybridized to an array [14]. For RNA extractions, IVT reactions, and array hybridizations, samples were processed in an order randomized with respect to population of origin.
Gene expression quantification
To assay transcript levels in the cell lines, we used Illumina's commercial whole genome expression array, Sentrix Human-6 Expression BeadChip version 2, [Illumina, San Diego, California, United States, 22]. These arrays utilize a bead pool with ∼48,000 unique bead types (one for each of 47,294 transcripts, plus controls), each with several hundred thousand gene-specific 50mer probes attached.
On a single BeadChip, six arrays were run in parallel as described in [14]. Each of the two IVT reactions from the 726 samples was hybridized to one array each, so that each cell line had two replicate hybridizations. cRNA was hybridized to arrays, and subsequently labelled with Cy3-streptavidin [Amersham Biosciences, Little Chalfont, United Kingdom, as described in 14] and scanned with a Bead Station (Illumina) as previously described in Stranger et al. (2005). Samples were processed in an order randomized with respect to population of origin and IVT batch.
Raw expression data normalization
With the Illumina bead technology, a single hybridization of RNA from one cell line to an array produces on average approximately 30 intensity values for each of 47,294 bead types. These background-corrected values for a single bead type are subsequently summarized by Illumina software and output to the user as a set of 47,294 intensity values for each individual hybridization. In our experiment, each cell line was hybridized to two arrays, thus resulting in two reported intensity values (as averages of the values from the 30 beads per probe) for each of the 47,294 bead types. Hybridization intensity values were normalized on a log2 scale using a quantile normalization method [23] across replicates of a single individual followed by a median normalization method across all individuals of the eight populations. These normalized expression data for CEU, CHB, JPT, and YRI were used as input for the expression analysis, while the expression data from the populations with admixture (GIH, LWK, MEX, and MKK) were subjected to an additional correction for this genetic structure (See below).
Population stratification correction of expression data
The expression data for GIH, LWK, MEX and MKK populations were normalized for admixture using a customized version of EIGENSTRAT which generates principal components on the basis of genetic data [24]. Expression values were adjusted for each population using ten primary axes of variation from that population's corresponding intra-population PCA of the set of whole genome SNP genotypes. This correction for admixture also corrects for relatedness among some of the individuals in a few of the population samples as has been described in [25]. These residual normalized expression values were used as input for the association analysis.
Correction for known and unknown factors: “REDUCED” dataset generation
We employed a latent variable analysis separately for each population to correct the expression data for known and unknown factors that may influence gene expression in this dataset, with the aim to characterize and compare the properties of these results to those obtained without the correction. This dimension reduction differs from the PCA for admixture (Population stratification correction of expression data) in that it is possible to account for effects of unknown covariates, such as complex batch effects or subtle environmental influences, which can then be factored out of the expression data. The reduced expression data sets were learned using the probabilistic estimation of expression residuals (PEER) framework [26], [27]. In this framework, contributions from known and hidden global factors on gene expression levels are estimated and subtracted out to produce a residual gene expression profile. Parameter estimation is performed using variational learning, an approximate inference algorithm that generalizes expectation maximization.
We used the PEER Bayesian regression and factor analysis modules for each of the 8 populations separately to learn the global effects of known and hidden factors on gene expression. Population and gender indicators were modeled as known global factors, essentially using Bayesian regression. Jointly with modeling these known factors, 32 hidden factors were estimated using Bayesian factor analysis. The prior on the weight precisions that acts as a regularization parameter was set to (21800, 0.022) for both models. These regularization parameter influences the effective number of factors retained after training. Specific settings are the standard ARD from [26], scaled with the total number of probes in the model (see [26] for detailed discussion). All remaining priors were set to uninformative values. The residual values were used as input for subsequent analysis and are referred to throughout the manuscript as ‘REDUCED’ data.
Selection of probes to analyze
Of the 47,294 probes for which we collected expression data, we selected a set of 21,800 probes for analysis. We included in our analyses each probe that mapped to an Ensembl gene, but not to more than one Ensembl gene (Ensembl 49 NCBI Build 36), and we excluded probes mapping to the X or Y chromosome. The final set of 21,800 probes considered for association mapping corresponds to 18,226 unique autosomal Ensembl genes. We mapped known 1000 genomes common SNPs (MAF>5%) from CEU, CHB, JPT, YRI (August 2010) to all probes. We found that of the 21,800 probes we used in our analysis, 1401 (6.4% of tested probes) overlapped a known common SNP. There is the risk of a SNP-in-probe effect for these overlapping variants, inducing false positive eQTLs. We decided to not simply exclude these probes in an overly-conservative manner, but instead tested for possible enrichment among statistically significant eQTLs and compared the degree of replication across populations for those cis-eQTLs with probes to those cis-eQTLs without probes.
Genetic variation
Single nucleotide polymorphisms (SNPs) for the same 726 HapMap version 3 individuals of CEU, CHB, GIH, JPT, LWK, MEX, MKK, and YRI, were selected (Release version 2) for use in the association analyses. Any SNP with MAF>5% in a population and with less than 20% missing data was included. This corresponds to between 1.1 million and 1.3 million SNPs per population.
Structure of gene expression variation among populations
To quantify population differentiation with respect to gene expression levels, we calculated the statistic VST for each of the 21,800 probes for each pairwise combination of populations. VST is a measure of the proportion of expression level variance explained by between-population divergence, and is analogous to the population genetics parameter FST, but for a quantitative trait [28]. For a single probe measured in two populations, VST is calculated as: (VT−VS)/VT, where VT is equal to the total variance across all individuals of the pair of populations and VS is the average within-population variance weighted by each population sample size. VS = (V1*n1+V2*n2)/(n1+n2), where V1 is the within-population variance of population 1, V2 is the within population variance of population 2, and n1 and n2 are the numbers of individuals sampled from population 1 and 2, respectively. VST values range from 0 to 1, with values near 1 signifying that the majority of gene expression variance for a probe segregates between populations rather than within populations.
To address the question of whether genes of specific functional classes tend to be among those exhibiting highest expression differentiation between populations (any pair of populations), we used the VST statistic as a determinant of expression differentiation and selected the top 5% of the probes which were significantly differentiated between any two populations. Using this cutoff, we computed a one-sided Fisher's exact probability to determine enrichment of Gene Ontology (GO) terms. The GO p-values were for all pairwise comparisons were combined using Fishers combined probability, to identify those functional categories that across all pairs of populations are consistently among the most diverged between pairs of populations. To address the question of whether genes of specific functions exhibit significant population-specific expression differentiation, we used the VST score and selected the top 5% of the probes which were significantly differentiated between any two populations. Using this cutoff, we computed a one-sided Fisher's exact probability to determine enrichment of GO terms in the top 5% of probes. For a single population, such as CEU, all GO term p-values from pairwise population comparisons with CEU were combined using the Fisher combined probability and compared to the combination of GO term p-values for the other populations (in this case, excluding CEU). We then filtered from the primary population those GO enrichment terms which were also found significantly differentiated among other populations. From this filtered list, we then selected the top ten GO terms for each population. These top ten values were used as indicative of functions which are significantly differentiated between the primary population and other populations and not between any other populations.
We addressed the question of whether those functions which are significantly differentiated in one population inform differentiation in a closely-related population (i.e., differentiation of function may be shared by closely-related populations). For example, differentiation might be similar for each of CHB and JPT when individually compared to all the other six populations (or for LWK and MKK and YRI). To address this, we assessed the enrichment in the p-value distribution for GO terms predicted in one population to be significant in another population (for each comparison both populations being compared are excluded). For example, we identify the GO terms that are significantly differentiated between CHB and all other populations (excluding JPT) and compare their p-values to the p-value distribution for terms with JPT and all other populations (excluding CHB).
Association analyses
The eQTL association analysis employed: 1) Normalized log2 quantitative gene expression measurements for the 21,800 probes (18,226 unique autosomal genes) from 726 unrelated individuals of each HapMap population assayed on the Illumina Sentrix Human-6 Expression BeadChip, 2) SNP genotypes for the unrelated individuals of each HapMap population with minor allele frequency above 5%.
Association and multiple-test correction (individual populations)
For each of the selected probes interrogating expression and for each SNP, we fit a Spearman Rank Correlation (SRC) model as previously described [14], [15], [19], [29]. The model was applied to each population separately, and to each of the normalized datasets: 1) the normalized and stratification-corrected expression data, and 2) the ‘REDUCED’ expression data. To assess significance of associations of expression variation to SNP genotype, we performed 10,000 permutations of each expression phenotype (probe) relative to the genotypes. We performed a cis-eQTL analysis as follows: We limited the analysis to those probes and SNPs (MAF>5%) where the distance from the genomic location of the transcription start site (TSS) to SNP genomic location was less than or equal to 1 Mb. An association to a gene expression phenotype was considered significant if the p-value from the analysis of the observed data (nominal p-value) was lower than the threshold of the 0.01 tail of the distribution of the minimal p-values (among all comparisons for a given gene) from 10,000 permutations of the expression phenotypes [30]. We calculated the false discovery rate for associations in each population at each threshold on the basis of the number of genes tested and the significance threshold of the permutations. We also estimated FDR by evaluating the degree to which associations that are discovered in one population replicate in another population. For each population, we considered all significant associations (0.01 permutation threshold) and determined whether the SNP-probe pair corresponding to the most significant SNP/Ensembl gene replicated (0.005 nominal and same direction) in at least one other population. We estimated FDR as 1−(the number of genes with replication/total number of significant genes).
Stepwise association model
To determine whether independent cis - regulatory signals exist for a given gene, we applied a stepwise association model as follows: For each probe that had a significant cis-eQTL at the 0.01 significance threshold, we regressed out of the expression levels the effect of the most-significant SNP, re-ran the SRC analysis on the rest of the significant cis-eQTL SNPs using the resulting expression residuals, and stored those SNPs with p-values more significant than the gene's permutation threshold. This was repeated separately for each probe until there were no SNPs from the initial significant eQTL list left to test (i.e. until none pass the permutation threshold after removing the effect of the most significant SNP at that step). At each iteration step, the most-significant SNP passing the permutation threshold is stored as an independent eQTL. We compared results obtained using the permutation thresholds based on the PCA corrected expression data to those obtained using permutation thresholds based on the residuals determined at each step of the stepwise model. We observed that there was no difference in the number of detected effects (not shown), so we used the thresholds based on the PCA residuals to evaluate p-values across steps.
Results
Structure of gene expression variation among populations
We assessed the global landscape of expression using principal components analysis (PCA) (Figure S1). Unlike SNP-based PCA plots for the same populations, all populations in the expression-based PCA plot do not separate distinctly by their continental ancestry. We assessed correlation of principal component (PC) 1 from the SNP-based PCA which separates African/non-African populations against all principal components from the expression PCA and found decay of correlation from the first 50 principal components maximized at PC3 and PC7 highlighting that gene expression differences, while not distinguishable by heredity alone, are partly shaped by it (Figure S2).
To quantify population differentiation with respect to distinct gene expression levels, we calculated the statistic VST for each of 21,800 probes, corresponding to 18,226 unique autosomal Ensembl genes (see Methods), for each pairwise combination of populations. For each pairwise comparison of populations, the distribution of VST values was heavily skewed toward values near 0, with a long narrow tail comprised of values between 0 and 1 (Table S1 and Figure S3). Individual pairwise combinations of populations differ with respect to numbers of genes exhibiting high VST genes (Table S1) such that the amount of VST between a pair of populations is correlated with the degree of genetic distance; For example, the CHB-JPT combination only has 13 genes with VST greater than 0.2, whereas the CHB-MKK combination has 4031 genes with VST greater than 0.2. Together these analyses indicate that the vast majority of genes do not exhibit highly differentiated expression variation between populations, however every pairwise combination of populations has genes with highly structured expression variation. Analysis of the union of probes exhibiting top 5% VST scores from each pairwise population comparison indicates a significant enrichment of Gene Ontology (GO) terms, including nucleus, protein binding, RNA binding, nucleotide binding, RNA splicing (Table S2). Each of the eight populations also exhibited significant population-specific GO term enrichment when top population-specific VST scores were analyzed (Table S3). For example, CEU exhibits an enrichment in immune response (GO:0006955, p-value 6.7×10⁻⁶) and regulation of immune response (GO:0050776, p-value 4.05×10⁻⁵), indicating strong structure of expression variation for genes of these categories in CEU versus other populations, and that this structure is not seen between any other populations. We also addressed the question of whether those functions which are significantly differentiated in one population inform differentiation in a closely-related population (i.e., differentiation of function may be shared by closely-related populations). For example, differentiation might be similar for each of CHB and JPT when individually compared to all the other six populations (or for LWK, MKK, and YRI). In general, GO terms corresponding to genes which are significantly diverged in expression in one population relative to the others are also diverged in expression in the other, closely-related populations (Figure S4). A caveat of these analyses is that the cell lines of individual populations were initially transformed at different time points and have been subject to differing numbers of passages, so it is possible that some of the population-specific signals reflect technical issues as opposed to true population-level divergence of function. However, when we consider the number of genes with VST greater than 0.2 in relation to median FST, we do not observe that comparisons involving CEU, the oldest cell lines exhibit unusually high VST (Figure S5).
Cis associations of gene expression with SNPs
For each of the 21,800 probes (18,226 unique autosomal genes) selected for analysis, we performed a cis - association test between expression and common SNP genotypes using a Spearman Rank Correlation (SRC) model (See Methods). The model was applied to each population separately: 1) For the normalized and stratification-corrected expression data, and 2) for the REDUCED expression data. The purpose of presenting both sets of results is to compare the properties of the two sets, as opposed to simply choosing one approach over the other. We analyzed in depth those associations significant at the 0.01 permutation threshold. At this level of significance, we expect roughly 182 genes to have at least one significant association by chance, and we detected 657, 774, 698, 795, 773, 472, 947, 799 genes with a significant association in CEU, CHB, GIH, JPT, LWK, MEX, MKK, and YRI, respectively with a false discovery rate (FDR) of 18–39% per population (Table 1). Similar FDR values were obtained when evaluating the degree of replication of an eQTL discovered in one population by replication in another (see Methods) where FDR was estimated to range from 31% to 40%. A lower FDR was observed in non-African populations as expected, given that only a subset of African eQTLs will be represented in non-African samples. In total, at the 0.01 threshold we detected a non-redundant set of 3,130 genes exhibiting a significant cis association in at least one population. At higher stringency (permutation threshold 0.001), the per-population FDR ranged from 4%–11%; with a total of 1,132 genes exhibiting a significant cis association in at least one population.

As cis-eQTLs associated with probes overlaying SNPs need to be interpreted with caution, we examined our significant associations for potential artifacts. At the 0.01 permutation threshold, of the 3,292 probes with significant associations (corresponding to 3,130 genes), 249 probes (245 genes), overlaid a SNP. This means that 7.5% of the probes with a significant cis-eQTL overlaid a common SNP (compared to 6.5% among all probes), which did not represent a significant enrichment of these probes among our significant associations. We did, however, consider the effect of these associations on across-population sharing of associations, and report levels of sharing both with and without these probes. At the 0.01 permutation threshold, of the 3,130 genes exhibiting a significant cis association, 1,074 genes had a significant association in at least two populations, and 63 in all eight populations. This indicates that 34% of genes with a significant cis-association had an association in at least two of the populations, and 2% of genes in all eight populations. If we conservatively exclude those probes known to overlap common SNPs, we reduce the number of non-redundant genes exhibiting a cis-association to 2,900, but observe that 957 (33%) of the remaining genes had a significant cis-association in at least two of the populations, and 54 (2%) in all eight populations. Thus, probes with underlying SNPs are not contributing significantly to our estimates of across-population sharing (i.e., replication) of eQTLs. At higher stringency (permutation threshold 0.001), we note that none of the significant associations involve probes with underlying SNPs, and 48% of genes with a significant cis-association had an association in at least two of the populations, and 2% of genes in all eight populations (Table 1).
To increase the power of our analysis we ran the cis - association analysis using the REDUCED data (see Methods) and the same analysis parameters, and at the 0.01 permutation threshold detected 1,966, 1,950, 1,984, 2,131, 1,794, 1,131, 2,562, 2,415, genes with a significant association in CEU, CHB, GIH, JPT, LWK, MEX, MKK, and YRI, respectively with a false discovery rate (FDR) of 7–16% per population (Table 2). In total, there is a non-redundant set of 5,691 genes showing a significant cis association in at least one population, 3,240 in at least two populations, and 331 in all eight populations. This indicates that 57% of genes with a significant cis-association had an association in at least two of the populations, which is an increase over the 34% replication observed using the normalized and PCA-corrrected data (Table 1). As expected given each population's sample size, all significant detected effects are relatively large; the range of Spearman's rho, the correlation coefficient, is 0.338–0.919 for the normalized and PCA-corrected data, and 0.337–0.933 for the ‘REDUCED data’ (Table S4). There is substantial overlap between genes detected from the normalized and PCA corrected data with that of the REDUCED data (Table S5). Of the genes with significant cis - associations in the REDUCED data analysis, 70–77% of the genes are novel, i.e., were not identified as having a significant cis - association in the normalized and PCA-corrected data analysis, though the vast majority of these significant p-values were close to significance thresholds in the PCA corrected data analysis (Figure S6). The additional cis-eQTLs detected in the REDUCED analysis are likely due to the increased sensitivity of the analysis (see [27]). Of the 22 to 35 percent of the cis-eQTLs that did not replicate in the REDUCED analysis, a portion were likely artifactual associations in the first analysis, or else weak effects with low power for replication (as evidenced by the lowest replication in the analysis of the smallest population, the MEX). Together, these results demonstrate that by applying dimension reduction to the expression data, we do not introduce bias, rather we increase power and replication.

Multiple effects underlying cis-eQTLs
To quantify the degree to which multiple cis-associated SNPs comprising a given cis-eQTL represent multiple, independent effects, we applied a stepwise regression framework to each probe that had at least two significant cis-eQTL SNPs at the 0.01 permutation threshold. We identified a total of 33 genes with multiple eQTLs (0.15% of all 21,800 genes tested), corresponding to 1.1% of genes with significant cis-eQTLs, or 1.7% of genes overall that had more than two significant cis-eQTL SNPs in at least one population. In CEU, fourteen genes exhibited multiple independent cis-effects (corresponding to 1.8% of genes with significant cis-eQTLs). In total, 10 genes (1.2%), 1 (0.14%), 7 (0.83%), 1 (0.12%), 0 (0%), 7 (0.71%), and 13 (1.5%) with multiple cis-eQTLs were detected for CHB, GIH, JPT, LWK, MEX, MKK and YRI respectively (Table S6). Taken together, at the 0.01 permutation threshold for all eight populations, we observed that ∼0–2% of genes with an expression association possess multiple independent cis-eQTLs effects. At most, a single gene had five independently associated SNPs, i.e., expression of TACO1 (Syn CCDC44), translational activator of mitchondrially encoded cytochrome c oxidase subunit I, a gene with a role in Leigh Syndrome, was independently associated with five SNPs in LWK.
Population sharing of cis-eQTLs
As described above, at the 0.01 permutation threshold we detected 3,130 genes that had a significant cis - association, 1,074 (34%) of which had a significant cis-eQTL in at least two populations. We evaluated whether the extent to which pairs of populations shared significant cis - associations was related to their distance as defined by SNPs, with the goal of assessing the degree of sharing of functional variation across populations of varying ancestry. Qualitatively, we observed that more closely-related populations tend to share more cis - associated genes than more distantly-related populations (Figure S7). We further considered sharing using parsimony. Assessing eQTLs discovered at the 0.01 permutation threshold and shared at least at the 0.1 permutation threshold, we used an estimate of the general population structure of these eight populations to identify significant subpopulation sharing between CHB+JPT, CEU+GIH and CEU+GIH+JPT+CHB (Figure S8). For eQTLs estimated as ancestral (or recurrent) to all populations using this methodology we did not find any enrichment in particular functional categories (no GO terms had a 0.05 significance after Bonferroni correction).
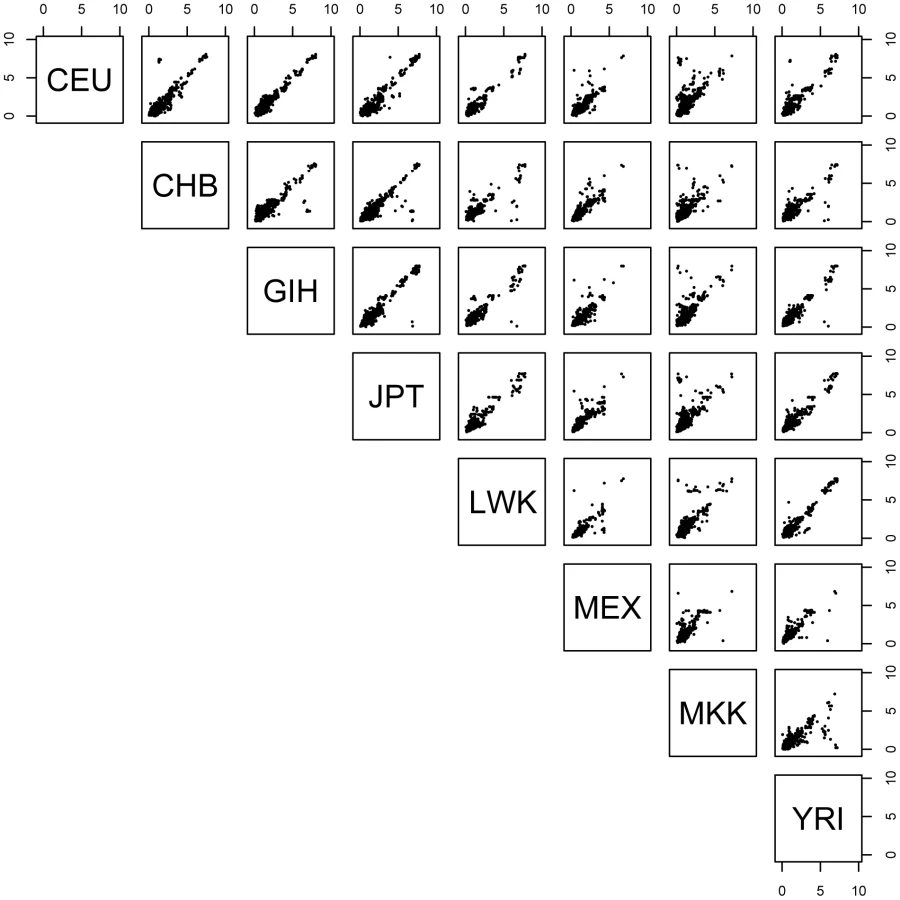
For each pairwise combination of populations, we examined those SNP-probe pairs that were significant in both populations and determined the proportion that had the allelic effect in the same direction in both populations. As described above, at the 0.01 permutation threshold we detected 1,074 genes with a significant cis - association in at least two populations. Among the 28 population pairs, we observed 98.9–100% concordance of allelic direction (Figure 1). Evaluation of allelic direction concordance from the ‘REDUCED data’ analysis produced nearly identical results (not shown). These results suggest that regulatory variation affects gene expression in the same direction across populations.

To quantify the degree of concordance of effect size across populations, for those SNP-probe associations significant in multiple populations, we asked whether the SNP exerts the same effect size in each of the populations, as quantified by expression level fold-change differences between homozygote genotype categories in each of the populations. We observe that the effect size (fold difference between homozygotes of the two different genotypic states of a SNP) is shared between any two populations when the association is also shared (Figure 2), and furthermore, larger effect sizes were slightly more likely to be shared (Figure S9). In addition, for SNP-probe pairs discovered in one population, if we consider the p-value distribution in the other seven for the same SNP-probe pairs, we observe extensive enrichment of low p-values as indicated by the fraction of expected true positives pi1 (Figure S10), indicating that our threshold-based estimates of across-population cis-eQTL sharing are underestimates. This result, paired with the result that effect sizes (fold-change) are similar among populations, suggests that the driving force behind the discovery of an eQTL in one population but not another is mainly due to allele frequency differences and not due to differences in absolute effect size.
Genomic properties of eQTLS
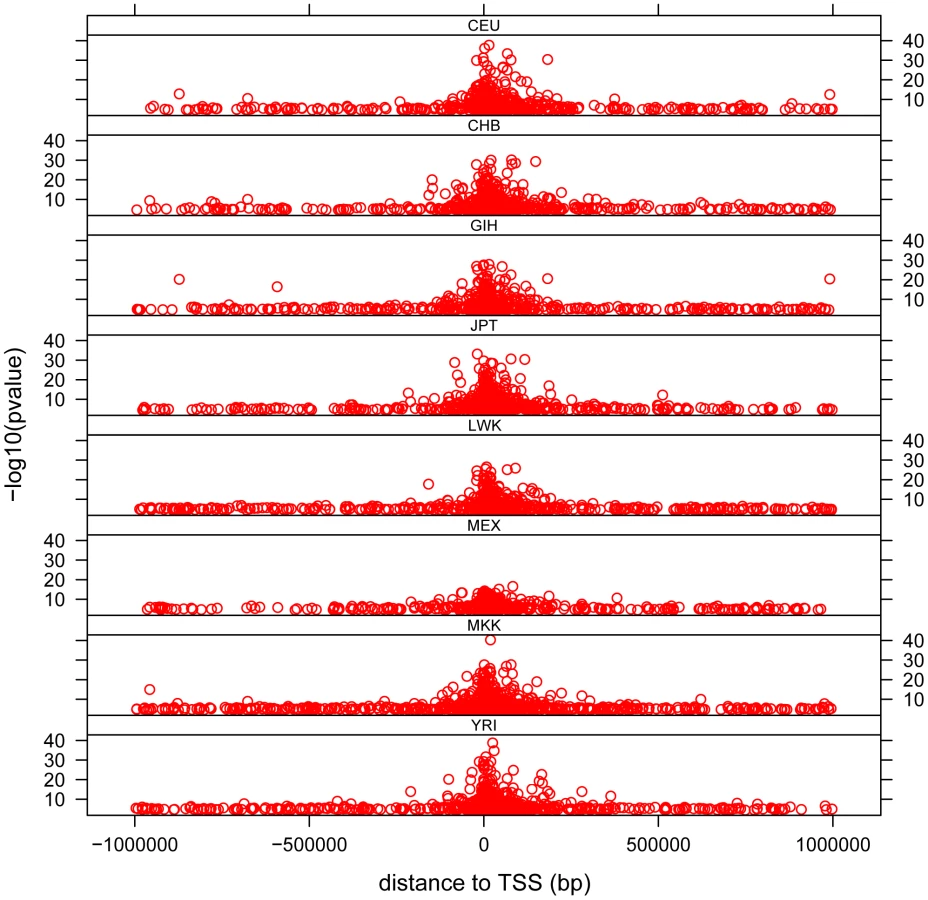
The distribution of cis - associations relative to the transcription start site (TSS) shows that the majority of association signals are approximately symmetrically centered on the TSS (Figure 3), with the majority within 100 Kb of the TSS, as has been previously observed [13], [14], [15], [19], [29]. Significant associations extend out to 1 Mb (the limit tested in this analysis), with the strongest statistical signals located directly at the TSS. Note the smallest population sample, MEX, provided the weakest statistical signals as expected. We observe a pattern to this distribution when we partition associations into categories based on the number of populations in which the gene is found to have a significant cis - association. We observe that for those genes found to have a significant cis-eQTL in only one population, the distribution of most-significantly associated SNPs are uniformly distributed throughout the 2 Mb window (Figure 4 and Figure S11). For genes with significant cis-eQTL associations in all eight populations, the distribution is centered on the TSS, with few associations extending beyond +/−200 Kb from the TSS. As population sharing increases from genes with significant associations in only one population to genes with significant associations in all eight populations, we see a gradual tightening of the distribution around the TSS. This is true for single populations (Figure S11) and when examined in aggregate across populations (Figure 4). This is unlikely to be driven simply by false positive associations that fail to replicate, as the tightening pattern is observed even when comparing associations shared in six versus seven versus eight populations, which are themselves unlikely to be false positives. This observation suggests that the genomic distribution of cis-regulatory variants with respect to their contribution to genome function is different even when deviations of allele frequency are taken into account.

We also observed that a substantial number of SNPs were associated with more than one gene. A total of 264 genes have eQTLs at the 0.01 permutation threshold organized in clusters of 2 or more genes, where the eQTL is identical among genes, suggesting same functional variant. Of these, 52 clusters of 2 or more genes were observed (and therefore replicated) in at least two populations and the distance to TSS of such eQTL-SNPs was larger relative to all other eQTL-SNPs for single genes. This signal suggests the presence of regulatory domains that influence multiple genes in a coordinated fashion and these tend to do so from long distances. Such coordinated regulation from distance is well known in the HOX cluster [31], but our data suggests that this may be a more general phenomenon.
eQTLs and disease
The integration of eQTL results with GWAS has been proposed as a way to move toward biological and mechanistic understanding of complex trait etiology [32], [33], and is already achieving success [e.g.,34]. It has also recently been demonstrated that genome-wide association signals are enriched for eQTLs [5], [6], [7]. We compared our cis-eQTL results to the National Institute of Health's catalog of genome-wide association studies [35], [36], and found that of 4,772 GWAS SNPs representing 475 traits (available as of August 4, 2011), 62 SNPs were also the most-significant SNP of a cis-eQTL in at least one population (0.01 permutation threshold, ‘REDUCED’ analysis). These 62 SNPs associate with expression of 57 Ensembl genes, and 51 traits, including Alcohol dependence, Crohn's disease, Coronary Heart Disease, HDL cholesterol, Prostate Cancer, Trigylcerides, and many others (Table S7). The majority of GWAS studies have been performed in populations of Caucasian ancestry, however the overlap of GWAS SNPs to the strongest-associated cis-eQTLs did not reflect this; instead all populations were represented (CEU: N = 14 SNPs, CHB: N = 10, GIH: N = 9, JPT: N = 21, LWK: N = 8, MEX: N = 10, MKK: N = 9, YRI: N = 8). Of the 62 SNPs that were the most significant cis-eQTL for a given gene as well as associated to a trait in the GWAS catalog, we observed that 15 (∼24%) were the most significant SNP of the same gene in at least one additional population, a proportion which is likely an underestimate of the true value, given that the same SNPs weren't necessarily tested in all populations. We asked whether across-population replication of the most significant SNP per gene differed depending on whether that SNP was a GWAS SNP, and observed no difference (Fisher's 2-tailed p-value 0.128). The eQTLs identified through our analyses contribute significantly to the available functional regulatory data that could be used to fine-map and elucidate the function of genetic variants contributing to complex phenotypes.
Discussion
We have performed a comprehensive study of cis - regulatory variation in a single cell type of individuals comprising a diverse set of eight human populations. The analysis of the genetics of nearly 20,000 gene expression phenotypes in such a number of human population samples allows us to identify large numbers of functionally variable regulatory regions in the human genome, as well as to estimate the degree of an aspect of functional variation that has not been assessed before. We find that at least 20% of the genes tested in our analysis have a common cis-eQTL in at least one population, and we detect extensive sharing of eQTLs across human populations even with fluctuations in allele frequencies, while there is also substantial non-genetic variance in gene expression levels. Overall, our data show that across all populations, there is an enrichment among population differentiated genes for those genes involved in regulatory function, while each population has unique sets of sets of genes, and categories of gene function, whose expression levels differentiate that population.
In accordance with previous eQTL studies, we observe a symmetric distribution of eQTLs around the transcription start site (TSS), with the strongest, most highly replicated, signals directly at the TSS. The simplest explanation for the relationship between distance to TSS and replication across populations is one of statistical power, as the long-distance smaller effects are less likely to be replicated. However we cannot exclude the possibility that these patterns, at least in part, reflect true biology such as the nature of long-distance enhancers. We applied factor analysis to the gene expression data to account for global non-genetic effects on the expression profiles and increased our power to detect eQTLs, especially those of smaller effect. The additional cis-eQTL associations detected using the residual gene expression profiles (‘REDUCED’ data) have very similar characteristics to those detected using the straightforward normalized and PCA-corrected data, however the degree of across-population replication was higher for the ‘REDUCED’ data, which provides confidence that the method is not simply adding false positive associations. Indeed, this demonstrates that by applying dimension reduction, we do not introduce bias, rather we increase power and replication. For associations detected in more than one population, we find nearly perfect concordance of allelic direction across populations, and find that the absolute allelic effect size, as estimated by the fold-change between the two homozygote classes, remains the same across populations, suggesting little in the way of modification of eQTL effects across populations. The last two results support the idea that while eQTLs may explain different degrees of population variance depending on their frequency in each population [21], the absolute effects on each individual are the same. Given that many GWAS signals are likely to be eQTLs [5], [6], it is likely that many of the GWAS signals discovered in one population may be transferable at the level of the absolute individual risk to other populations. One final observation is that we were able to refine our signals at individual loci to identify putative independently-acting cis-eQTLs.
Our study represents the most genetically diverse eQTL study undertaken in humans to date, and has revealed extensive cis-regulation of gene expression in a single cell type. Taken together, our results suggest extensive cis - regulatory variation in humans, much of which will be uncovered as additional cell types are analyzed under a variety different cellular and developmental conditions, in larger numbers of individuals representing an even wider representation of human genetic diversity. Already these analyses contribute to the functional annotation of the human genome, and as a resource we have provided a list of variants that are associated with complex traits and are also the most significant SNP for an eQTL in this cell type. Given the genome-wide scale of these data and the diversity of populations surveyed, these eQTLs may assist in fine-mapping causal variants for complex traits and provide testable hypotheses for the mechanism underlying significant GWAS associations. Finally, our results reveal substantial diversity in frequency of regulatory variants among populations, with future work to understand how that spectrum has been shaped by selective and demographic processes, and how these functional variants contribute to higher order phenotypes, including those of health and disease.
Accession numbers
The expression data reported in this paper have been deposited in the Array Express (http://www.ebi.ac.uk/arrayexpress/) database (Series Accession Number E-MTAB-264). Furthermore, all eQTL results have been stored in the searchable online GENEVAR eQTL database [37].
Supporting Information
Zdroje
1. BustamanteCDFledel-AlonAWilliamsonSNielsenRHubiszMT 2005 Natural selection on protein-coding genes in the human genome. Nature 437 1153 1157
2. BoykoARWilliamsonSHIndapARDegenhardtJDHernandezRD 2008 Assessing the evolutionary impact of amino acid mutations in the human genome. PLoS Genet 4 e1000083 doi:10.1371/journal.pgen.1000083
3. KudaravalliSVeyrierasJBStrangerBEDermitzakisETPritchardJK 2009 Gene expression levels are a target of recent natural selection in the human genome. Mol Biol Evol 26 649 658
4. TorgersonDGBoykoARHernandezRDIndapAHuX 2009 Evolutionary processes acting on candidate cis-regulatory regions in humans inferred from patterns of polymorphism and divergence. PLoS Genet 5 e1000592 doi:10.1371/journal.pgen.1000592
5. NicaACMontgomerySBDimasASStrangerBEBeazleyC 2010 Candidate causal regulatory effects by integration of expression QTLs with complex trait genetic associations. PLoS Genet 6 e1000895 doi:10.1371/journal.pgen.1000895
6. NicolaeDLGamazonEZhangWDuanSDolanME 2010 Trait-associated SNPs are more likely to be eQTLs: annotation to enhance discovery from GWAS. PLoS Genet 6 e1000888 doi:10.1371/journal.pgen.1000888
7. GamazonERNicolaeDLCoxNJ 2011 A study of CNVs as trait-associated polymorphisms and as expression quantitative trait loci. PLoS Genet 7 e1001292 doi:10.1371/journal.pgen.1001292
8. KingMCWilsonAC 1975 Evolution at two levels in humans and chimpanzees. Science 188 107 116
9. BlekhmanRMarioniJCZumboPStephensMGiladY 2010 Sex-specific and lineage-specific alternative splicing in primates. Genome Res 20 180 189
10. BlekhmanROshlackAGiladY 2009 Segmental duplications contribute to gene expression differences between humans and chimpanzees. Genetics 182 627 630
11. CheungVGSpielmanRSEwensKGWeberTMMorleyM 2005 Mapping determinants of human gene expression by regional and genome-wide association. Nature 437 1365 1369
12. MorleyMMolonyCMWeberTMDevlinJLEwensKG 2004 Genetic analysis of genome-wide variation in human gene expression. Nature 430 743 747
13. StrangerBEForrestMSClarkAGMinichielloMJDeutschS 2005 Genome-wide associations of gene expression variation in humans. PLoS Genet 1 e78 doi:10.1371/journal.pgen.0010078
14. StrangerBEForrestMSDunningMIngleCEBeazleyC 2007 Relative impact of nucleotide and copy number variation on gene expression phenotypes. Science 315 848 853
15. StrangerBENicaACForrestMSDimasABirdCP 2007 Population genomics of human gene expression. Nat Genet 39 1217 1224
16. EmilssonVThorleifssonGZhangBLeonardsonASZinkF 2008 Genetics of gene expression and its effect on disease. Nature 452 423 428
17. GrundbergEKwanTGeBLamKCKokaV 2009 Population genomics in a disease targeted primary cell model. Genome Res 19 1942 1952
18. MyersAJGibbsJRWebsterJARohrerKZhaoA 2007 A survey of genetic human cortical gene expression. Nat Genet 39 1494 1499
19. DimasASDeutschSStrangerBEMontgomerySBBorelC 2009 Common regulatory variation impacts gene expression in a cell type-dependent manner. Science 325 1246 1250
20. KwanTGrundbergEKokaVGeBLamKC 2009 Tissue effect on genetic control of transcript isoform variation. PLoS Genet 5 e1000608 doi:10.1371/journal.pgen.1000608
21. SpielmanRSBastoneLABurdickJTMorleyMEwensWJ 2007 Common genetic variants account for differences in gene expression among ethnic groups. Nat Genet 39 226 231
22. KuhnKBakerSCChudinELieuMHOeserS 2004 A novel, high-performance random array platform for quantitative gene expression profiling. Genome Res 14 2347 2356
23. BolstadBMIrizarryRAAstrandMSpeedTP 2003 A comparison of normalization methods for high density oligonucleotide array data based on variance and bias. Bioinformatics 19 185 193
24. PriceALPattersonNJPlengeRMWeinblattMEShadickNA 2006 Principal components analysis corrects for stratification in genome-wide association studies. Nat Genet 38 904 909
25. PembertonTJWangCLiJZRosenbergNA 2010 Inference of unexpected genetic relatedness among individuals in HapMap Phase III. Am J Hum Genet 87 457 464
26. StegleOKannanADurbinRWinnJ 2008 Accounting for Non-genetic Factors Improves the Power of eQTL Studies. VingronMWongL 411 422 Research in Computational Molecular Biology: Springer Berlin / Heidelberg
27. StegleOPartsLDurbinRWinnJ 2010 A Bayesian framework to account for complex non-genetic factors in gene expression levels greatly increases power in eQTL studies. PLoS Comput Biol 6 e1000770 doi:10.1371/journal.pcbi.1000770
28. RedonRIshikawaSFitchKRFeukLPerryGH 2006 Global variation in copy number in the human genome. Nature 444 444 454
29. MontgomerySBSammethMGutierrez-ArcelusMLachRPIngleC 2010 Transcriptome genetics using second generation sequencing in a Caucasian population. Nature 464 773 777
30. ChurchillGADoergeRW 1994 Empirical threshold values for quantitative trait mapping. Genetics 138 963 971
31. SpitzFGonzalezFPeichelCVogtTFDubouleD 2001 Large scale transgenic and cluster deletion analysis of the HoxD complex separate an ancestral regulatory module from evolutionary innovations. Genes Dev 15 2209 2214
32. MackayTFStoneEAAyrolesJF 2009 The genetics of quantitative traits: challenges and prospects. Nat Rev Genet 10 565 577
33. StrangerBEDermitzakisET 2006 From DNA to RNA to disease and back: the ‘central dogma’ of regulatory disease variation. Hum Genomics 2 383 390
34. MusunuruKStrongAFrank-KamenetskyMLeeNEAhfeldtT 2010 From noncoding variant to phenotype via SORT1 at the 1p13 cholesterol locus. Nature 466 714 719
35. HindorffLASethupathyPJunkinsHARamosEMMehtaJP 2009 Potential etiologic and functional implications of genome-wide association loci for human diseases and traits. Proc Natl Acad Sci U S A 106 9362 9367
36. HindorffLAJunkinsHAHallPNMehtaJPManolioTA A Catalog of Published Genome-Wide Association Studies
37. YangTPBeazleyCMontgomerySBDimasASGutierrez-ArcelusM 2010 Genevar: a database and Java application for the analysis and visualization of SNP-gene associations in eQTL studies. Bioinformatics 26 2474 2476
Štítky
Genetika Reprodukční medicínaČlánek vyšel v časopise
PLOS Genetics
2012 Číslo 4
Nejčtenější v tomto čísle
- A Coordinated Interdependent Protein Circuitry Stabilizes the Kinetochore Ensemble to Protect CENP-A in the Human Pathogenic Yeast
- Coordinate Regulation of Lipid Metabolism by Novel Nuclear Receptor Partnerships
- Defective Membrane Remodeling in Neuromuscular Diseases: Insights from Animal Models
- Formation of Rigid, Non-Flight Forewings (Elytra) of a Beetle Requires Two Major Cuticular Proteins