
Histone H2B Monoubiquitination Facilitates the Rapid Modulation of Gene Expression during Arabidopsis Photomorphogenesis
Profiling of DNA and histone modifications has recently allowed the establishment of reference epigenomes from several model organisms. This identified a major chromatin state for active genes that contains monoubiquitinated H2B (H2Bub), a mark linked to transcription elongation. However, assessment of dynamic chromatin changes during the reprogramming of gene expression in response to extrinsic or developmental signals has been more difficult. Here we used the major developmental switch that Arabidopsis thaliana plants undergo upon their initial perception of light, known as photomorphogenesis, as a paradigm to assess spatial and temporal dynamics of monoubiquitinated H2B (H2Bub) and its impact on transcriptional responses. The process involves rapid and extensive transcriptional reprogramming and represents a developmental window well suited to studying cell division–independent chromatin changes. Genome-wide H2Bub distribution was determined together with transcriptome profiles at three time points during early photomorphogenesis. This revealed de novo marking of 177 genes upon the first hour of illumination, illustrating the dynamic nature of H2Bub enrichment in a genomic context. Gene upregulation was associated with H2Bub enrichment, while H2Bub levels generally remained stable during gene downregulation. We further report that H2Bub influences the modulation of gene expression, as both gene up - and downregulation were globally weaker in hub1 mutant plants that lack H2Bub. H2Bub-dependent regulation notably impacted genes with fast and transient light induction, and several circadian clock components whose mRNA levels are tightly regulated by sharp oscillations. Based on these findings, we propose that H2B monoubiquitination is part of a transcription-coupled, chromatin-based mechanism to rapidly modulate gene expression.
Published in the journal:
. PLoS Genet 8(7): e32767. doi:10.1371/journal.pgen.1002825
Category:
Research Article
doi:
https://doi.org/10.1371/journal.pgen.1002825
Summary
Profiling of DNA and histone modifications has recently allowed the establishment of reference epigenomes from several model organisms. This identified a major chromatin state for active genes that contains monoubiquitinated H2B (H2Bub), a mark linked to transcription elongation. However, assessment of dynamic chromatin changes during the reprogramming of gene expression in response to extrinsic or developmental signals has been more difficult. Here we used the major developmental switch that Arabidopsis thaliana plants undergo upon their initial perception of light, known as photomorphogenesis, as a paradigm to assess spatial and temporal dynamics of monoubiquitinated H2B (H2Bub) and its impact on transcriptional responses. The process involves rapid and extensive transcriptional reprogramming and represents a developmental window well suited to studying cell division–independent chromatin changes. Genome-wide H2Bub distribution was determined together with transcriptome profiles at three time points during early photomorphogenesis. This revealed de novo marking of 177 genes upon the first hour of illumination, illustrating the dynamic nature of H2Bub enrichment in a genomic context. Gene upregulation was associated with H2Bub enrichment, while H2Bub levels generally remained stable during gene downregulation. We further report that H2Bub influences the modulation of gene expression, as both gene up - and downregulation were globally weaker in hub1 mutant plants that lack H2Bub. H2Bub-dependent regulation notably impacted genes with fast and transient light induction, and several circadian clock components whose mRNA levels are tightly regulated by sharp oscillations. Based on these findings, we propose that H2B monoubiquitination is part of a transcription-coupled, chromatin-based mechanism to rapidly modulate gene expression.
Introduction
To assess the contribution of chromatin state variations to development and phenotypic plasticity, evaluation of the role of histone post-translational modifications in the regulation of genome expression dynamics represents an important objective. A first step requires the establishment of a reference epigenome through the profiling of representative chromatin proteins and histone modifications in standard growth conditions [1]. This approach recently revealed simple organization principles based on 4 or 5 major chromatin states with distinct functional properties in Drosophila cells [2], in Caenorhabditis elegans embryos [3] and in the model plant species Arabidopsis thaliana [4]. One such chromatin signature associates with active genes and combines several histone modifications, notably histone H3 trimethylated on lysine 4 and/or lysine 36 (H3K4me3, H3K36me3), as well as monoubiquitinated histone H2B (H2Bub). These chromatin marks have the potential to influence transcriptional activity and, hypothetically at least, to be maintained through mitosis and/or meiosis [5], [6]. However, the assessment of dynamic chromatin changes has been more difficult because of the confounding effects of cell division and tissue specificity.
Functional analyses in S. cerevisiae showed that a transcription-coupled cyclic process involves the monoubiquitination of histone H2B by the Bre1 ubiquitin ligase and subsequent deubiquitination by SAGA, a complex that combines the two histone-modifying activities of Ubiquitin protease 8 (Ubp8) and GCN5 acetyltransferase [7], [8], [9], [10]. The SAGA evolutionarily conserved complex acts as a transcriptional coactivator that promotes gene expression at a post-initiation step in metazoans [11], [12]. Indeed, H2Bub was found to facilitate the processivity of RNA Pol II through nucleosomes by affecting DNA accessibility, to help recruit the histone chaperone FACT (FAcilitates Chromatin Transcription) and to ensure nucleosome reassembly [13], [14], [15], [16], [17]. In both yeast and mammals, the Polymerase-associated factor 1 complex (Paf1C) serves as a platform for the monoubiquitination of H2B during transcription elongation, which in turn induces the trimethylation of histone H3 on lysines 4 and 79 by COMPASS/MLL complexes in a so-called trans-histone crosstalk [18], [19]. Accordingly, Paf1C and the Set1 and Set2 methyltransferases that catalyse H3K4me3 and H3K36me3 deposition, respectively, have been found to associate with the elongating form of RNA Pol II (reviewed in [20], [21], [22]). Altogether, an emerging picture is that transcriptional coactivators can increase RNA Polymerase II activity by modulating H2Bub homeostasis and coordinating several other histone modifications, thereby contributing to the selective regulation of cellular pathways [11], [12]. Nevertheless, much remains to be understood about the dynamic changes of histone modifications and their impact on gene expression in response to developmental or environmental signals.
Chromatin-based regulatory processes play important roles during plant developmental transitions (reviewed in [23], [24], [25], [26]), and in particular in response to light signals for the establishment of photomorphogenic development [27], . When dark-grown (etiolated) seedlings emerge from the soil, the initial light perception event promotes a major developmental switch that orchestrates a massive reprogramming of gene expression through which heterotrophic seedlings become photosynthetically competent and can complete their life cycle [29], [30], [31]. This rapid and division-independent developmental window is therefore especially well suited for the study of chromatin state dynamics over a large repertoire of genes, many of which undergo pioneering rounds of transcription upon light perception.
Evidence has indeed emerged that photomorphogenesis involves chromatin modifications. Profiling of the antagonistic histone H3 modifications K9ac/me3 and K27ac/me3 during de-etiolation showed that gene upregulation associates with histone acetylation, and reciprocally, that some light-repressed genes gain H3K27me3, a mark of Polycomb Group-mediated repressive activity [32]. Additionally, functional approaches using plant mutants for the evolutionarily conserved GCN5 and HD1 factors affected in the acetylation/deacetylation of several histone H3 and H4 residues further support a model in which histone modifications may contribute to maintain genes in a repressed state in darkness and subsequently modulate their activity upon illumination [33], [34], [35].
In the current study, the early events of photomorphogenesis were used as a paradigm to investigate spatial and temporal dynamics of chromatin states. We focused on H2Bub because of its link with transcriptional activation in yeast and metazoans. In Arabidopsis, canonical histone H2B proteins are monoubiquitinated on a lysine residue at positions 143 or 145 depending on the sequence [36] by the heterodimeric HUB1/HUB2 E3 ubiquitin ligase, a homolog of the budding yeast Bre1 protein [37], [38]. The hub1 mutants represent unique tools to assess the consequence of H2Bub loss in plants. In particular, null alleles of the genes encoding the histone H2B E2/E3 ubiquitin ligase represent the only Arabidopsis mutants with near-to-normal phenotypes in which modification of just one histone residue is abrogated [38], [39], [40], [41]. By integrating the light-induced transcriptional responses in wild-type and hub1-3 mutant seedlings with the changes in genome-wide distributions of H2Bub over a 6 h period of exposure to light, we here assess how H2Bub influences the rapid regulation of gene expression.
Results
Light perception induces the rapid redistribution of H2Bub
Five-day-old Arabidopsis seedlings were grown in complete darkness or exposed to light for 1 or 6 h before being harvested for RNA and chromatin extractions (Figure 1A). This temporal window allows plants to shift from a fast response mode at 1 h to slower, more selective, responses at 6 h but is not long enough for cell division to occur [42]. RT-qPCR analyses of known light-responsive genes confirmed that these two time points could differentiate between early and late regulated genes in our conditions (Figure S1). Except for an opening of the apical hook, no morphological change was visible after 1 h of illumination (Figure 1B). After 6 h, most plants had open cotyledons and had initiated greening. In agreement with previous studies [43], the photomorphogenic switch was irreversible after 6 h of illumination but not after 1 h, as tested by transferring the plants back to darkness for an additional 24 h period (Figure 1B). In these conditions, the hub1-3 mutant did not exhibit significant morphological defects, except for a frequent lack of apical hook in darkness (45% of the mutant compared with 11% of the wild-type seedlings). Like for other hub1 null alleles, no H2Bub is detectable in hub1-3 chromatin extracts by immunoblot analysis ().

ChIP-chip analyses were carried out at the 3 time points, hereafter called Dark (D), 1 h and 6 h. In keeping with our previous findings using light-grown seedlings [4], H2Bub was located almost exclusively over expressed genes (Figure S3A and S3B). The distribution of H2Bub over genic elements is low on promoter regions and typically resembles a Gaussian curve that peaks in the central part of the transcribed region (Figure S3C and S3D). This property allowed us to assign specific criteria for defining genes marked by H2Bub based on the central 40% of a CDS overlapping H2Bub-enriched domains (see supplementary methods in Text S1). Altogether, this first analysis revealed a common set of 4023 genes marked in all three conditions (Table S1). It also allowed us to identify 256 genes defined as being marked only in darkness and 566 genes only upon light exposure, among which 396 at 1 h and 429 at 6 h (Figure 1C). The H2Bub profiles of three representative genes marked at 1 h and 6 h (TZP) or only at 6 h (RBFa and HCF107) are shown in Figure 1E.
To investigate more quantitatively the potential variations of H2Bub levels on these genes, we then examined differential enrichment using a so-called TileMap approach based on Hidden Markov Modelling (HMM; see Text S1). This approach determined genomic domains with differential H2Bub enrichment between the three conditions, which were then mapped to genes and further compared to the list of H2Bub-marked genes defined previously. The combination of these two analyses showed that 328 genes gain H2Bub de novo upon illumination, among which 177 at 1 h and 272 at 6 h (Figure 1D, Figure S4 and Table S1). In contrast, H2Bub was lost from only 4 genes at 1 h and from 54 genes at 6 h. A selection of genes in each category was then validated by ChIP-qPCR performed with anti-H2Bub and anti-H3 antibodies. This confirmed that potential variations in nucleosome occupancy did not account for differential H2Bub enrichments (Figure S5). Altogether, these data illustrate the dynamic nature of H2Bub deposition over a specific set of genes.
Gene induction is associated with H2Bub enrichment
To assess whether H2Bub variations affect light-regulated genes, the epigenomic data were integrated with transcriptome analyses. Of the ∼20,000 genes represented on CATMA microarrays [44], 695 and 1537 genes were differentially expressed at 1 and 6 h relative to the dark point, respectively, indicating that light had rapid and major effects on gene expression (Table S2). Comparison with H2Bub marking in the three conditions further showed that 49% of the light-induced genes gain the H2Bub mark, a fraction that is far above the average for all H2Bub-marked genes considered together (around 10%; Figure 2A). More globally, a scatterplot correlating changes in RNA levels with changes in H2Bub enrichment showed that light-upregulated genes tend to gain H2Bub upon illumination (r = 0.25; ). In contrast, downregulation did not appreciably correlate with H2Bub (r = 0.09) and only a minor fraction of the downregulated genes showed a loss of the H2Bub mark (Figure 2A right panel).

The link between H2Bub gain and gene induction was therefore explored more quantitatively. First, mean H2Bub levels were calculated for genes in each category of light-regulation. This revealed that upregulated genes displayed increased H2Bub levels at 1 h and at 6 h compared to dark and compared to downregulated genes (Figure 2B). The distribution of H2Bub levels over light-regulated genes was then examined by plotting enrichment levels along gene length. To avoid confounding effects, the analysis was restricted to genes that were marked under the relevant condition (marked in dark for downregulation and at 6 h for upregulation). This showed that upregulated genes progressively gain H2Bub levels along their transcribed region (Figure 2C).
In contrast to upregulation, these analyses identified no correlation between gene downregulation and H2Bub loss. First, the fraction of genes that lose the H2Bub mark within 6 h is very low (n = 55). Second, downregulated genes showed no concomitant decrease in H2Bub level (Figure 2B and 2D). Finally, we tested individually by ChIP-qPCR the genes with the best predicted H2Bub decrease and found that they exhibited only a slight reduction in H2Bub (Figure S5). We conclude from this data that gene upregulation is usually associated with local H2Bub enrichment, while H2Bub domains tend to persist during downregulation.
H2Bub deposition is dispensable for light-induced H3K4me3 and H3K36me3 enrichment
Having determined the set of genes subjected to variations in H2Bub upon illumination, we further tested whether they are also subject to other chromatin changes. We first examined in silico whether the genes that gain/lose H2Bub display similar trends for acetylation or trimethylation of histone H3 on lysine 9 and 27 using the data from Charron et al. [32]. This revealed that genes that gain H2Bub during de-etiolation frequently gain H3K9ac and/or H3K27ac and that, reciprocally, H2Bub loss associates with H3K27ac loss and with H3K27me3 gain (Table S3). These observations are in good agreement with the proposed role for H3K9ac and H3K27ac in light-induced gene expression [27], [32], [34], and suggest that some genes may lose H2Bub and H3K27ac to acquire Polycomb-associated marks for repression by light.
More specifically, H2Bub deposition is a prerequisite for a trans-histone crosstalk triggering the trimethylation of H3 at K4 and K79 in S. cerevisiae and mammals [21], [22]. We therefore monitored H3K4me3 enrichment along four light-induced genes (HCF173, TZP SPA1 and GI) that gain H2Bub upon illumination and that are marked by H3K4me3 at later stages of seedling development [4]. The HCF173, TZP and SPA1 genes display low levels of mRNA and of H2Bub before illumination. ChIP-qPCR analyses revealed that H3K4me3 was enriched on the 5′ part of the transcribed region of these three genes following 6 h of light exposure in both wild-type and hub1-3 seedlings (Figure 3). We concluded from these data that transcriptional activation can associate to H3K4me3 enrichment in the absence of H2Bub on these genes.

We also probed H3K36me3 on the same genes. This mark is globally associated with H2Bub and H3K4me3 along the Arabidopsis genome [4] and might serve an equivalent function to H3K79me3, which is not detectable in plants [25], [45]. After 6 h of illumination, no clear gain of H3K36me3 was detected on these genes. Only on the SPA1 5′ region was a slight enrichment reproducibly detected in both wt and hub1-3 plants (Figure 3E), altogether suggesting that, in this context, H3K36me3 levels display weak variations.
hub1-3 mutant plants display defective gene expression patterns in darkness
As shown above, for many light-responsive genes we observed that upregulation was associated with local H2Bub enrichment. To address the possible involvement of H2Bub in the modulation of gene expression, we conducted transcriptome analyses of wild-type and hub1-3 mutant seedlings during the early hours of de-etiolation.
We first compared wild-type and hub1-3 seedlings directly at the dark time point. This showed that 715 genes were already significantly misregulated in the mutant prior to light exposure, ∼80% of them being downregulated (Table S2). Although many indirect effects might confound this analysis, such a proportion is in general agreement with the predicted role of H2Bub in promoting transcription. Strikingly, many of these genes correspond to light-repressed genes: 42% and 23% of the genes downregulated at 1 and 6 h in the wild-type, respectively, were already down in hub1-3 before light exposure (Figure 4A). In contrast, a smaller set of 151 genes were upregulated in hub1-3 mutant seedlings, possibly through direct effects or through regulatory cascades. Their overlap with the light-induced genes was low (8% and 3% at 1 and 6 h, respectively). The hub1-3 mutation therefore partially mimics the effect of light for gene downregulation but not for upregulation, suggesting that for many genes, HUB1 contributes to attain high expression levels in darkness. Nonetheless, altered gene expression patterns in hub1-3 seedlings were not sufficient to trigger constitutive photomorphogenic development beyond a tendency towards opened apical hooks (Figure 1B).

Interestingly, comparison of the hub1-3 transcriptome in darkness with more than 4,000 other A. thaliana transcriptome patterns using Genevestigator [46] identified csn5 and other csn mutant profiles as being the most similar to hub1-3 downregulated genes (Figure S7). CSN5 (COP9-signalosome Subunit 5) is the plant homolog of human Jab1 and forms part of the highly conserved CSN complex. By regulating ubiquitin-ligase activity of Cullin4 [47], CSN5 has important roles during plant development, notably for cell cycle progression and for repression of photomorphogenesis in darkness [48], [49]. Given the lack of CSN5 misregulation in hub1-3 mutants in darkness, we can rule out a possible direct regulatory effect and propose instead that the CSN signalosome and the HUB1 pathways may interconnect to regulate common genes in plants, as was suggested in yeast [21].
The hub1-3 mutant is impaired in the rapid modulation of gene expression in response to light
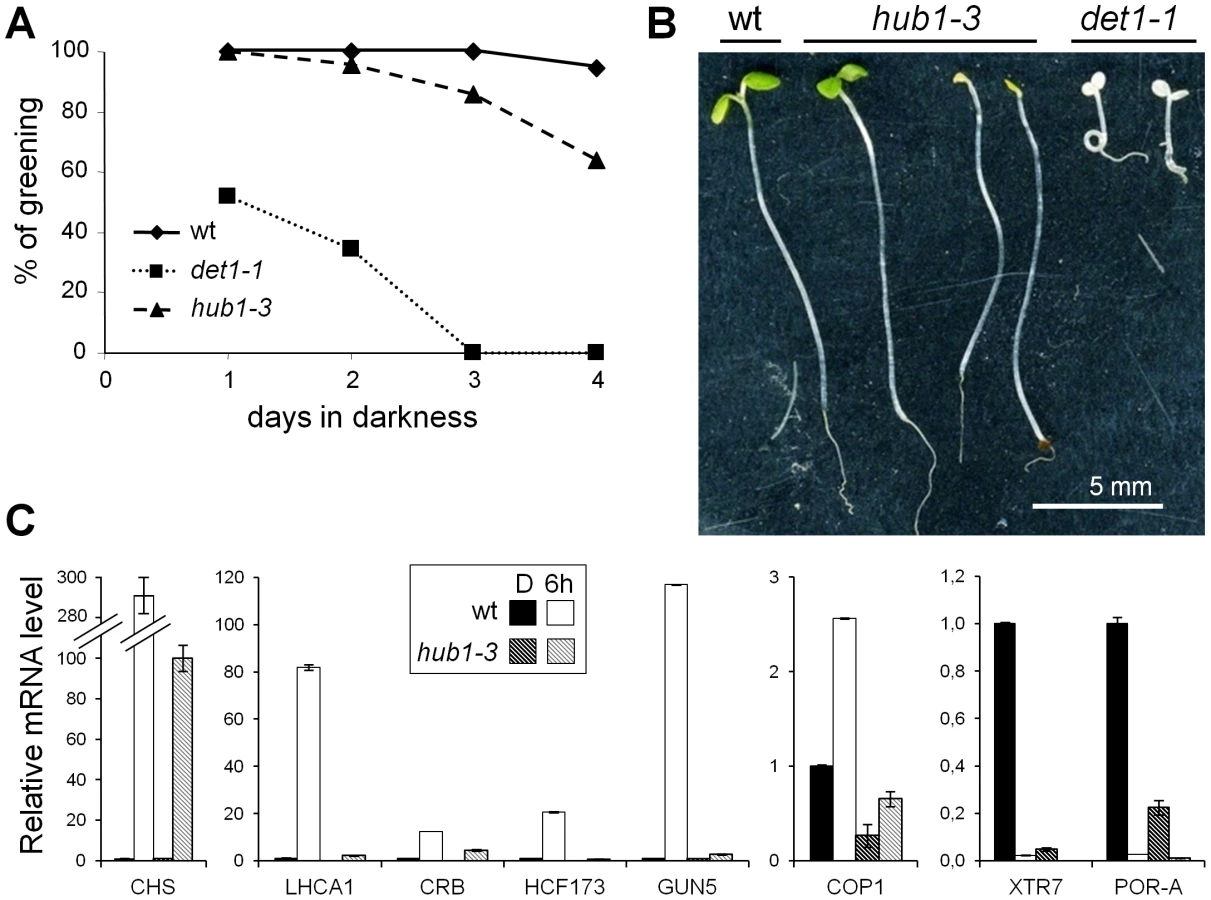
We then examined the effect of the hub1-3 mutation on gene expression kinetics during de-etiolation. Overall, the majority of light-regulated genes still responded to light in the hub1-3 mutant (Table S2). Notwithstanding, clustering of gene expression data by Self Organizing Map partitioning (SOM; [50]) identified a group of 790 genes with a tendency for upregulation that was reduced in the hub1-3 mutant (class 1; Figure 4B and Figure S8), and a group of 295 downregulated genes with weaker repression in hub1-3 (class 4). Such defects were confirmed by RT-qPCR analysis of some individual genes (Figure 4C). Light-driven expression changes of these genes were reproducibly impacted, some of them dramatically (e.g., LHCA1, CRB, GUN5).
Considering this trend, we compared directly the expression changes of the light-induced and -repressed gene sets. At 6 h, both gene sets displayed reduced expression changes in the hub1-3 mutant, with roughly half of the genes being less responsive in hub1-3 than in wild-type seedlings (Figure 5A and 5B). Because H2Bub preferentially associates with long genes [4], each set was then dissected according to gene length. This revealed that for upregulation, but not for downregulation, the longest genes were the most sensitive to the lack of HUB1.

Taken together, these data suggest that H2Bub is not required for determining on/off gene activation states but rather contributes to attain particular levels of expression. To better delineate the effect of H2Bub loss on the modulation of gene expression, we therefore focused on genes that undergo rapid changes in mRNA levels. The genes that are transiently induced at 1 h and subsequently downregulated at 6 h were selected (“Up&Down” genes; n = 162). In hub1-3 seedlings, many of these genes displayed a weak induction at 1 h followed by a weak downregulation at 6 h (Figure 5C). In several cases, reduced downregulation even resulted in higher mRNA steady state levels in hub1-3 mutants than in wild-type seedlings at 6 h. As exemplified for the AT1G07400 gene in this class, these analyses indicate that HUB1 positively influences rapid variations in gene expression (Figure 5D).
hub1-3 mutant seedlings are hypersensitive to the dark-to-light transition
Given the defective transcriptional responses to light in hub1-3 seedlings, we examined the phenotype of these plants upon prolonged illumination. This revealed that a fraction of the hub1-3 seedlings were overly light sensitive (Figure 6A). This phenomenon known as photobleaching has been observed in several photomorphogenic mutants such as det1-1 and pifs that overaccumulate chlorophyll precursors in darkness [51], [52]. Although less penetrant in hub1-3 than in det1-1 mutants, this sensitivity was significant when seedlings were grown for 3 days or more in darkness before transfer to light (Figure 6B). Many misregulated light-responsive genes in hub1-3 mutants in darkness and during photomorphogenesis might be responsible for the photobleaching. One gene possibly responsible for the light sensitivity is POR-A, an essential regulatory gene in the chlorophyll biosynthetic pathway [53] that is significantly underexpressed in hub1-3 seedlings prior to light exposure (Figure 4C).
We further analyzed the response of light-regulated genes in 2-day-old seedlings, an early developmental stage at which hub1-3 mutant seedlings do not photobleach (Figure 6A). RT-qPCR analyses revealed that expression changes of all tested genes was affected in 2-day-old hub1-3 seedlings to an extent that was similar or even more severe than in 5-day-old plants (Figure 6C), thus confirming that the hub1-3 mutation has a primary effect on gene expression.
Several master regulators of light responses are putative targets of selective H2Bub regulation
To investigate which light-regulated genes and pathways might be subject to H2Bub-mediated transcriptional regulation, we first analyzed genes known to be involved in photoperception and light signal transduction events (Table S4). Most photoreceptor genes were marked by H2Bub but none were misregulated in hub1-3 mutants. This included Phytochrome A (phyA), encoding the major photoreceptor for far-red light signaling during photomorphogenesis, which is rapidly downregulated but retains H2Bub upon illumination (Table S4). In contrast to the photoreceptors, only a few photomorphogenic regulatory factors were detected as being marked by H2Bub, and their expression was also usually not affected in the hub1-3 mutant.
We then conducted an unbiased search by selecting genes that (1) are induced by light, (2) concomitantly display an enrichment of H2Bub, and (3) whose upregulation is affected in hub1-3 plants (Table S5). These restrictive criteria identified 90 genes, many of which encode plastid-localized proteins (n = 35; Figure 7 and Table S6). Remarkably, the numerous structural components of the chloroplast photosynthetic machinery are poorly represented in this gene set (only four relevant genes; PsbP-1, GAPA, FNR1 and a putative violaxanthin de-epoxidase gene). Instead, many genes encode regulatory factors such as transcriptional/translational regulators (e.g., HCF107, HCF152, HCF164, HCF173, SVR3, FUG1), proteins involved in stress responses, or factors with central functions in integration of photoperiod and circadian rhythms (TOC1, PRR7, GIGANTEA and TZP). Altogether, this list defines a suite of genes that are particularly impacted by H2B monoubiquitination during their upregulation by light.

Discussion
This study has examined the spatial and temporal dynamics of H2Bub distribution along the Arabidopsis genome in relation to gene expression during the initial events of photomorphogenesis. We found that 177 genes gain H2Bub de novo within 1 h, highlighting the dynamic nature of H2B monoubiquitination in a natural genomic context. Because the study was conducted during a short temporal window, these dynamics occur largely in the absence of cell division. Whole plants with numerous cell identities were used, and therefore our observations do not reveal whether H2Bub can increasingly be deposited at some DNA loci or whether an increased number of cells acquire the mark on those loci during gene upregulation. Determining these aspects will require further investigations using homogeneous cell populations or single-cell analyses.
As was expected from previous studies using mainly cell-based experiments and/or reporter genes, albeit not in a developmental context, we observed that gene activation associates with H2Bub enrichment. Moreover, inactivation of HUB1 globally and locally affected the upregulation of many genes. In line with their preferential marking by H2Bub, this defect was more pronounced for long genes. These data are therefore in agreement with a role for H2Bub during transcription elongation, long genes being more particularly sensitive to the kinetics of chromatin opening for RNA Polymerase II processivity [54]. In this respect, it is noteworthy that elevated expression of the Flowering Locus C (FLC) gene requires both H2B ubiquitination through HUB1/HUB2 and deubiquitination through the action of Ubiquitin-Protease 26, suggesting that H2Bub is subjected to transcription-coupled cycling in plants, as observed in other systems [55]. The process has not been characterized in plants so far, and re-examination of light-driven gene induction capacity in mutant plants lacking H2Bub deubiquitination might help to decipher this mechanistic aspect.
We also observed that light-driven downregulation was frequently decreased in hub1-3 seedlings, and was in this case independent of gene length. The decreased kinetics of gene expression changes for both up - and downregulation notably affected genes with rapid and transient light induction. Given these findings, we propose that HUB1 and/or H2Bub can facilitate the fine-tuning of gene expression to rapidly attain appropriate levels of expression. In human, only a subset of genes were shown to be affected in cells lacking H2Bub, which seems at odds with the fact that H2Bub is present on most active genes [11], [56]. In plants too, only a few genes were found to be misregulated in Paf1c mutants [57] in which histone H2B monoubiquitination is supposed to be affected. Owing to a fine effect on gene expression dynamics, kinetic analyses rather than steady state comparisons may therefore be more appropriate for revealing genes impacted by H2Bub-associated pathways.
In contrast to gene activation, we found no relationship between gene downregulation and H2Bub levels. This suggests that H2Bub domains are not simultaneously removed when genes are downregulated. The long delay for H2Bub decrease could further indicate that loss of H2Bub is mainly replication-dependent. This contrasts with other chromatin marks associated with active transcription such as H3K27ac and H3K4me3, which have been shown to decrease rapidly on the phyA gene during Arabidopsis de-etiolation [34]. This also contrasts with previous observations in human cells in which turning off of the p21 gene was associated with a concomitant decrease of H2Bub at this locus [56]. Differential efficiency of H2Bub ubiquitin proteases in plants or weak deubiquitination over light-regulated genes might account for this difference, as could the persistence of some residual transcriptional activity on some light-repressed genes. Even so, such a lasting effect resembles the persistence of H3K4me3 on the GAL10 reporter gene long after its inactivation and after the dissociation of RNA Pol II in S. cerevisiae [58]. It was proposed that H3K4me3 domains could serve as a short-term memory of previous elevated transcriptional activity, which might be important for genes that are rapidly switched on by environmental changes [58], [59]. Given the tight relationship between H3K4me3 and H2Bub in S. cerevisiae, our observations suggest that H2Bub may play a similar role in plants. In the context of photomorphogenesis, such temporary marking might allow establishment of an initial light-adapted expression state. Future studies aimed at determining the minimum time required for losing H2Bub after termination of the light stimulus as a function of gene activity and DNA replication will be of interest, as will experiments in which seedlings are compared for their capacity to respond to successive light stimuli.
H2Bub is highly associated with H3K4me3 and H3K36me3 along the Arabidopsis genome [4], and several COMPASS-like complexes with Set-methyltransferase activity exist in plants [60], [61]. H2B monoubiquitination could therefore potentially contribute to a trans-histone crosstalk with histone H3 on active genes in plants as in other systems. Nonetheless, a requirement for H2Bub for subsequent H3K4me3 deposition has not been demonstrated mechanistically in plants. Although the genome-wide distribution of H3K4me3 in a hub1 mutant background has not been reported, the bulk of H3K4me3 is maintained in mutants lacking H2B monoubiquitination [39], [40], [55], [62] as well as in Paf1c mutants [57]. Here we observed that upregulation of HCF173, TZP and SPA1 can associate with H3K4me3 enrichment in the hub1-3 mutant background. H2Bub is therefore not a prerequisite for recruiting histone methyltransferase activities mediating H3K4 trimethylation on these two genes, and independent pathways are likely at play here. These observations are in agreement with a proposed model in which H3K4me3 occurs prior to H2B ubiquitination and deubiquitination, whereas H3K36me3 occurs afterward in plants [55]. They further suggest that the transcriptional defects linked to H2Bub loss are not globally mediated through secondary defects on these other two marks.
Much remains to be investigated about the mechanistic role of H2B monoubiquitination during transcription in plants. In vitro evidence using human cell extracts suggests that histone H2B is ubiquitinated ahead of the transcribing polymerase, which is important for the pioneering round of transcription, but that its rate limiting function may lie in the reassembly of nucleosomes [15]. Recent genome-wide analyses in S. cerevisiae further showed that H2Bub-mediated nucleosome reassembly can elicit different functional outcomes on genes depending on its positional context in promoter (repressive) versus transcribed (activating) regions [63]. Different mechanisms may operate in plants, as H2Bub is absent from promoter regions ([4], this study). This discrepancy might either reflect fast and efficient H2Bub deubiquitination at promoters, or targeting of the H2B ubiquitination machinery to the transcribed regions only, eventually mediated by Polymerase-associated factors. Paf1c is a good candidate to determine this [57]. Consequently, comparison of the distribution of HUB1, Paf1c and the elongating form of RNA Pol II along genes in wild-type and hub1 mutant plants might allow these possibilities to be distinguished.
Based on immunoblot and ChIP analyses, H2Bub is lost in hub1-3 plants. Consequently, hub1 mutants represent the best available tool to assess the impact of H2Bub deposition on gene expression in plants. Indeed, the Arabidopsis genome encodes 11 histone H2B genes [36] and therefore is not amenable to genetic strategies that allow specific abrogation of histone H2B monoubiquitination through targeted lysine mutation. Nonetheless, although we assume that most defects are due to the lack of H2Bub in these mutants, we cannot rule out that some might also result from other functions of HUB1. In particular, because H2Bub domains were stable on most light-downregulated genes, altered downregulation in hub1-3 might also be triggered through H2Bub-independent effects. Indeed, the absence of HUB1 and H2Bub might affect gene downregulation at the transcriptional level by directly/indirectly decreasing rates of transcription but also through post-transcriptional activities. For many genes, the decrease in mRNA levels during light-driven downregulation is rapid, and therefore mRNA turnover might be critical. It has long been known that transcription elongation is tightly coordinated with mRNA processing steps [64]. More precisely, Paf1c-dependent H2Bub deposition differentially affects the stability of short - and long-lived mRNAs in yeast [65]. The potential role of H2Bub and of the HUB complex on post-transcriptional events has not been investigated in plant systems, and our data therefore suggest that such analyses might be of interest to investigate mechanisms allowing the rapid modulation of gene expression.
Our analyses identified a series of 90 genes impacted by H2Bub dynamics, i.e., which are fully induced by light in a HUB1-dependent manner and which concomitantly gain H2Bub. This subset represented only ∼10% of the light-induced genes, so the determinants of this specificity remain to be investigated. In line with previous findings [11], they may correspond to genes particularly sensitive to H2Bub loss, eventually located in particular chromatin contexts or subjected to tight regulation. In the context of photomorphogenesis, we found that many encode regulatory components rather than structural elements of the photosynthetic machinery. This finding therefore suggests that several regulatory genes are particularly dependent on transcription-coupled chromatin-based regulatory processes for rapid modulation of expression during the photomorphogenic developmental switch. Weaker transcriptional responses might directly be responsible for the enhanced sensitivity to dark-to-light shifts of hub1-3 mutant seedlings. The identification of circadian clock components is also noteworthy, as rapid changes in RNA levels are critical for diurnal oscillations. Modulation of the transcripts of the central oscillator TOC1 requires diurnal cycles of histone H3 acetylation and de-acetylation [66], which suggests that much remains to be determined about the role of H2Bub and associated chromatin modifiers in circadian mRNA oscillations. More generally, it can be expected that contribution of HUB1 to the modulation of gene expression also impacts other rapid transcriptional responses to environmental cues, in agreement with the defective responses of hub1 plants during fungal infection [62]. This study therefore opens the way for future studies deciphering how specific sequences are targeted for H2Bub deposition through light signal transduction pathways and whether transcriptional activity might be memorized on these loci prior to DNA replication.
Materials and Methods
Biological material and growth conditions
Besides hub1-1 (Ler ecotype), all Arabidopsis thaliana plants were in the Col-0 background. The hub1-3 T-DNA insertion mutant (GABI_276D08) was obtained from Gabi-Kat [67], and hub1-5, hub1-4, and hub2-2 corresponding to the lines SALK_044415, SALK_122512 and SALK_071289 were obtained from NASC [68]. The hub1-1 mutant [38] has been described previously as ang4-1 [69]. For de-etiolation experiments, seedlings were grown on MS medium without sugar as described in [70]. Some samples were further exposed to white light (100 µmol.m−2.s−1) for the indicated duration and seedlings were harvested concomitantly at 4pm (8zt) under a green safe light for RNA or ChIP extractions. For photobleaching assays, seeds were grown on MS medium supplemented with 1% sucrose in the same conditions. The proportion of green/bleached seedlings was recorded on 100 plants for each genotype 72 h after transfer to continuous light.
RT–qPCR
Total RNA was isolated with the RNeasy Plant mini-kit (Qiagen). For RT-qPCR, 0.5 µg of RNAs were DNase-treated using Amplification Grade DNaseI (Invitrogen) and cDNAs were synthesized using oligo(dT) and SuperScript III reverse transcriptase (Invitrogen). Quantitative PCR was performed using the LightCycler 480 SYBR Green I Master (Roche). Primer sequences are listed in Table S7. RNA levels were normalized as in [71] and against the two housekeeping genes At4g29130 and At2g36060.
Transcriptome analyses
Wild-type and hub1-3 seedlings were grown as indicated in Figure 1A and RNA was extracted just before, 1 or 6 h after exposure to light. For each genotype, samples at 1 and 6 h were compared with their respective dark points separately. Two independent biological replicates were produced using different seed batches. The cDNA synthesis, amplification, labelling, hybridizations and scanning of the slides were performed as described in [72]. Microarray analysis was carried out on CATMA arrays containing gene-specific tags (GSTs) for 22,089 Arabidopsis thaliana genes [44], [73]. Additional descriptions and statistical analyses are given in Text S1. Data were validated by RT-qPCR using the primers listed in Table S7 with the same RNA samples and also on additional biological replicates for independent validations. Transcriptome data were deposited at GEO (http://www.ncbi.nlm.nih.gov/geo/ [74]; Accession number GSE21922) and at CATdb (http://urgv.evry.inra.fr/CATdb/ [75]; Project: AU10-03-Hub1) according to Minimum Information About a Microarray Experiment standards (MIAME).
ChIP–qPCR and ChIP–chip
Chromatin extractions, immunoprecipitations, DNA amplification, labelling and hybridizations were performed as described previously [4] using antibodies recognizing H2Bub (Medimabs MM-0029, lot 298060417), H3K4me3 (Millipore 05-745, lot NG1717145), H3K36me3 (Abcam ab9050, lot 826245) and H3 (Millipore 07-690, lot DAM1832538). For each ChIP-chip experiment, two independent biological replicates were performed using different seed batches. Each replicate was analysed in dye-swap on Roche NimbleGen tiled arrays of 50–75 nt tiles, with 110 nt spacing on average, that are tiled across the entire genome sequence (TAIR7), without repeat masking and synthesized in triplicates of 711 320 tiles each on a single array (GEO accession GPL11005) as described in [4]. Computational analyses of the data are described in Text S1. Variations of H2Bub enrichment over relevant genes were validated by quantitative PCR as described above on the DNA samples used for ChIP-chip analyses and on additional independent biological replicates using the primers listed in Table S7. ChIP-chip data were deposited at GEO under accession number GSE36515 according to MIAME.
Supporting Information
Zdroje
1. BakerM 2011 Making sense of chromatin states. Nat Methods 8 717 722
2. FilionGJvan BemmelJGBraunschweigUTalhoutWKindJ 2010 Systematic protein location mapping reveals five principal chromatin types in Drosophila cells. Cell 143 212 224
3. LiuTRechtsteinerAEgelhoferTAVielleALatorreI 2011 Broad chromosomal domains of histone modification patterns in C. elegans. Genome Res 21 227 236
4. RoudierFAhmedIBerardCSarazinAMary-HuardT 2011 Integrative epigenomic mapping defines four main chromatin states in Arabidopsis. Embo J 30 1928 1938
5. GreerELMauresTJUcarDHauswirthAGManciniE 2011 Transgenerational epigenetic inheritance of longevity in Caenorhabditis elegans. Nature 479 365 371
6. MoazedD 2011 Mechanisms for the inheritance of chromatin states. Cell 146 510 518
7. HenryKWWyceALoWSDugganLJEmreNC 2003 Transcriptional activation via sequential histone H2B ubiquitylation and deubiquitylation, mediated by SAGA-associated Ubp8. Genes Dev 17 2648 2663
8. KaoCFHillyerCTsukudaTHenryKBergerS 2004 Rad6 plays a role in transcriptional activation through ubiquitylation of histone H2B. Genes Dev 18 184 195
9. XiaoTKaoCFKroganNJSunZWGreenblattJF 2005 Histone H2B ubiquitylation is associated with elongating RNA polymerase II. Mol Cell Biol 25 637 651
10. LangGBonnetJUmlaufDKarmodiyaKKofflerJ 2011 The Tightly Controlled Deubiquitination Activity of the Human SAGA Complex Differentially Modifies Distinct Gene Regulatory Elements. Mol Cell Biol 31 3734 3744
11. ShemaETiroshIAylonYHuangJYeC 2008 The histone H2B-specific ubiquitin ligase RNF20/hBRE1 acts as a putative tumor suppressor through selective regulation of gene expression. Genes Dev 22 2664 2676
12. WeakeVMWorkmanJL 2011 SAGA function in tissue-specific gene expression. Trends Cell Biol
13. FierzBChatterjeeCMcGintyRKBar-DaganMRaleighDP 2011 Histone H2B ubiquitylation disrupts local and higher-order chromatin compaction. Nat Chem Biol 7 113 119
14. BelotserkovskayaROhSBondarenkoVAOrphanidesGStuditskyVM 2003 FACT facilitates transcription-dependent nucleosome alteration. Science 301 1090 1093
15. PavriRZhuBLiGTrojerPMandalS 2006 Histone H2B monoubiquitination functions cooperatively with FACT to regulate elongation by RNA polymerase II. Cell 125 703 717
16. XinHTakahataSBlanksmaMMcCulloughLStillmanDJ 2009 yFACT induces global accessibility of nucleosomal DNA without H2A-H2B displacement. Mol Cell 35 365 376
17. FlemingABKaoCFHillyerCPikaartMOsleyMA 2008 H2B ubiquitylation plays a role in nucleosome dynamics during transcription elongation. Mol Cell 31 57 66
18. SunZWAllisCD 2002 Ubiquitination of histone H2B regulates H3 methylation and gene silencing in yeast. Nature 418 104 108
19. BriggsSDXiaoTSunZWCaldwellJAShabanowitzJ 2002 Gene silencing: trans-histone regulatory pathway in chromatin. Nature 418 498
20. SmithEShilatifardA 2010 The chromatin signaling pathway: diverse mechanisms of recruitment of histone-modifying enzymes and varied biological outcomes. Mol Cell 40 689 701
21. WeakeVMWorkmanJL 2008 Histone ubiquitination: triggering gene activity. Mol Cell 29 653 663
22. LeeJSSmithEShilatifardA 2010 The language of histone crosstalk. Cell 142 682 685
23. GrasserKD 2005 Emerging role for transcript elongation in plant development. Trends Plant Sci 10 484 490
24. CrevillenPDeanC 2010 Regulation of the floral repressor gene FLC: the complexity of transcription in a chromatin context. Curr Opin Plant Biol 14 38 44
25. BerrAShafiqSShenWH 2011 Histone modifications in transcriptional activation during plant development. Biochim Biophys Acta 1809 567 576
26. FengSJacobsenSEReikW 2011 Epigenetic reprogramming in plant and animal development. Science 330 622 627
27. HeGEllingAADengXW 2011 The epigenome and plant development. Annu Rev Plant Biol 62 411 435
28. FisherAJFranklinKA 2011 Chromatin remodelling in plant light signalling. Physiol Plant 142 305 313
29. ChenMChoryJ 2011 Phytochrome signaling mechanisms and the control of plant development. Trends Cell Biol
30. JiaoYLauOSDengXW 2007 Light-regulated transcriptional networks in higher plants. Nat Rev Genet 8 217 230
31. KamiCLorrainSHornitschekPFankhauserC 2010 Light-regulated plant growth and development. Curr Top Dev Biol 91 29 66
32. CharronJBHeHEllingAADengXW 2009 Dynamic landscapes of four histone modifications during deetiolation in Arabidopsis. Plant Cell 21 3732 3748
33. BenhamedMBertrandCServetCZhouDX 2006 Arabidopsis GCN5, HD1, and TAF1/HAF2 interact to regulate histone acetylation required for light-responsive gene expression. Plant Cell 18 2893 2903
34. JangICChungPJHemmesHJungCChuaNH 2011 Rapid and reversible light-mediated chromatin modifications of Arabidopsis phytochrome A locus. Plant Cell 23 459 470
35. ChuaYLBrownAPGrayJC 2001 Targeted histone acetylation and altered nuclease accessibility over short regions of the pea plastocyanin gene. Plant Cell 13 599 612
36. BergmullerEGehrigPMGruissemW 2007 Characterization of post-translational modifications of histone H2B-variants isolated from Arabidopsis thaliana. J Proteome Res 6 3655 3668
37. LiuYKoornneefMSoppeWJ 2007 The absence of histone H2B monoubiquitination in the Arabidopsis hub1 (rdo4) mutant reveals a role for chromatin remodeling in seed dormancy. Plant Cell 19 433 444
38. FleuryDHimanenKCnopsGNelissenHBoccardiTM 2007 The Arabidopsis thaliana homolog of yeast BRE1 has a function in cell cycle regulation during early leaf and root growth. Plant Cell 19 417 432
39. CaoYDaiYCuiSMaL 2008 Histone H2B monoubiquitination in the chromatin of FLOWERING LOCUS C regulates flowering time in Arabidopsis. Plant Cell 20 2586 2602
40. GuXJiangDWangYBachmairAHeY 2009 Repression of the floral transition via histone H2B monoubiquitination. Plant J 57 522 533
41. XuLMenardRBerrAFuchsJCognatV 2009 The E2 ubiquitin-conjugating enzymes, AtUBC1 and AtUBC2, play redundant roles and are involved in activation of FLC expression and repression of flowering in Arabidopsis thaliana. Plant J 57 279 288
42. PeschkeFKretschT 2011 Genome-wide analysis of light-dependent transcript accumulation patterns during early stages of Arabidopsis seedling deetiolation. Plant Physiol 155 1353 1366
43. SchroederDFGahrtzMMaxwellBBCookRKKanJM 2002 De-etiolated 1 and damaged DNA binding protein 1 interact to regulate Arabidopsis photomorphogenesis. Curr Biol 12 1462 1472
44. CroweMLSerizetCThareauVAubourgSRouzeP 2003 CATMA: a complete Arabidopsis GST database. Nucleic Acids Res 31 156 158
45. ZhangXBernatavichuteYVCokusSPellegriniMJacobsenSE 2009 Genome-wide analysis of mono-, di - and trimethylation of histone H3 lysine 4 in Arabidopsis thaliana. Genome Biol 10 R62
46. HruzTLauleOSzaboGWessendorpFBleulerS 2008 Genevestigator v3: a reference expression database for the meta-analysis of transcriptomes. Adv Bioinformatics 2008 420747
47. WeiNSerinoGDengXW 2008 The COP9 signalosome: more than a protease. Trends Biochem Sci 33 592 600
48. ChenHShenYTangXYuLWangJ 2006 Arabidopsis CULLIN4 Forms an E3 Ubiquitin Ligase with RBX1 and the CDD Complex in Mediating Light Control of Development. Plant Cell 18 1991 2004
49. DohmannEMLevesqueMPDe VeylderLReichardtIJurgensG 2008 The Arabidopsis COP9 signalosome is essential for G2 phase progression and genomic stability. Development 135 2013 2022
50. TamayoPSlonimDMesirovJZhuQKitareewanS 1999 Interpreting patterns of gene expression with self-organizing maps: methods and application to hematopoietic differentiation. Proc Natl Acad Sci U S A 96 2907 2912
51. ChoryJPetoCFeinbaumRPrattLAusubelF 1989 Arabidopsis thaliana mutant that develops as a light-grown plant in the absence of light. Cell 58 991 999
52. LeivarPQuailPH 2010 PIFs: pivotal components in a cellular signaling hub. Trends Plant Sci 16 19 28
53. ArmstrongGARungeSFrickGSperlingUApelK 1995 Identification of NADPH:protochlorophyllide oxidoreductases A and B: a branched pathway for light-dependent chlorophyll biosynthesis in Arabidopsis thaliana. Plant Physiol 108 1505 1517
54. ShilatifardAConawayRCConawayJW 2003 The RNA polymerase II elongation complex. Annu Rev Biochem 72 693 715
55. SchmitzRJTamadaYDoyleMRZhangXAmasinoRM 2009 Histone H2B deubiquitination is required for transcriptional activation of FLOWERING LOCUS C and for proper control of flowering in Arabidopsis. Plant Physiol 149 1196 1204
56. MinskyNShemaEFieldYSchusterMSegalE 2008 Monoubiquitinated H2B is associated with the transcribed region of highly expressed genes in human cells. Nat Cell Biol 10 483 488
57. OhSParkSvan NockerS 2008 Genic and global functions for Paf1C in chromatin modification and gene expression in Arabidopsis. PLoS Genet 4 e1000077 doi:10.1371/journal.pgen.1000077
58. NgHHRobertFYoungRAStruhlK 2003 Targeted recruitment of Set1 histone methylase by elongating Pol II provides a localized mark and memory of recent transcriptional activity. Mol Cell 11 709 719
59. ShilatifardA 2006 Chromatin modifications by methylation and ubiquitination: implications in the regulation of gene expression. Annu Rev Biochem 75 243 269
60. JiangDGuXHeY 2009 Establishment of the winter-annual growth habit via FRIGIDA-mediated histone methylation at FLOWERING LOCUS C in Arabidopsis. Plant Cell 21 1733 1746
61. JiangDKongNCGuXLiZHeY 2011 Arabidopsis COMPASS-like complexes mediate histone H3 lysine-4 trimethylation to control floral transition and plant development. PLoS Genet 7 e1001330 doi:10.1371/journal.pgen.1001330
62. DhawanRLuoHFoersterAMAbuqamarSDuHN 2009 HISTONE MONOUBIQUITINATION1 interacts with a subunit of the mediator complex and regulates defense against necrotrophic fungal pathogens in Arabidopsis. Plant Cell 21 1000 1019
63. BattaKZhangZYenKGoffmanDBPughBF 2011 Genome-wide function of H2B ubiquitylation in promoter and genic regions. Genes Dev 25 2254 2265
64. ProudfootNJFurgerADyeMJ 2002 Integrating mRNA processing with transcription. Cell 108 501 512
65. PenheiterKLWashburnTMPorterSEHoffmanMGJaehningJA 2005 A posttranscriptional role for the yeast Paf1-RNA polymerase II complex is revealed by identification of primary targets. Mol Cell 20 213 223
66. PeralesMMasP 2007 A functional link between rhythmic changes in chromatin structure and the Arabidopsis biological clock. Plant Cell 19 2111 2123
67. LiYRossoMGViehoeverPWeisshaarB 2007 GABI-Kat SimpleSearch: an Arabidopsis thaliana T-DNA mutant database with detailed information for confirmed insertions. Nucleic Acids Res 35 D874 878
68. AlonsoJMStepanovaANLeisseTJKimCJChenH 2003 Genome-wide insertional mutagenesis of Arabidopsis thaliana. Science 301 653 657
69. BernaGRoblesPMicolJL 1999 A mutational analysis of leaf morphogenesis in Arabidopsis thaliana. Genetics 152 729 742
70. FankhauserCCasalJJ 2004 Phenotypic characterization of a photomorphogenic mutant. Plant J 39 747 760
71. CastellsEMolinierJBenvenutoGBourbousseCZabulonG 2011 The conserved factor DE-ETIOLATED 1 cooperates with CUL4-DDB1DDB2 to maintain genome integrity upon UV stress. Embo J 30 1162 1172
72. LurinCAndrésCAubourgSBellaouiMBittonS 2004 Genome-wide analysis of Arabidopsis Pentratricopeptide repeat proteins reveals their essential role in organelle biogenesis. Plant Cell 16 2089 2103
73. HilsonPSmallIKuiperMT 2003 European consortia building integrated resources for Arabidopsis functional genomics. Curr Opin Plant Biol 6 426 429
74. BarrettTTroupDBWilhiteSELedouxPRudnevD 2007 NCBI GEO: mining tens of millions of expression profiles–database and tools update. Nucleic Acids Res 35 D760 765
75. GagnotSTambyJPMartin-MagnietteMLBittonFTaconnatL 2008 CATdb: a public access to Arabidopsis transcriptome data from the URGV-CATMA platform. Nucleic Acids Res 36 D986 990
Štítky
Genetika Reprodukční medicínaČlánek vyšel v časopise
PLOS Genetics
2012 Číslo 7
Nejčtenější v tomto čísle
- Guidelines for Genome-Wide Association Studies
- The Role of Rice HEI10 in the Formation of Meiotic Crossovers
- Identification of Chromatin-Associated Regulators of MSL Complex Targeting in Dosage Compensation
- GWAS Identifies Novel Susceptibility Loci on 6p21.32 and 21q21.3 for Hepatocellular Carcinoma in Chronic Hepatitis B Virus Carriers