
Rapid Turnover of Long Noncoding RNAs and the Evolution of Gene Expression
A large proportion of functional sequence within mammalian genomes falls outside protein-coding exons and can be transcribed into long RNAs. However, the roles in mammalian biology of long noncoding RNA (lncRNA) are not well understood. Few lncRNAs have experimentally determined roles, with some of these being lineage-specific. Determining the extent by which transcription of lncRNA loci is retained or lost across multiple evolutionary lineages is essential if we are to understand their contribution to mammalian biology and to lineage-specific traits. Here, we experimentally investigated the conservation of lncRNA expression among closely related rodent species, allowing the evolution of DNA sequence to be uncoupled from evolution of transcript expression. We generated total RNA (RNAseq) and H3K4me3-bound (ChIPseq) DNA data, and combined both to construct catalogues of transcripts expressed in the adult liver of Mus musculus domesticus (C57BL/6J), Mus musculus castaneus, and Rattus norvegicus. We estimated the rate of transcriptional turnover of lncRNAs and investigated the effects of their lineage-specific birth or death. LncRNA transcription showed considerably greater gain and loss during rodent evolution, compared with protein-coding genes. Nucleotide substitution rates were found to mirror the in vivo transcriptional conservation of intergenic lncRNAs between rodents: only the sequences of noncoding loci with conserved transcription were constrained. Finally, we found that lineage-specific intergenic lncRNAs appear to be associated with modestly elevated expression of genomically neighbouring protein-coding genes. Our findings show that nearly half of intergenic lncRNA loci have been gained or lost since the last common ancestor of mouse and rat, and they predict that such rapid transcriptional turnover contributes to the evolution of tissue - and lineage-specific gene expression.
Published in the journal:
. PLoS Genet 8(7): e32767. doi:10.1371/journal.pgen.1002841
Category:
Research Article
doi:
https://doi.org/10.1371/journal.pgen.1002841
Summary
A large proportion of functional sequence within mammalian genomes falls outside protein-coding exons and can be transcribed into long RNAs. However, the roles in mammalian biology of long noncoding RNA (lncRNA) are not well understood. Few lncRNAs have experimentally determined roles, with some of these being lineage-specific. Determining the extent by which transcription of lncRNA loci is retained or lost across multiple evolutionary lineages is essential if we are to understand their contribution to mammalian biology and to lineage-specific traits. Here, we experimentally investigated the conservation of lncRNA expression among closely related rodent species, allowing the evolution of DNA sequence to be uncoupled from evolution of transcript expression. We generated total RNA (RNAseq) and H3K4me3-bound (ChIPseq) DNA data, and combined both to construct catalogues of transcripts expressed in the adult liver of Mus musculus domesticus (C57BL/6J), Mus musculus castaneus, and Rattus norvegicus. We estimated the rate of transcriptional turnover of lncRNAs and investigated the effects of their lineage-specific birth or death. LncRNA transcription showed considerably greater gain and loss during rodent evolution, compared with protein-coding genes. Nucleotide substitution rates were found to mirror the in vivo transcriptional conservation of intergenic lncRNAs between rodents: only the sequences of noncoding loci with conserved transcription were constrained. Finally, we found that lineage-specific intergenic lncRNAs appear to be associated with modestly elevated expression of genomically neighbouring protein-coding genes. Our findings show that nearly half of intergenic lncRNA loci have been gained or lost since the last common ancestor of mouse and rat, and they predict that such rapid transcriptional turnover contributes to the evolution of tissue - and lineage-specific gene expression.
Introduction
The mammalian transcriptome has recently been shown to be surprisingly diverse in its extent and encoded functions [1]–[3], much of which are noncoding RNAs (ncRNAs) as they are not translated into proteins. The ability to sequence the entire transcriptome in an unbiased manner has not only allowed more complete characterization of well described and highly abundant noncoding RNAs with known function, such as transfer RNAs, small nuclear RNAs, small nucleolar RNAs and ribosomal RNAs, but have also revealed additional ncRNA species. For example, a number of long ncRNAs (lncRNAs) larger than 200 nucleotides (nt) have been discovered [2], [4], [5]. Many lncRNA loci are intergenic, when transcription occurs wholly within the genomic intervals between two adjacent protein-coding genes [6]. Some lncRNAs can be transcribed divergently from a neighbouring protein-coding transcript using identical or almost identical transcriptional initiation complexes [6]. In addition, lncRNAs overlapping with protein-coding genes can be transcribed from either strand [6]–[8].
Although the precise roles of many lncRNAs remain unknown, in general they are thought to act in transcriptional regulation [6], [9], [10]. LncRNAs can regulate gene expression programs through a variety of mechanisms, including interactions with chromatin remodelling complexes or transcription factors [11]. Consistent with a cis-regulatory role, co-expression of intergenic lncRNA loci with their neighbouring protein-coding genes has been observed [12], [13] and a number of intergenic lncRNAs have demonstrated roles in regulating the expression of genes in their genomic vicinity [9]. Some intergenic lncRNAs appear to regulate the expression of both neighbouring and distal genes [14], [15]. Indeed, many intergenic lncRNAs have been experimentally demonstrated to have roles in regulating transcription of distally located targets, in trans [16]. Nevertheless, the exact proportion and the distinguishing features of cis - and trans-acting intergenic lncRNAs remain unknown.
If lncRNAs' functional roles are conserved it is expected that their loci should be evolutionarily preserved. Indeed, the transcripts and promoters of mammalian intergenic lncRNAs exhibit signatures of selective constraint: their promoters are highly conserved across vertebrates [2] and they have accumulated fewer substitutions than neighbouring putative neutral sequence [17], [18]. However little is yet known of the evolutionary persistence of lncRNA transcription. Generally the loss and gain of functional noncoding sequence can occur rapidly, with approximately half of all functional ancestral nucleotides predicted to have been gained or lost in mouse or rat since their common ancestor [19]. Other noncoding RNAs, in particular tRNAs, have been shown to exhibit rapid turnover of their transcribed loci, despite conservation of their function [20]. Turnover of regulatory elements underlies species-specific transcriptional evolution and may be associated with phenotypic changes [21].
Only a small minority of intergenic lncRNAs in mouse or human were found to have transcribed orthologous sequences in the other species [22], [23]. This might reflect turnover of transcribed loci, or it might imply that intergenic lncRNAs, which are often lowly expressed and tissue specific [6], [9], [18], [23], have transcribed orthologous sequences that remain undetected. Indeed, analysis of the transcription of three intergenic lncRNA loci across homologous regions of the mammalian and avian brain revealed that some intergenic lncRNAs can have conserved expression patterns [24].
To resolve the extent of lncRNA transcriptional turnover it is important to undertake a careful comparison of lncRNA transcription in homogeneous and homologous tissues. Achieving this in closely related species also allows the distinction of transcriptional turnover from DNA sequence turnover and furthermore might reveal otherwise unexpected mechanisms of regulatory divergence. Here we experimentally and computationally explored the genetic structure and function of lncRNA loci in matched tissues from three closely related rodent species, Mus musculus domesticus (C57BL/6J), Mus musculus castaneus and Rattus norvegicus.
Results
Combining RNAseq and chromatin status to identify long noncoding RNAs in mouse liver
We identified transcripts expressed in the liver of three young adult male Mus musculus domesticus (inbred strain C57BL/6J termed hereafter Mmus) individuals by directional, stranded ribosomal RNA (rRNA)-depleted transcriptome sequencing (total RNAseq) (Figure 1A) (see Materials and Methods). Data from three independent biological replicates were pooled. About 80% of sequencing reads were mapped [25] to the reference Mmus (mm9) genome and liver gene expression was detectable for 61% of all UTRs and coding exons annotated in the mouse genome (coverage: 66%). We found that a substantial fraction of sequencing reads map to unannotated, likely noncoding, loci consistent with previous results [26].

Using our total transcriptome sequencing data we assembled de novo 56917 transcripts [27] expressed in the Mmus liver (Figure 1A). As a consequence of the short-read single end nature of our data, our transcripts can be fragmented due to incomplete coverage of the full-length cDNA. To identify independent transcripts, we performed genome-wide chromatin immunoprecipitation followed by sequencing (ChIPseq) against trimethylation of lysine 4 of histone H3 (H3K4me3), which marks the beginning of actively transcribed genes [28] and identified enriched regions [29] (Figure 1A) (see Materials and Methods).
We intersected the genomic locations of 18303 H3K4me3 enriched regions with the predicted 5′ end of our RNAseq-defined Mmus transcripts longer than 200 bases in length, thereby predicting 8915 distinct transcription start sites (TSSs) (Figure 1A). As found in previous studies, we identified a limited number of protein-coding genes that exhibited evidence of bidirectional transcription at their TSS (Figure S1, Table S10) [30]. Most of these transcribed regions are likely noncoding and are not further addressed in our study except when supported by a de novo assembled noncoding transcript [31].
Similarly, we identified transcripts that were either intergenic (n = 388) or intragenic (n = 8527) based on their overlap with Mmus protein-coding gene annotations (Figure 1A) (see Materials and Methods). Intergenic transcripts lacking protein-coding potential [32] were annotated as long intergenic ncRNAs (intergenic lncRNAs) (n = 316, Table S3). Next we defined transcribed loci as clusters of one or more transcripts with overlapping exonic or intronic nucleotides. From 293 of these loci only intergenic lncRNA transcripts were expressed (Table S3 and S4). The vast majority (n = 233) of these intergenic lncRNA loci have no overlap with intergenic lncRNAs annotated in the mouse genome by Ensembl (build 64), demonstrating that current mouse intergenic lncRNA catalogues are largely incomplete [18]. Mmus liver intergenic lncRNAs transcripts were significantly (two-tailed Mann-Whitney test, typically p<1×10⁻⁴) found to be: (i) more lowly expressed, (ii) shorter and (iii) to have fewer exons than their protein-coding transcript counterparts (Table S2) consistent with previous reports [23], [33].
The second group of 7289 intragenic loci comprises 8527 transcripts overlapping protein-coding genes (Ensembl build 60, Table S3 and S4). Forty-nine loci have overlapping antisense RNAs transcribed from the opposite strand and marked by separate H3K4me3 enriched regions indicating independent transcriptional initiation (Table S9). Examples in this category include the constitutively expressed noncoding RNA Kcnq1ot1 [34].
lncRNAs show spatio-temporal expression patterns in mouse
Most protein-coding genes are expressed in multiple tissues [35]. In contrast, lncRNA expression tends to be spatially and temporally restricted [6], [18], [23], [36]. We validated the expression of 15 randomly selected liver expressed intergenic lncRNA transcripts by quantitative PCR (RT-qPCR) in seven Mmus adult tissues (Figure 1B) and nine intragenic antisense lncRNA transcripts by strand specific RT-qPCR [8] in four adult tissues (Figure S2D). These tissues were chosen because they show different degrees of cell type complexity and biological functionality. We found that the large majority of the tested intergenic and intragenic antisense lncRNA transcripts are predominately expressed in liver.
Large changes in gene expression are observed during tissue development [37]. In order to identify whether the intergenic lncRNAs we identified are developmentally regulated during hepatocyte differentiation, we measured the abundance of representative lncRNAs by RT-qPCR at embryonic stages E10, E12, E14 and E18 and adult stage P62. Our data showed that lncRNAs are also extremely specific to the adult developmental stage of liver. In summary, the intergenic lncRNAs we identify are specifically expressed in nutritionally unstressed adult liver (Figure 1C).
Collection of matched long noncoding RNAs in castaneus and rat
Sequence comparison of mouse intergenic lncRNAs and their human and rat orthologous sequence have shown that these transcripts tend to be constrained, an evolutionary hallmark of functionality, albeit at much lower levels than protein-coding genes [17], [18]. However little is yet known about transcriptional turnover of lncRNA during evolution. To address the transcriptional turnover of lncRNAs, we explored their transcription across three rodents. In addition to Mmus, we studied transcript expression in the adult liver of a closely related mouse Mus musculus castaneus (CAST/EiJ termed Mcas) and in the rat (Rattus norvegicus, termed Rnor) (Figure 2). The two mouse subspecies, Mmus and Mcas, diverged about one million years ago (MYA) and last shared a common ancestor with Rnor about 13 to 19 MYA [38] (Figure 2A). These differences in species separation across evolutionary time allowed us to take two snapshots of transcriptional turnover during rodent evolution, using the closest wild-derived mouse species (Mcas) to Mmus that is commercially available and Rnor as the evolutionary nearest rodent species with a well-annotated genome. Similar to the characterization of transcripts in Mmus liver, we performed RNAseq and H3K4me3 ChIPseq experiments in Mcas and Rnor, and identified 158 and 605 intergenic lncRNAs respectively (Tables S1, S5, S6, S7, S8). The observed difference between the numbers of annotated intergenic lncRNA loci across the three rodents (293, 158 and 605 for Mmus, Mcas and Rnor, respectively) can be either due to experimental bias or underlying biology. To test the contribution of the difference in read number of each species RNAseq library (Table S1), we reassembled transcripts in Mmus and Rnor after randomly selecting from Mmus and Rnor libraries the same number of reads as Mcas, our smallest library (Table S1). For each species we repeated this procedure 10 times. By comparing the numbers of intergenic lncRNAs in Mmus or Rnor that overlapped a transcript from these recreated libraries, we found that the differences in numbers of lncRNAs between mice (Mmus and Mcas) species are mostly due to the depth of sequencing. After adjusting the read number of the Mmus RNAseq library to the Mcas RNAseq library, we identified a mean of 154 intergenic lncRNA loci (standard deviation = 3.4) for Mmus, a similar number to the one assembled in Mcas (n = 158), suggesting that the difference in the number of lncRNA loci is due to an experimental bias. In contrast, in Rnor, using the same number of sequencing reads the reduction approach afforded a mean of 284 intergenic lncRNA loci (standard deviation = 5.9). This number corresponds to a 80% rise over the 158 Mcas intergenic lncRNA loci and indicates that there is an increase of liver lncRNA loci in the rat lineage.

Rapid turnover of lncRNA transcription
We next considered if during rodent evolution lncRNA loci were conserved in their transcription in a similar manner to protein-coding genes. We defined transcriptional turnover as instances of genomic loci for which syntenic sequence is conserved between two or more species yet transcription of this conserved sequence is not. To determine conservation of transcribed loci, we combined H3K4me3 peaks with RNA sequencing reads overlapping (by more than 1 bp) the syntenic regions to create a stringent set of conserved loci (see Materials and Methods). These loci show evidence of both transcriptional initiation and transcript formation. Owing to the availability of its larger number of publicly available genome wide resources, such as spatial and temporal expression patterns [39], we anchored our analysis on Mmus. To allow differentiation between sequence and transcriptional turnover we only considered Mmus loci that have aligned orthologous sequence in the rat genome [intergenic lncRNA loci n = 268 (91.5%), protein-coding loci n = 6723 (92.2%)].
We then classified mouse loci according to their transcriptional conservation into three classes: those specific to Mmus, if evidence of expression was found only in Mmus; those conserved in Mus genus, when evidence of transcription was found in Mmus and Mcas but not in Rnor; and, those conserved across these rodents, when expression evidence was found in Mmus, Mcas and Rnor (Figure 2A, Table S4). Our definition does not explicitly take into account conservation of exon-intron structure. Globally, H3K4me3 and RNAseq signals were grouped according to our classification (Figure 2B–2C).
In order to confirm that the observed differences were not solely a consequence of biases introduced by sequencing depth, we validated our interspecies comparisons by semi-quantitative RT-PCR in independent biological replicates from adult livers of Mmus, Mcas and Rnor for 24 intergenic lncRNA transcripts from four categories (rodent conserved, Mus genus conserved, Mmus-specific, and Rnor-specific, Figure S3). These RT-PCR results confirmed that our global approach accurately identifies species - and lineage-specific intergenic lncRNAs.
Turnover of transcription is considerably more frequent for intergenic lncRNA loci than for protein-coding genes in the rodent liver (Figure 2D). A significantly smaller fraction of intergenic lncRNA than protein-coding loci exhibit conserved transcription across rodents [intergenic lncRNA loci n = 160 (59.7%), protein-coding loci n = 6169 (91.7%), two-tailed Fisher's exact test, p<10−3]. Conversely, a significantly higher proportion of intergenic lncRNA than protein-coding loci are specific to the Mmus lineage [intergenic lncRNA loci n = 30 (11.2%), protein-coding loci n = 75 (1.1%), two-tailed Fisher's exact test, p<10−3].
The difference in sequencing depth between the three species influenced the number of annotated intergenic lncRNAs. To account for this effect and provide a more conservative estimate of transcriptional conservation we considered the set of intragenic and lncRNA loci that were assembled after adjusting the Mmus and Rnor RNAseq library sizes to that of Mcas (see Materials and Methods). Intragenic and intergenic lncRNA loci were annotated as previously. We considered a Mmus locus to have conserved expression if it had an overlapping H3K4me3 peak and an overlapping transcript (>1 bp). As previously, we found protein-coding gene loci to be more often conserved in rodents (1326/2415, 55%) than intergenic lncRNA loci (31/110, 28%, two-tailed Fisher's exact test, p<10−3).
Next we aimed to gain initial insights into the conservation of exon-intron structures of Mmus intergenic lncRNAs. For mouse intergenic lncRNAs and protein-coding loci whose transcription was conserved in rat (160 and 6169 loci, respectively) we compared the coverage by RNAseq reads of mouse exonic nucleotides in the rat orthologous regions. We found that rodent conserved protein-coding transcripts have a significantly higher coverage (median 78%) than intergenic lncRNA (median 47%, two-tailed Mann-Whitney test, p<2×10⁻¹⁶, Figure S4). This observation can be a consequence of lower coverage of low abundance transcripts and/or lower conservation of exon-intron structure for intergenic lncRNAs.
Similarly, we observed that the transcriptional conservation of noncoding transcripts that overlap protein-coding genes in antisense orientation also showed a rapid decay across rodent evolution. Only 36% of the Mus conserved intragenic antisense transcripts are expressed in Rnor (Figure S2). These results indicate that the large majority of ncRNAs are conserved in the Mus genus but not in the evolutionarily further distant species Rnor. The apparent low conservation of intragenic antisense transcription is consistent with previous conservation analysis [33].
To investigate transcriptional turnover of intergenic lncRNAs beyond the rodent lineage, we used publicly available polyA+ transcriptome sequencing data for the adult human liver (Human BodyMap 2.0 RNAseq data). Rodents and human shared a common ancestor over 90 MYA [40]. We considered in this analysis only Mmus transcripts whose expression was supported by at least one overlapping polyA+ sequencing read [41]. We found that the majority of mouse intergenic lncRNA loci overlap polyA+ reads (273/293 loci), suggesting that few intergenic lncRNA loci assembled here transcribe only non-polyadenylated transcripts. We discarded 1368 (18.8%) protein-coding and 159 (58.2%) intergenic lncRNA loci in Mmus that lack an apparent orthologous sequence in the human or rat genome [42]. As observed for the rodent lineage, a significantly smaller fraction of Mmus intergenic lncRNA than protein-coding genes orthologous in humans are expressed in the liver [intergenic lncRNA loci (n = 76, 56.7%), protein-coding loci (n = 5689, 96.1%), two-tailed Fisher's exact test, p<10−3) (Figure S5). Our data indicate that the fraction of liver transcribed mouse intergenic lncRNAs expressed in the orthologous region of the human genome is two-fold higher (two-tailed Fisher's exact test, p<10−3) than prior estimates [22], which supports the use of homologous tissue types to investigate levels of transcriptional conservation of tissue specific transcripts, such as intergenic lncRNAs. We conclude that rapid turnover of intergenic lncRNAs is not restricted to the rodent lineage, but is widespread among eutherian mammals.
Sequence constraint is associated with conservation of intergenic lncRNA transcription
Next we examined how sequence constraint reflects transcriptional conservation of intergenic lncRNA and protein-coding loci. For each transcript we considered its most 5′ nucleotide to correspond to the transcriptional start site and defined its promoter as the 400 nucleotides upstream of this site. We compared the mouse-rat nucleotide substitution rate for intergenic lncRNA loci (dloci) and promoters (dpromoter), to rates for genomically neighbouring and non-overlapping ancestral repeats [ARs (dAR)] with matched G+C content [18], [43]. ARs are transposable element-derived sequences that were present in the last common ancestor of human and mouse; most of these sequences have been observed to evolve neutrally and hence provide reliable proxies for local neutral mutation rates [44]. We first confirmed that Mmus liver-expressed intergenic lncRNA loci accumulated mutations at a significantly slower rate than adjacent neutral sequence (Figure S6A) (dloci = 0.148, dAR = 0.164, two-tailed Mann-Whitney test, p<3×10⁻⁷). In line with this observation, long sequence segments that have preferentially purged insertions or deletions in Mmus and Rnor lineages were 1.6-fold enriched in intergenic lncRNA transcription over expected levels (permutation test, p<10−3) [44]. As previously reported [12], [18] the sequences of intergenic lncRNA loci evolve more rapidly than those of full-length protein-coding loci (Figure S6B) (dloci/dAR = 0.902; protein-coding dloci/dAR = 0.857; two-tailed Mann-Whitney test, p<2×10⁻³). Additionally, the putative core promoters of intergenic lncRNAs accumulated significantly more substitutions than those of protein-coding genes (Figure S6C) (intergenic lncRNA dpromoter/dAR = 0.843; protein-coding dpromoter/dAR = 0.746, two-tailed Mann-Whitney test, p<2×10⁻⁵). The discrepancy between this result and published findings [2] is likely due to the incompleteness of lncRNA transcripts' 5′ ends and thus to incomplete delineation of lncRNA promoter sequences.
To determine whether loss of transcription is associated with loss of sequence constraint, we compared Mmus to Rnor nucleotide substitution rates between two groups of intergenic lncRNAs: those specific to the Mus genus (Mmus and Mcas) and those conserved among these rodents (Mmus, Mcas and Rnor). Rodent conserved intergenic lncRNA loci show evidence for purifying selection on both transcribed (two-tailed Mann-Whitney test, p<4×10⁻¹⁰) (Figure 3A) and putative promoter sequences (two-tailed Mann-Whitney test, p<3×10⁻¹²) (Figure 3B). Intergenic lncRNA loci transcribed in the Mus genus but not in Rnor, exhibit no constraint in transcribed regions (two-tailed Mann-Whitney test, p>0.2) (Figure 3A). Mus genus-conserved putative core promoters accumulated significantly fewer substitutions than neighbouring putatively neutral sequence (median dprom = 0.151 and dAR = 0.165, two-tailed Mann-Whitney test, p<5×10⁻³) suggesting they evolved under purifying selection (Figure 3B). Negative selective pressure was significantly higher on the promoters of loci with rodent conserved transcription than on promoter sequence with Mus genus-specific transcription (rodent conserved median dprom/dAR = 0.783, Mus genus-specific median dprom/dAR = 0.901, two-tailed Mann-Whitney test, p<7×10⁻³).

We asked whether the observed low degree of sequence constraint on intergenic lncRNA loci, relative to protein-coding genes, was due to rapid transcriptional turnover of a subset of intergenic lncRNAs. To test this, we compared Mmus to Rnor nucleotide substitution rates for the transcribed sequences (including exons and introns) between the subset of intergenic lncRNA loci exhibiting conserved expression in the rodent liver (n = 160) with the corresponding set of protein-coding genes (n = 6641) and found no significant difference (intergenic lncRNA dloci/dAR = 0.827, protein-coding dloci/dAR = 0.842 two-tailed Mann-Whitney test, p>0.58) (Figure S7A). For loci conserved in rodents, nucleotide substitution rates of intronic and exonic sequence were compared between Mmus and Rnor. Introns (dintron) of protein-coding genes and intergenic lncRNAs evolved at comparable rates (intergenic lncRNA dintron/dAR = 0.959, protein-coding dintron/dAR = 0.986, two-tailed Mann-Whitney test, p>0.28) (Figure S7C). In contrast, protein-coding gene exons evolve under strong purifying selection (intergenic lncRNA dexon/dAR = 0.805, protein-coding dexon/dAR = 0.484, two-tailed Mann-Whitney test, p<10−15) (Figure S7B) likely to ensure the maintenance of their coding potential during evolution.
Our results therefore indicate that intergenic lncRNA loci that were gained or lost in recent Mus evolution evolved neutrally between mouse and rat. Conversely, rodent conserved intergenic lncRNAs have accumulated fewer substitutions than neighbouring neutral sequence indicating that conservation of transcription is reflected in sequence constraint.
Intergenic lncRNA loci tend to lie adjacent to protein-coding genes with liver function
Mammalian intergenic lncRNA loci and their genomically adjacent protein-coding genes show a significant tendency to exhibit similar spatiotemporal expression profiles [12], [13], [15], [23], [45]. We found intergenic lncRNA transcription in liver occurs significantly more frequently near to protein-coding genes that are expressed in the liver [39] than expected by chance (see Materials and Methods; 1.6-fold; permutation test, p<5×10⁻³). Complementary results were obtained using Database for Annotation, Visualization, and Integrated Discovery (DAVID) tissue annotation categories (Figure S8) [46]. About 30% of the protein-coding genes closer to intergenic lncRNA loci were classified as liver expressed (p<3×10⁻⁵).
Lineage-specific intergenic lncRNA expression is associated with increased transcription of adjacent protein-coding genes
We considered whether lineage-specific transcription of intergenic lncRNAs might associate with the expression level of genomically adjacent protein-coding genes (see Materials and Methods). If intergenic lncRNAs have no effect on nearby protein-coding gene expression, then lineage-specific differences in gene expression of genes should be unaffected by whether a neighbouring intergenic lncRNA locus is transcribed.
The existence of relatively large numbers of lineage-specific intergenic lncRNAs in mouse and rat permitted this hypothesis to be tested using Mmus and Rnor. Two additional reasons that we specifically analysed the intergenic lncRNAs identified in these two species were (i) the high quality of the genome annotations, relative to Mcas, and (ii) the existence of other published datasets that permitted further validation of our results [20].
First, we normalised gene expression for Mmus and Rnor RNAseq data (see Materials and Methods, Figure S9A) and validated the fold-difference on 17 selected protein-coding mRNA by RT-qPCR (Figure S9C and S9D). In order to obtain a baseline for transcriptional variation between species from this normalised set, we first estimated the fold difference in liver expression between 230 Mmus housekeeping protein-coding genes [47] and their one-to-one orthologous genes in Rnor (median fold-difference in expression = 0.020, see Materials and Methods). Next, we identified the closest protein-coding gene for each conserved or lineage-specific Mmus or Rnor intergenic lncRNA. We selected the intergenic lncRNA loci whose neighbouring protein-coding genes had annotated [48] one-to-one orthologs in the second species (Table S9).
We found that the expression levels of the genes whose nearest intergenic lncRNA locus showed conserved expression between rodents (n = 148) were similar to housekeeping gene levels (median fold-difference = −0.035, two-tailed Mann-Whitney test, p>0.36) (Figure 4, Table S12).
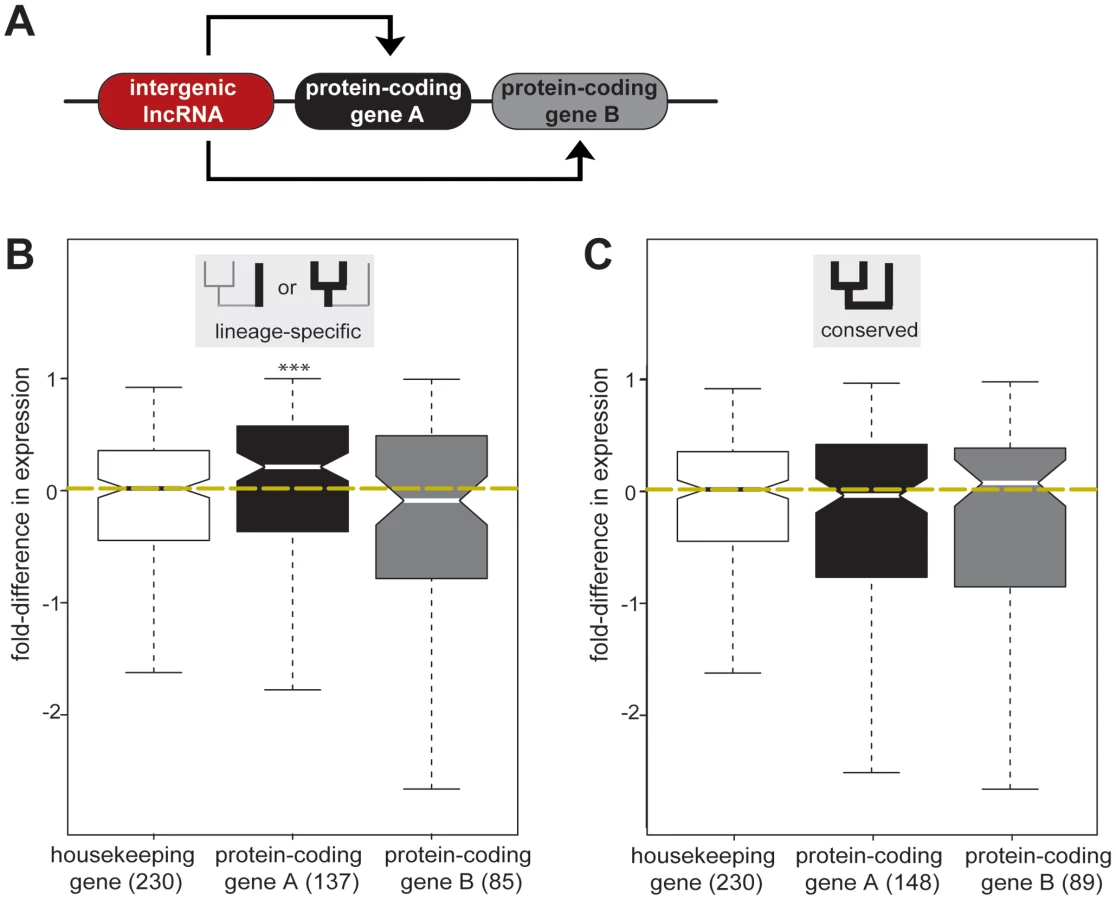
We then asked whether gene expression levels alter when a nearby intergenic lncRNA is gained or lost in one species. In contrast to the conserved situation above, we found that those protein-coding genes A nearest to lineage-specific intergenic lncRNA loci (n = 137) tended to be expressed at a higher level, with a median increase in gene expression of approximately 25% (median fold-difference = 0.212, two-tailed Mann-Whitney test, p<0.005) (Figure 4, Table S12). We repeated this analysis and confirmed this result using an independent dataset [20]. We found that the median expression levels of protein-coding gene loci adjacent to lineage-specific intergenic lncRNA loci were significantly higher than those of protein-coding gene loci near conserved intergenic lncRNA loci (two-tailed Mann-Whitney test, p<7×10⁻⁵) (Figure S9B, Figure S10). Transcription increased for half (50%) of those protein-coding genes lying adjacent to lineage-specific intergenic lncRNA loci, when assessed using either total RNA or mRNA expression; in contrast, less than a third (29%) of protein-coding genes near conserved intergenic lncRNA loci show consistent increased expression in both datasets (two tailed Fisher's exact test, p<0.05, Figure S11), suggesting that in some cases gain or loss of intergenic lncRNAs may influence the expression levels of neighbouring genes. We next investigated if some relative orientations of lineage-specific lncRNA transcription were more frequently associated with increased expression of the most proximal protein-coding gene. We divided lineage-specific intergenic lncRNA and protein-coding gene pairs into three classes (Figure S12A): tandem (48 gene pairs) if transcription occurred in the same orientation, divergent (71 gene pairs), or convergent (17 gene pairs) if transcription occurred in opposite directions either diverging or converging, respectively. All three relative genomic arrangements are associated with increased expression of the closest protein-coding genes. Both tandem and convergent orientations are associated with significantly increased expression at the 5% level while divergent orientation is significant at the 10% level (p<0.08, Figure S12B).
We considered a number of possible interpretations for this apparent association of lineage-specific intergenic lncRNAs with increased transcription of nearby protein-coding genes. The increased gene expression could be either (i) due to regional modifications to the genome that co-ordinately influence all coding and noncoding loci [49] or (ii) correlated with the transcription of the proximal intergenic lncRNA locus [13], [15]. A key distinguishing feature between these two mechanisms is whether lineage-specific expression of intergenic lncRNAs is associated with regional increases in transcription.
To test this, we identified the next most proximal protein-coding gene B, beyond its closest protein-coding gene A (Figure 4A). Genes duplicated in tandem often share regulatory elements and, as a consequence, exhibit similar expression patterns [50]. To account for this evolutionary bias, we excluded 17 protein-coding genes B that were annotated [48] as protein-coding gene A paralogs (see Materials and Methods). In contrast to the observed lineage-specific effects on protein-coding genes A, the expression levels of protein-coding genes B were not significantly affected (two-tailed Mann-Whitney test, p>0.7) by either conserved (median fold-difference = 0.078) or lineage-specific (median fold-difference = −0.088) intergenic lncRNA transcription (Figure 4, Table S13).
We next tested whether similar results might be obtained for lineage-specific protein-coding genes. We used the previously identified set of Mus-genus lineage-specific expressed protein-coding genes. We identified genes A′ as the closest protein-coding genes to these loci, protein-coding A′ (Figure S13). We excluded paralogous protein-coding gene pairs and considered only protein-coding genes A′ with a one-to-one ortholog in rat (89 genes). Transcription levels of nearby genes appear unaffected by the presence of lineage-specific protein-coding gene transcription in the genomic vicinity (median fold-difference = 0.052, two-tailed Mann-Whitney test, p>0.4) (Figure S13). As an additional control, we compared the densities of chromatin boundary elements (CCCTC-binding factor [CTCF]-bound sites) and DNase I hypersensitivity sites in the intergenic regions between (i) the lineage-specifically expressed intergenic lncRNA locus and its neighboring protein-coding gene A and (ii) protein-coding genes B, using data from previous studies [51], [52]. We found no significant differences between these densities (permutation test p>0.2). The association between lineage-specific lncRNA transcription and increased expression levels of neighbouring protein-coding genes might depend on the distance between their transcriptional start sites (TSSs). The median distance of the TSS of a lineage-specifically expressed intergenic lncRNA with its closest protein-coding gene is 22 kb. However, no significant correlation was observed between this distance and the median fold difference in expression for protein-coding genes measured between mouse and rat (Pearson correlation, R = −0.03, p = 0.76, Figure S14).
Our comparison of matched tissues in two species thus revealed that birth or death of intergenic lncRNAs is associated with changes in transcription of proximal protein-coding genes.
Discussion
To investigate the evolution of lncRNAs, we identified the highest confidence set of lncRNAs in matched, nutritionally unstressed, adult livers of three closely related rodent species: Mmus, Mcas and Rnor, by combining genome-wide interrogation of chromatin signatures and total RNA expression. This highly conservative set of lncRNAs confirmed a number of prior observations. First, many intergenic and antisense lncRNA loci are expressed in a cell/tissue - or time-specific manner: we found that the intergenic lncRNAs present in adult liver are not only absent from other adult tissues, but are perhaps surprisingly even absent in developing mouse liver. These temporally - and spatially - restricted expression patterns, together with their relatively low expression levels, likely explain why our intergenic lncRNA set shows limited overlap with previously reported sets [18]. From our analysis, two major results emerged: first, that intergenic and antisense lncRNA transcription can evolve extremely rapidly between closely related mammals; second, that this rapid evolution seems to occur simultaneously with increased expression of neighbouring protein-coding genes.
Evolution of intergenic and antisense lncRNA transcription between closely related mammals
Previous studies have indicated that 12 to 15% of lncRNAs are conserved between human and mouse, based on comparison of EST and cDNA datasets from disparate experimental designs [22], [23]. Our matched interspecies data are perhaps better suited to establish experimentally the rate of lncRNA turnover. The use of mouse and rat, being closely related species, minimises the effects of genomic sequence divergence, thus better uncoupling sequence and transcriptional changes. Transcription of noncoding loci is more frequently gained or lost than transcription of protein-coding genes; between 28% and 61% of intergenic and antisense lncRNAs, respectively are specific to the Mus genus. We expect similar turnover will be found in most cell types of various developmental stages given that liver is a typical somatic tissue [53]. The transience of intergenic lncRNA transcription is mirrored by changes to selective pressures acting on their sequences. Our results are consistent with purifying selection acting on transcribed intergenic lncRNA loci, and with no selection acting on untranscribed orthologous sequence in other species. This coupling of transcriptional conservation with sequence constraint suggests that conserved intergenic lncRNA loci are biologically significant in rodents.
Lineage-specific intergenic lncRNAs and transcription of neighbouring protein-coding genes
The expression levels of intergenic lncRNAs and their genomically neighbouring protein-coding genes have previously been shown to be positively correlated [12], [13]. We find that species-specific transcription of intergenic lncRNAs correlates with elevated expression of neighbouring protein-coding genes. The increased transcription observed among neighbouring genes is unique to intergenic lncRNAs, and seems unlikely to be due to local changes in chromatin environment. If the intergenic lncRNAs in other tissues and species behave similarly, intergenic lncRNAs could contribute substantially to lineage-specific and tissue-specific evolution of gene expression.
The rapid turnover we observed in lncRNA transcription strongly resembles what was recently reported for transcription factor binding events [54]–[56], tRNA transcription [20] and functional regulatory sequences in general [19]. For instance, between 10 to 20% of transcription factor binding events overlap between human and mouse liver [56], which is similar in scale to what we now find for intergenic lncRNAs. These parallels suggest that rapid evolution is a general feature of noncoding regulatory mechanisms.
It was recently proposed that intergenic lncRNAs have minimal impact on the transcriptional regulation of their neighbouring protein-coding genes [16], [23]. By exploiting the rapid birth and death of noncoding RNAs, we revealed that intergenic lncRNAs could contribute to lineage-specific changes in the expression levels of neighbouring protein-coding genes. Our data do not preclude distal regulatory roles, which might be lineage-specific, for some or all intergenic lncRNAs we investigate. It will now be crucial to understand how intergenic lncRNAs evolve and to unravel the molecular mechanisms underlying lineage-specific gene expression changes associated with intergenic lncRNAs.
Materials and Methods
Tissue preparation
ChIPseq, RNAseq, and RT-PCR experiments were performed on liver material isolated from three rodents: Mus musculus domesticus (Mmus), Mus musculus castaneus (Mcas), and Rattus norvegicus (Rnor). Each ChIPseq and RNAseq experiments were performed on at least two independent biological replicates from different animals. Mmus and Mcas (male adults, 10 weeks old) were obtained from the Cambridge Research Institute. Rnor (male adults, 9 weeks old) were obtained from Charles River. All tissues were either treated post-mortem with 1% formaldehyde for ChIP experiments or flash-frozen in liquid N2 for RNA experiments. The investigation was approved by the ethics committee and followed the Cambridge Research Institute guidelines for the use of animals in experimental studies under Home Office license PPL 80/2197.
Library and sequencing preparation
ChIP sequencing experiments were performed as described previously [57] using H3K4me3 antibody (CMA304) [58]. In brief, the immunoprecipitated DNA was end-repaired, A-tailed, ligated to the sequencing adapters, amplified by 18 cycles of PCR and size selected (200–300 bp). For RNA-sequencing library preparation, total RNA was extracted using Qiazol reagents (Qiagen) and DNase-treated (Turbo DNase, Ambion). Ribosomal RNA was depleted from total RNA using RiboMinus (Invitrogen). RNA was reversed transcribed and converted into double-stranded cDNA (SuperScript cDNA synthesis kit, Invitrogen), sheared by sonication followed by paired end adapter (Illumina) ligation and prior to PCR amplification cDNA was UNG-treated to maintain strand-specificity [59]. After passing quality control on a Bioanalyzer 1000 DNA chip (Agilent) libraries were sequenced on the Illumina Genome Analyzer II (single-ended) and post-processed using the standard GA pipeline software v1.4 (Illumina).
Read mapping and next-generation sequencing (NGS) data analysis
H3K4me3 ChIPseq and associated input DNA control ChIPseq reads were aligned to the corresponding reference genomes (mm9 for Mus musculus domesticus and Mus musculus castaneus; Rn4 for Rattus norvegicus) using MAQ version 0.7.1 (default parameters) [60]. Reads mapping to multiple genomic locations were discarded. Genomic regions enriched over matching input DNA control were defined using MACS version 1.3.7.1 using the default parameters [61]. Comparative analysis was carried out using the Galaxy web tool [62]. Total RNA sequencing reads were mapped with Tophat (version 1.3.0) [25], using default parameters. A file containing the mapped coordinates of mouse and rat ESTs and mRNA mapped coordinates (downloaded from UCSC on the 11th March 2011) was provided to facilitate total RNA read mapping across splice junction for Mmus and Mcas, and Rnor respectively. Reads mapping to rRNA, tRNA and mtRNA were masked and the remainder were used to assemble transcripts de novo using Cufflinks (version 1.3.0) [27].
Transcript and promoter annotation
We filtered out transcripts smaller than 200 nucleotides (nt) and without an H3K4me3 peak overlapping their predicted transcriptional start site (TSS). Transcripts overlapping protein-coding gene annotations (by one or more base pair) from RefSeq, Ensembl (build 60) [48] and UCSC were annotated as intragenic. To discriminate between unannotated protein-coding and putatively noncoding transcripts we estimated the coding potential of all intergenic transcripts using the coding potential calculator (CPC) [32]. We annotated all transcripts with a coding potential less than 0 as intergenic long noncoding RNAs (intergenic lncRNAs). The 400 nt region upstream of the 5′ end (TSS) of each intergenic lncRNA or protein-coding transcript was annotated as a putative promoter. Transcribed loci were defined as non-overlapping regions with one or more transcripts that can contain overlapping exonic or intronic nucleotides. Loci containing only transcripts predicted to be intergenic lncRNAs were annotated as intergenic lncRNA loci. The remainder were annotated as protein-coding loci.
For the identification of antisense transcripts from the Cufflinks output file (n = 56917), we first identified 2383 transcripts overlapping protein-coding genes in antisense orientation in Mmus. This number included four types of ambiguous cases that were systematically removed: (i) annotated protein-coding transcripts (removing 1816 transcripts), (ii) antisense transcripts lacking an H3K4me3 peak independent from the TSS of overlapping protein-coding gene (removing 324 transcripts), (iii) transcripts lacking H3K4me3 marks at their 5′ end, and (iv) mapping assembly artefacts, revealed by visual inspection (collectively removing 90 transcripts). Taking all of these cases into consideration, 49 loci (or 153 antisense transcripts) were annotated in Mmus. A similar procedure was conducted in Mcas and Rnor, revealing 66 loci in total.
To identify lncRNAs deriving from bidirectional transcription at TSSs of protein-coding genes, we subtracted divergently transcribed protein-coding genes from our list of actively transcribed protein-coding genes. The TSSs of gene loci are spanned by one H3K4me3 peak and the evidence of divergent transcription is represented by RNAseq reads mapping in opposite directions. We identified divergent reads within an 1 kb window of a protein-coding gene's annotated TSS (Ensembl, build 60) [30].
Heatmaps and transcription start site aggregation plots were constructed using seqMINER [63].
To account for the difference in RNAseq library size between the three rodent species (Table S1) Mmus and Rnor transcripts were assembled using the same number of reads in Mcas library, the smallest RNAseq library. Reads were randomly selected without replacement and transcripts reassembles using Cufflinks and annotated as described above.
Reverse transcription and quantitative PCR (RT-qPCR)
RT-PCR analysis of lncRNAs was performed by reverse transcription of 10 µg of DNase-treated total RNA according to the manufacturer's protocols using 200 U SuperScript-II Reverse Transcriptase (Invitrogen Corporation), 0.5 µg oligo(dT) and 0.5 µg random primers or 1 µg gene-specific primers (see Table S11). Negative controls were included in RT reactions. The cDNAs were then treated with RNase H at 37°C for 1 hour. Each PCR reaction typically contained 25 ng of cDNA, 5 pmol of the gene-specific primers (Table S11), 10 µL PCR Master Mix (Bioline), and 2 µL of the diluted cDNAs in a total volume of 20 µL. Reactions were carried out in triplicate in ABI 7900HT Fast Real-Time PCR system at the optimal temperature, as defined by provider instructions.
Genome-wide associations
The significance of genome-wide associations between intergenic lncRNAs and their neighbouring protein-coding genes was assessed using Genome Association Tool (GAT) (Heger et al., in preparation). GAT compares the observed number of overlapping nucleotides between a set of segments with particular annotations to what would be expected from random placement of these segments. Expected densities are obtained using a randomisation procedure that accounts for G+C content and chromosome specific biases. A previous version of GAT was used in [9], [18]. This tool infers associations between intergenic lncRNA loci (segments) across the following annotation sets: (I) mouse-to-rat indel purified segments [44] and (II) liver-expressed protein-coding gene territories (Average Difference values >200) [39]. A protein-coding gene territory is defined as the genomic region containing all nucleotides that are closer to the gene than they are to its most proximal up - and downstream protein-coding genes, as described elsewhere [9], [18]. As a second tool, we used the gene functional classification tool Database for Annotation, Visualization, and Integrated Discovery (DAVID) (default parameters: count = 2 and ease = 0.1) [46] to explore the enrichment of tissue gene expression.
Regions of the mouse and rat genome that are enriched in CTFC binding were obtained from [51]. DNase hypersensity sites (DHS) in the mouse adult liver were obtained from [52]. Only male and sex independent DHS peaks that were either annotated as being robust and standard were considered in this analysis. GAT (Heger et al., in preparation) was used to test the observed density of these two class of regulatory elements in the intergenic region between lineage-specific intergenic lncRNAs and protein coding gene A (Figure 4) to what would be expected based on their distribution across the intergenic regions between lineage-specific intergenic lncRNA and protein-coding gene B (Figure 4).
Transcriptional conservation
Orthologous regions between Mmus and Rnor were identified using whole genome pairwise alignments [42]. An intergenic lncRNA locus was considered to be expressed in another species when its orthologous (between Mus species and Rnor) or equivalent (between Mmus and Mcas) position had an overlapping (>1 bp) H3K4me3 peak and one or more overlapping RNAseq reads. Due to the lack of H3K4me3 data for human, overlap (>1 bp) by one or more RNAseq reads in the orthologous human location was considered sufficient evidence for transcriptional conservation of an Mmus locus in human sequence. Only Mmus loci whose transcription was supported by one or more polyA+ selected sequencing read [41] were considered in this analysis. Identical criteria were used to determine the conservation of antisense lncRNA loci. An antisense lncRNA locus was judged to be expressed in another species when its orthologous position had an overlapping (>1 bp) H3K4me3 peak and one or more overlapping RNAseq reads in opposite orientations. We visually inspected these calls on 66 loci across the three rodent species.
Nucleotide constraint
Nucleotide constraint between Mmus and Rnor locus, exon, intron or putative promoter was estimated as described previously [18]. Pairwise substitution rates between Mmus and Rnor genomic regions were estimated using BASEML from the PAML package with the REV substitution model [64]. The substitution rate of the region of interest was compared to the rate observed for non-overlapping adjacent (<500 kb) ancestral repeats (inserted before the primate and rodent split) with similar G+C content [18].
Gene expression
Mmus and Rnor protein-coding transcript annotations were downloaded from Ensembl (build 60, http://www.ensembl.org/index.html) and used to define a set of constitutive exons for each gene. To account for differences in size of constitutively expressed portions of Mmus and Rnor genes, the total number of overlapping reads per nucleotide in Rnor was adjusted to what would be expected if the sequence in Rnor had the same length as that observed in Mmus. The expression of a gene in Rnor or Mmus is proportional to the sum of reads mapped to their exons divided by their combined length. To allow comparison of gene expression between species, read counts were normalized using TMM (edgeR package) [65]. Briefly, to estimate the normalised library size for each species, it was assumed that 60% of expressed genes were transcribed at similar levels in the two species. Other cut-offs (50% and 70%) yielded similar results. The normalised Mmus and Rnor library size was used to calculate the expression level (as total number of fragments per kb of sequence per million reads mapped, FPKM) of each gene in each species.
Gene expression differences between mouse and rat
Each intergenic lncRNA locus was paired with its genomically closest protein-coding gene. Only pairs whose protein-coding genes had one-to-one orthologs between Mmus and Rnor were considered. The fold difference in expression levels of protein-coding genes associated with lineage-specific (Mus-genus or Rnor-specific) or rodent conserved expression was estimated between [6] the same direction. To calculate the fold difference in expression for each housekeeping gene between Mmus and Rnor species X and Y were randomly assigned. Fold expression differences for protein-coding genes B or A′ (Figure 4, Figure S12) were calculated in a similar manner.
Statistical analysis
Apart from permutation tests all other statistical analysis were performed using the R package [66].
Accession code
RNAseq and H3K4me3 ChIPseq sequencing data are available from ArrayExpress under accession number E-MTAB-867. Additional mRNAseq data used was E-MTAB-424.
Supporting Information
Zdroje
1. BertonePStolcVRoyceTERozowskyJSUrbanAE 2004 Global identification of human transcribed sequences with genome tiling arrays. Science 306 2242 2246
2. CarninciPKasukawaTKatayamaSGoughJFrithMC 2005 The transcriptional landscape of the mammalian genome. Science 309 1559 1563
3. CloonanNForrestARKolleGGardinerBBFaulknerGJ 2008 Stem cell transcriptome profiling via massive-scale mRNA sequencing. Nat Methods 5 613 619
4. OkazakiYFurunoMKasukawaTAdachiJBonoH 2002 Analysis of the mouse transcriptome based on functional annotation of 60,770 full-length cDNAs. Nature 420 563 573
5. GuttmanMAmitIGarberMFrenchCLinMF 2009 Chromatin signature reveals over a thousand highly conserved large non-coding RNAs in mammals. Nature 458 223 227
6. MercerTRDingerMEMattickJS 2009 Long non-coding RNAs: insights into functions. Nat Rev Genet 10 155 159
7. KatayamaSTomaruYKasukawaTWakiKNakanishiM 2005 Antisense transcription in the mammalian transcriptome. Science 309 1564 1566
8. EngstromPGSuzukiHNinomiyaNAkalinASessaL 2006 Complex Loci in human and mouse genomes. PLoS Genet 2 e47 doi:10.1371/journal.pgen.0020047
9. PontingCPOliverPLReikW 2009 Evolution and functions of long noncoding RNAs. Cell 136 629 641
10. WangKCChangHY 2011 Molecular mechanisms of long noncoding RNAs. Mol Cell 43 904 914
11. HuarteMGuttmanMFeldserDGarberMKoziolMJ 2010 A large intergenic noncoding RNA induced by p53 mediates global gene repression in the p53 response. Cell 142 409 419
12. PonjavicJOliverPLLunterGPontingCP 2009 Genomic and transcriptional co-localization of protein-coding and long non-coding RNA pairs in the developing brain. PLoS Genet 5 e1000617 doi:10.1371/journal.pgen.1000617
13. OromUADerrienTBeringerMGumireddyKGardiniA 2010 Long noncoding RNAs with enhancer-like function in human cells. Cell 143 46 58
14. RinnJLKerteszMWangJKSquazzoSLXuX 2007 Functional demarcation of active and silent chromatin domains in human HOX loci by noncoding RNAs. Cell 129 1311 1323
15. WangKCYangYWLiuBSanyalACorces-ZimmermanR 2011 A long noncoding RNA maintains active chromatin to coordinate homeotic gene expression. Nature 472 120 124
16. GuttmanMDonagheyJCareyBWGarberMGrenierJK 2011 lincRNAs act in the circuitry controlling pluripotency and differentiation. Nature 477 295 300
17. PonjavicJPontingCPLunterG 2007 Functionality or transcriptional noise? Evidence for selection within long noncoding RNAs. Genome Res 17 556 565
18. MarquesACPontingCP 2009 Catalogues of mammalian long noncoding RNAs: modest conservation and incompleteness. Genome Biol 10 R124
19. MeaderSPontingCPLunterG 2010 Massive turnover of functional sequence in human and other mammalian genomes. Genome Res 20 1335 1343
20. KutterCBrownGDGoncalvesAWilsonMDWattS 2011 Pol III binding in six mammals shows conservation among amino acid isotypes despite divergence among tRNA genes. Nat Genet 43 948 955
21. BarrettRDHoekstraHE 2011 Molecular spandrels: tests of adaptation at the genetic level. Nat Rev Genet 12 767 780
22. ChurchDMGoodstadtLHillierLWZodyMCGoldsteinS 2009 Lineage-specific biology revealed by a finished genome assembly of the mouse. PLoS Biol 7 e1000112 doi:10.1371/journal.pbio.1000112
23. CabiliMNTrapnellCGoffLKoziolMTazon-VegaB 2011 Integrative annotation of human large intergenic noncoding RNAs reveals global properties and specific subclasses. Genes Dev 25 1915 1927
24. ChodroffRAGoodstadtLSireyTMOliverPLDaviesKE 2010 Long noncoding RNA genes: conservation of sequence and brain expression among diverse amniotes. Genome Biol 11 R72
25. TrapnellCPachterLSalzbergSL 2009 TopHat: discovering splice junctions with RNA-Seq. Bioinformatics 25 1105 1111
26. KapranovPSt LaurentGRazTOzsolakFReynoldsCP 2010 The majority of total nuclear-encoded non-ribosomal RNA in a human cell is ‘dark matter’ un-annotated RNA. BMC Biol 8 149
27. TrapnellCWilliamsBAPerteaGMortazaviAKwanG 2010 Transcript assembly and quantification by RNA-Seq reveals unannotated transcripts and isoform switching during cell differentiation. Nat Biotechnol 28 511 515
28. Santos-RosaHSchneiderRBannisterAJSherriffJBernsteinBE 2002 Active genes are tri-methylated at K4 of histone H3. Nature 419 407 411
29. ZhangYLiuTMeyerCAEeckhouteJJohnsonDS 2008 Model-based analysis of ChIP-Seq (MACS). Genome Biol 9 R137
30. CoreLJWaterfallJJLisJT 2008 Nascent RNA sequencing reveals widespread pausing and divergent initiation at human promoters. Science 322 1845 1848
31. WeiWPelechanoVJarvelinAISteinmetzLM 2011 Functional consequences of bidirectional promoters. Trends Genet 27 267 276
32. KongLZhangYYeZQLiuXQZhaoSQ 2007 CPC: assess the protein-coding potential of transcripts using sequence features and support vector machine. Nucleic Acids Res 35 W345 349
33. GuttmanMGarberMLevinJZDonagheyJRobinsonJ 2010 Ab initio reconstruction of cell type-specific transcriptomes in mouse reveals the conserved multi-exonic structure of lincRNAs. Nat Biotechnol 28 503 510
34. LeeJTDavidowLSWarshawskyD 1999 Tsix, a gene antisense to Xist at the X-inactivation centre. Nat Genet 21 400 404
35. ChanETQuonGTChuaGBabakTTrochessetM 2009 Conservation of core gene expression in vertebrate tissues. J Biol 8 33.31 .17
36. PauliARinnJLSchierAF 2011 Non-coding RNAs as regulators of embryogenesis. Nat Rev Genet 12 136 149
37. LiTHuangJJiangYZengYHeF 2009 Multi-stage analysis of gene expression and transcription regulation in C57/B6 mouse liver development. Genomics 93 235 242
38. DouzeryEJDelsucFStanhopeMJHuchonD 2003 Local molecular clocks in three nuclear genes: divergence times for rodents and other mammals and incompatibility among fossil calibrations. J Mol Evol 57 S201 213
39. SuAIWiltshireTBatalovSLappHChingKA 2004 A gene atlas of the mouse and human protein-encoding transcriptomes. Proc Natl Acad Sci U S A 101 6062 6067
40. MurphyWJPringleTHCriderTASpringerMSMillerW 2007 Using genomic data to unravel the root of the placental mammal phylogeny. Genome Res 17 413 421
41. BrawandDSoumillonMNecsuleaAJulienPCsardiG 2011 The evolution of gene expression levels in mammalian organs. Nature 478 343 348
42. SchwartzSKentWJSmitAZhangZBaertschR 2003 Human-mouse alignments with BLASTZ. Genome Res 13 103 107
43. ChiaromonteFYapVBMillerW 2002 Scoring pairwise genomic sequence alignments. Pac Symp Biocomput 115 126
44. LunterGPontingCPHeinJ 2006 Genome-wide identification of human functional DNA using a neutral indel model. PLoS Comput Biol 2 e5 doi:10.1371/journal.pcbi.0020005
45. KhalilAMGuttmanMHuarteMGarberMRajA 2009 Many human large intergenic noncoding RNAs associate with chromatin-modifying complexes and affect gene expression. Proc Natl Acad Sci U S A 106 11667 11672
46. DennisGJrShermanBTHosackDAYangJGaoW 2003 DAVID: Database for Annotation, Visualization, and Integrated Discovery. Genome Biol 4 P3
47. de JongeHJFehrmannRSde BontESHofstraRMGerbensF 2007 Evidence based selection of housekeeping genes. PLoS ONE 2 e898 doi:10.1371/journal.pone.0000898
48. FlicekPAmodeMRBarrellDBealKBrentS 2011 Ensembl 2011. Nucleic Acids Res 39 D800 806
49. EbisuyaMYamamotoTNakajimaMNishidaE 2008 Ripples from neighbouring transcription. Nat Cell Biol 10 1106 1113
50. LercherMJUrrutiaAOHurstLD 2002 Clustering of housekeeping genes provides a unified model of gene order in the human genome. Nat Genet 31 180 183
51. SchmidtDSchwaliePCWilsonMDBallesterBGoncalvesA 2012 Waves of retrotransposon expansion remodel genome organization and CTCF binding in multiple mammalian lineages. Cell 148 335 348
52. LingGSugathanAMazorTFraenkelEWaxmanDJ 2010 Unbiased, genome-wide in vivo mapping of transcriptional regulatory elements reveals sex differences in chromatin structure associated with sex-specific liver gene expression. Mol Cell Biol 30 5531 5544
53. BlouinABolenderRPWeibelER 1977 Distribution of organelles and membranes between hepatocytes and nonhepatocytes in the rat liver parenchyma. A stereological study. J Cell Biol 72 441 455
54. BourqueGLeongBVegaVBChenXLeeYL 2008 Evolution of the mammalian transcription factor binding repertoire via transposable elements. Genome Res 18 1752 1762
55. KunarsoGChiaNYJeyakaniJHwangCLuX 2010 Transposable elements have rewired the core regulatory network of human embryonic stem cells. Nat Genet 42 631 634
56. SchmidtDWilsonMDBallesterBSchwaliePCBrownGD 2010 Five-vertebrate ChIP-seq reveals the evolutionary dynamics of transcription factor binding. Science 328 1036 1040
57. SchmidtDWilsonMDSpyrouCBrownGDHadfieldJ 2009 ChIP-seq: using high-throughput sequencing to discover protein-DNA interactions. Methods 48 240 248
58. KimuraHHayashi-TakanakaYGotoYTakizawaNNozakiN 2008 The organization of histone H3 modifications as revealed by a panel of specific monoclonal antibodies. Cell Struct Funct 33 61 73
59. ParkhomchukDBorodinaTAmstislavskiyVBanaruMHallenL 2009 Transcriptome analysis by strand-specific sequencing of complementary DNA. Nucleic Acids Res 37 e123
60. LiHRuanJDurbinR 2008 Mapping short DNA sequencing reads and calling variants using mapping quality scores. Genome Res 18 1851 1858
61. BergerMFBadisGGehrkeARTalukderSPhilippakisAA 2008 Variation in homeodomain DNA binding revealed by high-resolution analysis of sequence preferences. Cell 133 1266 1276
62. GiardineBRiemerCHardisonRCBurhansRElnitskiL 2005 Galaxy: a platform for interactive large-scale genome analysis. Genome Res 15 1451 1455
63. YeTKrebsARChoukrallahMAKeimeCPlewniakF 2011 seqMINER: an integrated ChIP-seq data interpretation platform. Nucleic Acids Res 39 e35
64. YangZ 1997 PAML: a program package for phylogenetic analysis by maximum likelihood. Comput Appl Biosci 13 555 556
65. RobinsonMDOshlackA 2010 A scaling normalization method for differential expression analysis of RNA-seq data. Genome Biol 11 R25
66. R Development Core Team 2011 R: A Language and Environment for Statistical Computing Vienna, Austria
Štítky
Genetika Reprodukční medicínaČlánek vyšel v časopise
PLOS Genetics
2012 Číslo 7
Nejčtenější v tomto čísle
- Guidelines for Genome-Wide Association Studies
- The Role of Rice HEI10 in the Formation of Meiotic Crossovers
- Identification of Chromatin-Associated Regulators of MSL Complex Targeting in Dosage Compensation
- GWAS Identifies Novel Susceptibility Loci on 6p21.32 and 21q21.3 for Hepatocellular Carcinoma in Chronic Hepatitis B Virus Carriers