
Genome-Wide Haplotype Analysis of Expression Quantitative Trait Loci in Monocytes
In order to assess whether gene expression variability could be influenced by several SNPs acting in cis, either through additive or more complex haplotype effects, a systematic genome-wide search for cis haplotype expression quantitative trait loci (eQTL) was conducted in a sample of 758 individuals, part of the Cardiogenics Transcriptomic Study, for which genome-wide monocyte expression and GWAS data were available. 19,805 RNA probes were assessed for cis haplotypic regulation through investigation of ∼2,1×10⁹ haplotypic combinations. 2,650 probes demonstrated haplotypic p-values >104-fold smaller than the best single SNP p-value. Replication of significant haplotype effects were tested for 412 probes for which SNPs (or proxies) that defined the detected haplotypes were available in the Gutenberg Health Study composed of 1,374 individuals. At the Bonferroni correction level of 1.2×10⁻⁴ (∼0.05/412), 193 haplotypic signals replicated. 1000G imputation was then conducted, and 105 haplotypic signals still remained more informative than imputed SNPs. In-depth analysis of these 105 cis eQTL revealed that at 76 loci genetic associations were compatible with additive effects of several SNPs, while for the 29 remaining regions data could be compatible with a more complex haplotypic pattern. As 24 of the 105 cis eQTL have previously been reported to be disease-associated loci, this work highlights the need for conducting haplotype-based and 1000G imputed cis eQTL analysis before commencing functional studies at disease-associated loci.
Published in the journal:
. PLoS Genet 9(1): e32767. doi:10.1371/journal.pgen.1003240
Category:
Research Article
doi:
https://doi.org/10.1371/journal.pgen.1003240
Summary
In order to assess whether gene expression variability could be influenced by several SNPs acting in cis, either through additive or more complex haplotype effects, a systematic genome-wide search for cis haplotype expression quantitative trait loci (eQTL) was conducted in a sample of 758 individuals, part of the Cardiogenics Transcriptomic Study, for which genome-wide monocyte expression and GWAS data were available. 19,805 RNA probes were assessed for cis haplotypic regulation through investigation of ∼2,1×10⁹ haplotypic combinations. 2,650 probes demonstrated haplotypic p-values >104-fold smaller than the best single SNP p-value. Replication of significant haplotype effects were tested for 412 probes for which SNPs (or proxies) that defined the detected haplotypes were available in the Gutenberg Health Study composed of 1,374 individuals. At the Bonferroni correction level of 1.2×10⁻⁴ (∼0.05/412), 193 haplotypic signals replicated. 1000G imputation was then conducted, and 105 haplotypic signals still remained more informative than imputed SNPs. In-depth analysis of these 105 cis eQTL revealed that at 76 loci genetic associations were compatible with additive effects of several SNPs, while for the 29 remaining regions data could be compatible with a more complex haplotypic pattern. As 24 of the 105 cis eQTL have previously been reported to be disease-associated loci, this work highlights the need for conducting haplotype-based and 1000G imputed cis eQTL analysis before commencing functional studies at disease-associated loci.
Introduction
The development of high throughput technologies has stimulated comprehensive surveys on genome-wide expression and DNA variability data for disentangling the genetic architecture of human diseases [1]–[3]. The genetics of transcript abundance has been extensively investigated through genome-wide expression studies (GWES) [4]–[9]. These studies demonstrated that, for a large fraction of genes (so-called eQTLs), expression is influenced by single nucleotide polymorphisms (SNPs) located in the vicinity of the regulated genes, generally referred to as cis eSNPs. The importance of cis eSNPs would be enhanced if they were associated at the same time with a disease, as such data would indicate that the associated gene is a candidate for the disease. Despite its limitations [2], [3], [10], [11], the integration of GWES and genome wide association studies (GWAS) data has recently received great attention [12] and several successes illustrate the merits of this approach [13]–[15].
Most cis eQTL studies so far were based on single SNP analyses that did not account for the multiplicity of cis eSNPs that are often observed at an eQTL. For example, in the Gutenberg Health Study (GHS) [9] conducted on monocyte expression, the median number of eSNPs per eQTL was eleven. One way to investigate whether associations observed at several cis eSNPs of the same eQTL are independent, or due to linkage disequilibrium (LD) between SNPs, is to conduct haplotype analysis, a strategy shown to be able to distinguish “true” effect from those due to LD [16], [17]. Another approach is to perform GWES conditioning on the best cis eSNPs identified through a first run of GWES [11]. The limitation of this strategy is that it is only able to identify cis eSNPs that have independent additive effects, contrary to haplotype analysis which can identify combinations of SNPs having non-additive effects or tagging a rare functional variant.
In this work, we conducted a systematic genome-wide search for haplotypic cis-acting effects on monocyte gene expression using data from the Cardiogenics Transcriptomic Study (CTS) [14]. A comprehensive replication of the haplotypic associations detected in CTS was then performed in the same cell type using the GHS dataset [9]. A summary of the overall research strategy adopted in this work is displayed in Figure 1.

Results
Research strategy
The discovery phase was conducted in CTS where monocyte gene expression profiles were assessed in 758 subjects using the Illumina HumanRef-8 v3 Beadchip array and genome-wide genotypes were assessed using the Illumina Human Custom 1.2M and Human 610 Quad Custom arrays. We analyzed 19,805 autosomal probes covering 15,428 genes. For each probe, a systematic search for cis haplotype effects was undertaken according to the sequential procedure described in the Methods section. Probes with strong statistical evidence for cis haplotype effect were selected for replication in GHS where monocyte gene expression profiles were assessed in 1,374 individuals using the Illumina HT-12 v3 BeadChip and genome-wide genotypes were assessed using the Affymetrix Genome-Wide Human SNP Array 6.0. As the CTS and GHS projects did not use the same genome-wide SNP arrays, if a SNP contributing to a cis haplotype effect in CTS was not genotyped in GHS, we tried to identify a proxy SNP (pairwise LD r2>0.80) using the SNAP software [18].
Discovery phase
For identifying cis haplotype effects in CTS, we selected all SNPs located within a 200 kb distance upstream or downstream from any probe sequence (346,749 autosomal SNPs). SNPs located within a 200 kb distance of several adjacent probes were analyzed with each probe separately. The distribution of the number of SNPs per probe is shown in Figure S1, with minimum, mean and maximum values of 2, 70.9 and 287, respectively. To reduce the redundancy among SNPs due to strong LD, we selected haplotype tagging SNPs (htSNPs) within each consecutive bin of 10 adjacent SNPs (see Methods). This resulted in a subset of 181,233 htSNPs for analysis. The minimum, mean and maximum numbers of htSNPs per probe were 2, 46.9 and 187, respectively (Figure S1).
For each probe locus, we characterized all haplotypic configurations derived from the combination of 1 to 4 (not necessarily adjacent) htSNPs. These haplotypes were then tested for association with expression level of their corresponding probe, resulting in 2,097,693,183 associations explored for the 19,805 probes. This analysis was conducted using the GridHaplo software [19] on the European Grid Infrastructure EGI [20]. In order to get robust results, we focused on probes for which the best haplotypic p-value for association was at least 104-fold smaller than the best single SNP p-value at the locus. This criterion was used on pragmatic grounds to select probes which would not have been picked up by a single SNP analysis and where haplotypes were likely to be more relevant than single SNP alone for explaining probe expression variability. Among the 19,805 investigated probes, 2,650 (13.4%) fulfilled this criterion. When selecting the htSNPs involved in the best haplotypic configuration at each associated locus (see Methods), the total number of associated htSNPs was 9,486. Considering more stringent thresholds of 106, 108, 1010 and 1050-fold difference for measuring the improvement of p-value of haplotype over single SNP analysis decreased the number of probes with cis haplotypic effects to 1,550 (7.8%), 1,069 (5.4%), 834 (4.2%) and 74 (0.4%), respectively.
Replication phase
The 2,650 probes identified at the 104 threshold in the discovery phase were interrogated in the GHS expression dataset. All probes were available for replication. However, among the 9,486 htSNPs characterizing the best haplotype associations in CTS, only 5,162 (54%) were directly genotyped or could be tagged by a genotyped proxy SNP in GHS. As a consequence, the replication of haplotypic signals could be assessed only in 412 of the 2,650 probes.
Replication of the haplotypic signals observed in CTS was performed using the THESIAS software [21] implementing the same statistical haplotype model as GridHaplo. We considered as replicated in GHS those probes which exhibited a significant association consistent with that observed in CTS (i.e. the same haplotypes associated with the same direction of effects on probe expression). A Bonferroni threshold correcting for the number of probes tested for replication (n = 412) was taken (p<1.21×10⁻⁴). At this significance level, the haplotypic effects detected in CTS were replicated in GHS for 193 of the 412 probes (46.8%).
We further investigated whether these haplotypic effects could be explained by a single SNP. For this purpose, we imputed SNPs in GHS using the MACH software [22] and taking as reference the European panel from the 1000 Genome Project. Among the 10,210,859 SNPs imputed with good quality, all those located within a 200 kb distance from a replicated probe were tested for association with their corresponding probe expression by linear regression analysis assuming additive allele effects. Conditional analyses were then conducted in which haplotype effects were adjusted for the SNP demonstrating the strongest single SNP association, i.e. the best cis eSNP.
For 88 of the 193 probes (45.6%), the haplotype p-value was no longer significant (p>1.21×10⁻⁴) after adjustment for the best cis eSNP, suggesting that the haplotypic signal was due to the effect of a single SNP that was missed in the discovery phase because the SNP was not genotyped in CTS. For the 105 remaining probes (54.4%), the haplotype p-value was still significant in the conditional analysis, indicating a residual effect beyond that of the best cis eSNP. Four different situations were encountered as outlined in Table S1.
For 5 of the 105 probes (group A in Table S1), the best cis eSNP was among the htSNPs defining the haplotypic combination associated to expression, but it was not sufficient to explain alone the observed association. Such a situation is illustrated in Figure 2 with the CAMKK2 gene. The best haplotypic configuration is composed of 3 SNPs, rs1140886, rs1063843 and rs11065504. The best cis eSNP is rs11065504 whose allele C, associated to an increased expression, is carried by a single haplotype TCC. However, there is a rare haplotype CCG not carrying this allele which is associated with an even greater increase of expression. These effects are remarkably similar in CTS and GHS.

For 19 probes (group B in Table S1), the best cis eSNP was not among the associated htSNPs and lost its significance in the conditional model, while the haplotypic signal was barely modified by the adjustment on the best cis eSNP. This suggests that the effect of the best cis eSNP was due to its LD with the identified haplotypes. An example is given in Figure 3 with the AP3S2 gene.

For 60 probes (group C in Table S1), the best cis eSNP was not among the associated htSNPs and adjusting for its effect attenuated the haplotype association. For 10 probes, further adjustment on the second imputed best cis eSNP completely explained the haplotype association originally detected. This did not hold for the other 50 probes, suggesting that the original haplotypic signal had actually captured the effect of the originally untyped best cis eSNP, but this latter was not sufficient to characterize the full association observed at the probe locus. An example is given in Figure 4 with the IREB2 gene. Three common haplotypes were associated with increased IREB2 expression. After adjustment for the best imputed cis eSNP (rs12592111), two of them were no longer associated to expression as a consequence of the strong LD of one of the htSNPs (rs13180) with the best cis eSNP, while the third haplotype remained significant.

For the remaining 21 probes (group D in Table S1), the best cis eSNP was not among the associated htSNPs, and both the haplotypic and the best cis eSNP effects remained significant in the conditional model. Such patterns suggest that the imputation analysis revealed an additional independent signal that was not captured by the haplotype analysis on typed SNPs. An example is given in Figure 5 with the COLEC12 gene. Two haplotypes were significantly associated with increased COLEC12 expression, and these effects were barely modified by adjustment on the best cis eSNP rs11081136 whose effect also persisted in the conditional analysis.

In a final step, we tested whether the haplotype effects were compatible with additive effects of multiple SNPs or whether a more complex pattern could explain the observed haplotypic association. In the vast majority of cases (75 out of 105, 71%) the hypothesis of additive effects of multiple SNPs was not rejected (additive effects of 2 SNPs in 35 cases, 3 SNPs in 28 cases, and 4 SNPs in 12 cases). These situations were generally characterized by the presence of one SNP with a predominant effect on probe expression and additional SNPs with more modest effects. The remaining 30 haplotypic associations (29%) were not compatible with additive effects of typed or imputed SNPs.
For the discovery phase of this study, we had filtered out probes harboring common SNPs in their genomic sequence to avoid spurious associations due to differential binding of the probe to its target sequence. This filtering had been performed using the HapMap 2 SNP database as reference. Since imputation analyses were later conducted using the more recent 1000 Genome reference database which contains rarer SNPs, we checked whether the identified haplotypic associations might not be due to newly reported polymorphisms in the genomic sequence of the 105 probes with multiple cis eSNP effects. In 38 probes, the sequence was still devoid of SNPs. Four probes (ILMN_1683305, ILMN_1722698, ILMN_1741371, ILMN_2285618) were found to harbor an SNP with minor allele frequency (MAF) between 0.02 and 0.06, and for two of them (ILMN_1688305 and ILMN_1741371) this SNP was correctly imputed but not associated with probe expression (p = 0.01 and p = 0.55). For the remaining 63 probes, rare SNPs (MAF<5‰) were identified in the genomic sequences. However, such rare SNPs are unlikely to explain the multiple cis eSNPs associations observed in our study. Indeed, to explain at least 6% of probe variability, the minimum value observed for the 105 probes (Table S1), a SNP with a MAF<1% would have to be associated with an extremely strong genetic effect that would be characterized by outliers values in the probe expression distribution. We did not observe such outliers for any of the probes (Figure S2).
Relevance to human diseases
Among the loci characterized by multiple cis htSNPs associated to probe expression, 24 were reported to be associated with human diseases or quantitative traits in the GWAS catalog [23] (Table S2). Notably, for 4 of these loci, the GWAS hit was among, or in complete LD (r2 = 1) with one of the identified cis htSNPs: C1orf85 (locus for mean corpuscular hemoglobin concentrations [24]), IREB2 (locus for chronic obstructive pulmonary disease [25]), OPTN (locus for Paget's disease) [26]) and TSEN2 (locus for prostate cancer [27]).
A locus of particular relevance is AP3S2 previously reported in a GWAS of type 2 diabetes [28] and associated in our study with cis haplotypes involving the additive effects of 3 SNPs, rs7173483, rs3803536 and rs1269077 (Figure 3 and Table S1). The lead SNP reported in the GWAS, rs2028299, was not among the identified cis htSNPs, although it was associated with AP3S2 expression by single SNP analysis (p = 5.17 10−7 in CTS and p = 4.10 10−17 in GHS). However, when adjusting for the effects of the 3 htSNPs, the rs2028299 was no longer associated with AP3S2 expression (p = 0.986 and p = 0.289, respectively). The cis effect of rs2028299 was actually due to its LD with two haplotypes associated with increased AP3S2 expression levels.
Discussion
It is widely accepted that haplotype analysis built on several SNPs at a given locus presents several strengths: it can identify independent additive SNP effects, distinguish true effects from those due to LD between SNPs, suggest functional interaction between SNPs and identify the effect of untyped SNPs that are tagged by haplotypes. In order to better characterize the genetics of monocyte gene expression, we conducted the first genome-wide search for cis haplotype effects with comprehensive replication in an independent sample. This analysis was performed using two of the largest gene expression datasets available so far, the CTS and GHS resources. The search for cis haplotype effects was conducted using a statistical approach whose efficiency has already been demonstrated in the context of GWAS [19]. This methodology has the advantage of identifying both independent additive effects of cis eSNPs and more complex haplotype effects, whereas only the former can be identified through conditional GWES as recently proposed [11].
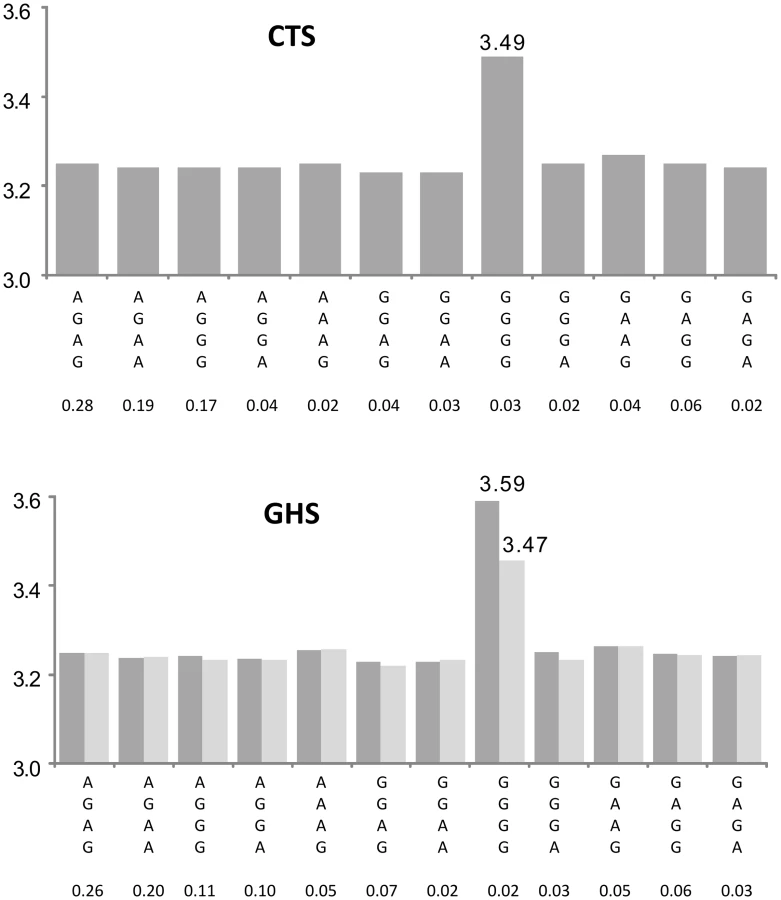
A key aspect of this work is that we did not apply in our discovery phase any correction for multiple testing. Rather, we focused on gene expression where the magnitude of the haplotypic association was much larger than that of the single SNP association and replicated the findings in an independent sample where Bonferroni correction was then applied to the subset of probes selected by the discovery phase. Note that this strategy led to the selection of some haplotypic associations that would not have passed a strict Bonferroni correction at the discovery phase (i.e. a p-value lower than 2.38 10−11). This is the case for example of OPN1SW (Table S1, Figure 6) where the haplotypic p-value was 3.47 10−8 but largely exceeded the p-value of the best cis eSNP (p = 0.0275). Using this 2-step approach, 47% of the haplotypic associations detected in CTS that could be tested for replication in GHS turned out to be significant. This high rate of replication can be explained by the fact only haplotypic associations having a much greater likelihood than single SNP associations were selected, but also by the greater power of the GHS study due to its larger sample size.
Among the 412 probes tested for replication in GHS, 105 (i.e ∼25%) met the Bonferroni-corrected threshold for considering that an eQTL is under the influence of multiple cis eSNPs. About three-quarters of these haplotype associations were shown to be the consequence of independent additive effects of several eSNPs. The last quarter might tag functional combinations of SNPs or rare variants not yet identified in the latest version of the 1000Genomes reference (eg Figure 6). The identified haplotypes do not necessarily imply functionality of the involved htSNPs. Indeed, these htSNPs were initially selected with respect to their tagging property for characterizing the genetic architecture of the mapped loci and not with respect to any possible causal role in gene function. Most of the identified htSNPs involved in cis effects could be replaced by other proxy SNPs (r2>0.90) as illustrated in Table S3. Only experimental works would answer the question of which of these SNPs are functional.
Twenty-four of the replicated probes (∼23%) mapped to loci previously reported to be associated with human traits through GWAS. Although this might reflect a shared biological mechanism in some cases, no general conclusion can be drawn from the observation of a co-localization between a GWAS hit and cis eSNPs contributing to gene expression. A GWAS hit can be one of the eSNPs contributing to gene expression, but not necessarily the one with the strongest cis effect. A GWAs hit can also be “artificially” found associated with gene expression just because of its LD with the cis eSNPs. Recent works have shown that GWAS-associated loci were enriched in cis eSNPs [29], [30] but such an enrichment appears largely dependent on the gene density in the region which favors coincidental associations (personal data). Whatever the causes underlying this enrichment, our study emphasizes the need, before embarking into functional validation experiments, to conduct in-depth haplotype analyses of entire GWAS-associated loci to get a more precise picture of the genetic regulation of gene expression and its possible link with human traits.
Several limitations of this work must be acknowledged. First, for computational reasons, our search for haplotype effects was limited to haplotypic combinations of up to 4 (not necessarily adjacent) SNPs. As shown in Table S1, the expression of 10 probes was found influenced by the contribution of 4 htSNPs plus the best imputed cis eSNP. This suggests that longer haplotypes may exert some cis effects. Second, our strategy was to select for replication probes where the haplotypic p-value was 104 smaller than the single SNP p-value. This stringent threshold was applied to identify probes where haplotypes were likely to be more relevant than single SNP alone for explaining probe expression variability. In setting any threshold for a study one balances the risk of missing genuine loci versus taking a large number of potentially false loci forward into replication. Although we cannot exclude that we missed some true positives, the strategy we applied enabled us to detect and replicate probes where the added contribution of multiple cis effects to single SNP was as low as 1% of the probe expression variability (Table S1). Third, as all investigations were conducted under the assumption of additive effects of haplotypes on expression, haplotypes with dominant or recessive effects may have been missed. Fourth, only genotyped SNPs were used in the discovery stage as CTS had not been imputed at the time of this study. The use of imputed SNPs that could get single association p-values smaller than those of the typed SNPs would have led to less haplotypic signals passing our 104 discovery threshold. Fifth, expression data from the discovery CTS cohort were adjusted for center but no other method controlling for population stratification was applied. However, because the replication study used imputed genotypes and controlled for population stratification, the risk of false positives due to the two last causes is greatly reduced. Conversely, if a lower proportion of false positives had passed the discovery phase, the number of probes selected for replication would have been smaller, resulting in a less stringent Bonferroni threshold and a greater power of the replication study. We cannot then exclude that other probes with multiple cis SNPs influence may have been missed. Lastly, because different genotyping arrays were used in the discovery and replication studies, less than 16% (i.e. 412/2,650) of the effects detected in CTS could be assessed for replication in GHS. Some of these associations that could not be further explored in GHS (∼17% = 387/2,238) map to disease-associated loci (Table S4) and their replication may warrant further efforts. Nevertheless, it is worth reminding that this work was not aimed at cataloguing all functional cis eSNPs influencing monocyte expression but rather at serving as a proof-of-principle demonstrating that gene expression variability could be influenced by the presence of more than one cis-acting SNP.
In conclusion, a comprehensive exploration of cis haplotype effects in monocytes eQTLs demonstrated that the expression of a substantial proportion of genes is associated with several cis eSNPs exerting either additive or more complex interactive effects. Among the genes whose expression was influenced by multiple SNPs, several were reported to be disease-associated loci by GWAS. This work further highlights the need for conducting both haplotype-based and 1000Genomes imputation-based cis eQTL analyses before elaborating functional studies at disease-associated loci. It would also be worthwhile to assess whether the multiple cis eSNPs identified at disease-associated loci could also associate with the disease and could then contribute to the missing heritability raised by the recent waves of GWAS [31], [32].
Materials and Methods
This work was based on two large genome-wide expression and genotype datasets from the Cardiogenics Transcriptomic Study and the Gutenberg Health Study, the latter serving as a replication cohort for the former. For the present work the CTS dataset extensively described in [14], [33], [34] included 363 patients with coronary artery disease or myocardial infarction and 395 healthy individuals. The GHS investigation [9], [34]–[36] was conducted in a population-based sample of 1,374 healthy individuals.
Ethics statement
All individuals were of European descent. They all gave written informed consent. Ethical approval was given by the local ethics committee and by the local and federal data safety commissioners.
The Cardiogenics Transcriptomic Study
Genome-wide expression study
Monocyte were isolated from whole blood using CD14 micro beads (Miltenyi) and lysed in Trizol. RNA was extracted in chloroform and ethanol, washed in RNeasy columns and incubated with DNase I before extracted in RNase-free water. RNA was quantified by the Nanodrop method. Expression profiling was performed using the Illumina HumanRef-8 v3 beadchip array (Illumina Inc., San Diego, CA) containing 24,516 probes corresponding to 18,311 distinct genes and 21,793 Ref Seq annotated transcripts. mRNA was amplified and labelled using the Illumina Total Prep RNA Amplification Kit (Ambion, Inc., Austin, TX). After hybridization, array images were scanned using the Illumina BeadArray Reader and probe intensities were extracted using the Gene expression module (version 3.3.8) of the Illumina BeadStudio software (version 3.1.30). Raw intensities were processed in R statistical environment using the Lumi [37] and beadarray packages. All array outliers were excluded and only arrays with high concordance in terms of gene expression measures (pairwise Spearman correlation coefficients within each cell type >0.85) were included in the analyses.
Genome-wide genotype study
EDTA anticoagulated venous blood samples were collected from all participants. Genomic DNA was extracted from peripheral blood monocytes by standard procedures (Qiagen). Genome-wide genotyping was carried out using two Illumina arrays, the Sentrix Human Custom 1.2M array and the Human 610 Quad Custom array. SNP analysis was restricted to autosomal SNPs with minor allele frequency >0.01, call rate >0.95 and Hardy-Weinberg equilibrium testing p-value>10−5. After quality control, 522,603 SNPs were used for association analyses with expression.
In order to avoid spurious associations due to hybridization difference, the genome-wide analysis of cis haplotype effects was restricted to autosomal probes that were identified by the ReMOAT program [37] as not harboring SNPs (accordingto HapMap 2 SNP database) in their genomic sequence ( n = 19,805 autosomal probes).
The Gutenberg Health Study (GHS)
Genome-wide expression study
Monocytic RNA was isolated from peripheral blood monocytes by negative selection using RosetteSep Monocyte Enrichment Cocktail (StemCell Technologies, Vancouver, Canada), Trizol extraction and purification by silica-based columns. Expression profiling was performed using the Illumina HT-12 v3 BeadChip (Illumina, CA, USA) and generated data were pre-processed using Beadstudio. The Lumi R package [38] was also used for processing expression data.
All probes identified in CTS were available for replication in GHS.
Genome-wide genotype study
For each participant, genomic DNA was extracted from buffycoats prepared from EDTA blood samples. Individuals were typed for genome-wide genotype data using the Affymetrix Genome-Wide Human SNP Array 6.0 (Affymetrix, CA, USA). SNPs with minor allele frequency <0.01, call rate <0.98 and Hardy-Weinberg equilibrium testing p-value<10−4 were excluded from the analysis. 675,350 quality-control checked SNPs were available for analysis in GHS.
Statistical analysis
Discovery phase
In CTS, each probe was assessed for locus-specific haplotype effects using a multi-step approach adapted from a more general genome-wide strategy previously applied to coronary artery disease [19] and Alzeihmer disease [39]:
-
the first step consisted in identifying genotyped SNPs mapping within a 200 kb interval from the start and the end of the probe sequence and eliminating part of the redundancy due to LD by identifying a subset of haplotype tagging SNPs (htSNPs) mapping the probe sequence. For this purpose, a sliding-windows approach was adopted. Within each bin of ten adjacent SNPs, we characterized the haplotypic structure defined by common haplotypes (ie with frequency >0.02) and, from this, we selected a subset of SNPs sufficient to characterize more than 95% of the inferred haplotypes. Haplotype inference was performed by use of the Stochastic-EM algorithm developed for haplotype-based association analysis [40], [41]. This procedure was applied to all consecutive bins of ten SNPs overlapping the probe locus and led to the final selection of a set of htSNPs per probe.
-
for each probe and its associated set of htSNPs of maximum size 187 (see Figure S1), all haplotypic models derived from the combination of 1 to 4 htSNPs, not necessarily adjacent, were tested for association with probe expression. The model that minimizes the scaled Akaike Information Criterion (AIC) [40], [42] was selected as the most informative and parsimonious (“best”) model. The scaled AIC of a haplotypic model was defined as (−2 * log(likelihood(model))+2k) where k is the number of estimated haplotype effects. The likelihood ratio test statistic was then used to assess the significance of this “best” haplotypic model and the corresponding haplotypic p-value was assigned to the probe.
-
for each probe, this haplotypic p-value was then compared to the smallest p-value derived from all single SNP (not only htSNP) association analysis. Probes with haplotypic p-value 104 smaller than the smallest single SNP association p-value were selected for replication in GHS. To increase the sensitivity of the haplotype analysis that can be penalized by the number of degrees of freedom of the haplotype tests, no threshold was applied to the value of the haplotypic p-value per se. In all these analyses that were adjusted for the disease status, a linear model was used to investigate the additive effects of alleles or haplotypes on probe expression. Haplotype analyses were conducted using the GridHaplo software [19] implementing the aforementioned Stochastic-EM algorithm and available at http://genecanvas.ecgene.net. Single SNP association analyses were performed using R environment.
Replication phase
Each probe selected from the discovery phase in CTS as well as the htSNPs defining the best associated haplotypic configuration were checked for availability in GHS. If a given htSNP was not genotyped in GHS, we sought whether we could find a genotyped proxy SNP (r2>0.80) using the SNAP software [18]. Replication in GHS of the haplotypic signals observed in CTS was assessed using the THESIAS software [21] implementing the same statistical haplotype model as in the GridHaplo program. THESIAS was used to further check whether the haplotype effects were consistent (i.e. the same haplotypes associated with the same direction of effects on probe expression) across the two studied samples. Probes with haplotypic p-value significant after Bonferroni correction and consistent effects were considered as replicated.
To assess whether the replicated haplotype effects could reflect the effects of single SNPs either untyped or typed in GHS but not in CTS, further imputation analyses were conducted in GHS. Imputation of 15,865,541 bi-allelic polymorphic SNPs was conducted by the minimac software (release 2012-03-14) using the 1000G Phase I Integrated Release Version 2 Haplotypes reference panel. Of these imputed SNPs, 10,210,859 SNPs were inferred with good imputation quality (r2>0.3). SNPs located within 200 kb distance from a replicated probe sequence were then tested for association with its corresponding probe expression using a linear regression analysis in which allele dosage (continuous from 0 to 2 copies of the minor allele) of imputed SNPs was used as implemented in the mach2qtl software [22] (http://www.sph.umich.edu/csg/abecasis/MACH/download/). Conditional analyses were then conducted where haplotype effects were further adjusted for the SNP demonstrating the strongest single locus association p-value, ie. the best cis eSNP. Probes with conditional haplotypic p-value still significant after Bonferroni correction were considered to be under the genetic influence of multiple SNPs
In a final step, we tested whether the multiple cis eSNP effects were compatible with the additive effects of multiple SNPs by setting appropriate constraints on regression coefficients associated with haplotypes using nested likelihood ratio test statistics as implemented in THESIAS. In few instances, conditional haplotype analyses on the second best imputed cis eSNP were also performed.
Because negative selection was used to isolate monocytes in GHS, it cannot be ruled out that contamination by non-monocyte cells might influence gene expression variability. As a consequence, all statistical analyses performed in GHS were adjusted for surrogate variables controlling for cell purity as previously described [34]. Analyses were also adjusted for the first five principal components calculated from the GWAS dataset by use of the Eigenstrat program [43] in order to correct for uncontrolled population stratification.
Supporting Information
Zdroje
1. CooksonW, LiangL, AbecasisG, MoffattM, LathropM (2009) Mapping complex disease traits with global gene expression. Nat Rev Genet 10 : 184–194.
2. LiJ, BurmeisterM (2005) Genetical genomics: combining genetics with gene expression analysis. Hum Mol Genet 14 Spec No. 2: R163–169.
3. MontgomerySB, DermitzakisET (2009) The resolution of the genetics of gene expression. Hum Mol Genet 18: R211–215.
4. GoringHH, CurranJE, JohnsonMP, DyerTD, CharlesworthJ, et al. (2007) Discovery of expression QTLs using large-scale transcriptional profiling in human lymphocytes. Nat Genet 39 : 1208–1216.
5. DixonAL, LiangL, MoffattMF, ChenW, HeathS, et al. (2007) A genome-wide association study of global gene expression. Nat Genet 39 : 1202–1207.
6. StrangerBE, NicaAC, ForrestMS, DimasA, BirdCP, et al. (2007) Population genomics of human gene expression. Nat Genet 39 : 1217–1224.
7. EmilssonV, ThorleifssonG, ZhangB, LeonardsonAS, ZinkF, et al. (2008) Genetics of gene expression and its effect on disease. Nature 452 : 423–428.
8. SchadtEE, MolonyC, ChudinE, HaoK, YangX, et al. (2008) Mapping the genetic architecture of gene expression in human liver. PLoS Biol 6: e107 doi:10.1371/journal.pbio.0060107.
9. ZellerT, WildP, SzymczakS, RotivalM, SchillertA, et al. (2010) Genetics and beyond–the transcriptome of human monocytes and disease susceptibility. PLoS ONE 5: e10693 doi:10.1371/journal.pone.0010693.
10. JansenRC, NapJP (2001) Genetical genomics: the added value from segregation. Trends Genet 17 : 388–391.
11. MurphyA, ChuJH, XuM, CareyVJ, LazarusR, et al. (2010) Mapping of numerous disease-associated expression polymorphisms in primary peripheral blood CD4+ lymphocytes. Hum Mol Genet 19 : 4745–4757.
12. NicaAC, DermitzakisET (2008) Using gene expression to investigate the genetic basis of complex disorders. Hum Mol Genet 17: R129–134.
13. MoffattMF, KabeschM, LiangL, DixonAL, StrachanD, et al. (2007) Genetic variants regulating ORMDL3 expression contribute to the risk of childhood asthma. Nature 448 : 470–473.
14. HeinigM, PetrettoE, WallaceC, BottoloL, RotivalM, et al. (2010) A trans-acting locus regulates an anti-viral expression network and type 1 diabetes risk. Nature 467 : 460–464.
15. BuilA, TregouetDA, SoutoJC, SautN, GermainM, et al. (2010) C4BPB/C4BPA is a new susceptibility locus for venous thrombosis with unknown protein S-independent mechanism: results from genome-wide association and gene expression analyses followed by case-control studies. Blood 115 : 4644–4650.
16. FrereC, TregouetDA, MorangePE, SautN, KouassiD, et al. (2006) Fine mapping of quantitative trait nucleotides underlying thrombin-activatable fibrinolysis inhibitor antigen levels by a transethnic study. Blood 108 : 1562–1568.
17. BodinL, VerstuyftC, TregouetDA, RobertA, DubertL, et al. (2005) Cytochrome P450 2C9 (CYP2C9) and vitamin K epoxide reductase (VKORC1) genotypes as determinants of acenocoumarol sensitivity. Blood 106 : 135–140.
18. JohnsonAD, HandsakerRE, PulitSL, NizzariMM, O'DonnellCJ, et al. (2008) SNAP: a web-based tool for identification and annotation of proxy SNPs using HapMap. Bioinformatics 24 : 2938–2939.
19. TregouetDA, KonigIR, ErdmannJ, MunteanuA, BraundPS, et al. (2009) Genome-wide haplotype association study identifies the SLC22A3-LPAL2-LPA gene cluster as a risk locus for coronary artery disease. Nat Genet 41 : 283–285.
20. GagliardiF, JonesB, GreyF, BeginME, HeikkurinenM (2005) Building an infrastructure for scientific Grid computing: status and goals of the EGEE project. Philos Transact A Math Phys Eng Sci 363 : 1729–1742.
21. TregouetDA, GarelleV (2007) A new JAVA interface implementation of THESIAS: testing haplotype effects in association studies. Bioinformatics 23 : 1038–1039.
22. LiY, WillerCJ, DingJ, ScheetP, AbecasisGR (2010) MaCH: using sequence and genotype data to estimate haplotypes and unobserved genotypes. Genet Epidemiol 34 : 816–834.
23. HindorffLA, SethupathyP, JunkinsHA, RamosEM, MehtaJP, et al. (2009) Potential etiologic and functional implications of genome-wide association loci for human diseases and traits. Proc Natl Acad Sci U S A 106 : 9362–9367.
24. KamataniY, MatsudaK, OkadaY, KuboM, HosonoN, et al. (2010) Genome-wide association study of hematological and biochemical traits in a Japanese population. Nat Genet 42 : 210–215.
25. ChoMH, BoutaouiN, KlandermanBJ, SylviaJS, ZinitiJP, et al. (2010) Variants in FAM13A are associated with chronic obstructive pulmonary disease. Nat Genet 42 : 200–202.
26. AlbaghaOM, WaniSE, ViscontiMR, AlonsoN, GoodmanK, et al. (2011) Genome-wide association identifies three new susceptibility loci for Paget's disease of bone. Nat Genet 43 : 685–689.
27. TaoS, WangZ, FengJ, HsuFC, JinG, et al. (2012) A genome-wide search for loci interacting with known prostate cancer risk-associated genetic variants. Carcinogenesis 33 : 598–603.
28. KoonerJS, SaleheenD, SimX, SehmiJ, ZhangW, et al. (2011) Genome-wide association study in individuals of South Asian ancestry identifies six new type 2 diabetes susceptibility loci. Nat Genet 43 : 984–989.
29. NicaAC, MontgomerySB, DimasAS, StrangerBE, BeazleyC, et al. (2010) Candidate causal regulatory effects by integration of expression QTLs with complex trait genetic associations. PLoS Genet 6: e1000895 doi:10.1371/journal.pgen.1000895.
30. NicolaeDL, GamazonE, ZhangW, DuanS, DolanME, et al. (2010) Trait-associated SNPs are more likely to be eQTLs: annotation to enhance discovery from GWAS. PLoS Genet 6: e1000888 doi:10.1371/journal.pgen.1000888.
31. ManolioTA, CollinsFS, CoxNJ, GoldsteinDB, HindorffLA, et al. (2009) Finding the missing heritability of complex diseases. Nature 461 : 747–753.
32. EichlerEE, FlintJ, GibsonG, KongA, LealSM, et al. (2011) Missing heritability and strategies for finding the underlying causes of complex disease. Nat Rev Genet 11 : 446–450.
33. ShahS, NelsonCP, GauntTR, van der HarstP, BarnesT, et al. (2011) Four Genetic Loci Influencing Electrocardiographic Indices of Left Ventricular Hypertrophy. Circ Cardiovasc Genet
34. RotivalM, ZellerT, WildPS, MaoucheS, SzymczakS, et al. (2011) Integrating genome-wide genetic variations and monocyte expression data reveals trans-regulated gene modules in humans. PLoS Genet 7: e1002367 doi:10.1371/journal.pgen.1002367.
35. CastagneR, RotivalM, ZellerT, WildPS, TruongV, et al. (2011) The choice of the filtering method in microarrays affects the inference regarding dosage compensation of the active X-chromosome. PLoS ONE 6: e23956 doi:10.1371/journal.pone.0023956.
36. CastagneR, ZellerT, RotivalM, SzymczakS, TruongV, et al. (2011) Influence of sex and genetic variability on expression of X-linked genes in human monocytes. Genomics 98 : 320–326.
37. Barbosa-MoraisNL, DunningMJ, SamarajiwaSA, DarotJF, RitchieME, et al. (2010) A re-annotation pipeline for Illumina BeadArrays: improving the interpretation of gene expression data. Nucleic Acids Res 38: e17.
38. DuP, KibbeWA, LinSM (2008) lumi: a pipeline for processing Illumina microarray. Bioinformatics 24 : 1547–1548.
39. LambertJC, Grenier-BoleyB, HaroldD, ZelenikaD, ChourakiV, et al. (2012) Genome-wide haplotype association study identifies the FRMD4A gene as a risk locus for Alzheimer's disease. Mol Psychiatry [Epub ahead of print]
40. TregouetDA, RicardS, NicaudV, ArnouldI, SoubigouS, et al. (2004) In-depth haplotype analysis of ABCA1 gene polymorphisms in relation to plasma ApoA1 levels and myocardial infarction. Arterioscler Thromb Vasc Biol 24 : 775–781.
41. TregouetDA, EscolanoS, TiretL, MalletA, GolmardJL (2004) A new algorithm for haplotype-based association analysis: the Stochastic-EM algorithm. Ann Hum Genet 68 : 165–177.
42. MorangePE, SautN, AlessiMC, YudkinJS, MargaglioneM, et al. (2007) Association of plasminogen activator inhibitor (PAI)-1 (SERPINE1) SNPs with myocardial infarction, plasma PAI-1, and metabolic parameters: the HIFMECH study. Arterioscler Thromb Vasc Biol 27 : 2250–2257.
43. PriceAL, PattersonNJ, PlengeRM, WeinblattME, ShadickNA, et al. (2006) Principal components analysis corrects for stratification in genome-wide association studies. Nat Genet 38 : 904–909.
Štítky
Genetika Reprodukční medicínaČlánek vyšel v časopise
PLOS Genetics
2013 Číslo 1
Nejčtenější v tomto čísle
- Function and Regulation of , a Gene Implicated in Autism and Human Evolution
- An Insertion in 5′ Flanking Region of Causes Blue Eggshell in the Chicken
- Comprehensive Methylome Characterization of and at Single-Base Resolution
- Susceptibility Loci Associated with Specific and Shared Subtypes of Lymphoid Malignancies