
A Genome-Wide Integrative Genomic Study Localizes Genetic Factors Influencing Antibodies against Epstein-Barr Virus Nuclear Antigen 1 (EBNA-1)
Infection with Epstein-Barr virus (EBV) is highly prevalent worldwide, and it has been associated with infectious mononucleosis and severe diseases including Burkitt lymphoma, Hodgkin lymphoma, nasopharyngeal lymphoma, and lymphoproliferative disorders. Although EBV has been the focus of extensive research, much still remains unknown concerning what makes some individuals more sensitive to infection and to adverse outcomes as a result of infection. Here we use an integrative genomics approach in order to localize genetic factors influencing levels of Epstein Barr virus (EBV) nuclear antigen-1 (EBNA-1) IgG antibodies, as a measure of history of infection with this pathogen, in large Mexican American families. Genome-wide evidence of both significant linkage and association was obtained on chromosome 6 in the human leukocyte antigen (HLA) region and replicated in an independent Mexican American sample of large families (minimum p-value in combined analysis of both datasets is 1.4×10⁻¹⁵ for SNPs rs477515 and rs2516049). Conditional association analyses indicate the presence of at least two separate loci within MHC class II, and along with lymphocyte expression data suggest genes HLA-DRB1 and HLA-DQB1 as the best candidates. The association signals are specific to EBV and are not found with IgG antibodies to 12 other pathogens examined, and therefore do not simply reveal a general HLA effect. We investigated whether SNPs significantly associated with diseases in which EBV is known or suspected to play a role (namely nasopharyngeal lymphoma, Hodgkin lymphoma, systemic lupus erythematosus, and multiple sclerosis) also show evidence of associated with EBNA-1 antibody levels, finding an overlap only for the HLA locus, but none elsewhere in the genome. The significance of this work is that a major locus related to EBV infection has been identified, which may ultimately reveal the underlying mechanisms by which the immune system regulates infection with this pathogen.
Published in the journal:
. PLoS Genet 9(1): e32767. doi:10.1371/journal.pgen.1003147
Category:
Research Article
doi:
https://doi.org/10.1371/journal.pgen.1003147
Summary
Infection with Epstein-Barr virus (EBV) is highly prevalent worldwide, and it has been associated with infectious mononucleosis and severe diseases including Burkitt lymphoma, Hodgkin lymphoma, nasopharyngeal lymphoma, and lymphoproliferative disorders. Although EBV has been the focus of extensive research, much still remains unknown concerning what makes some individuals more sensitive to infection and to adverse outcomes as a result of infection. Here we use an integrative genomics approach in order to localize genetic factors influencing levels of Epstein Barr virus (EBV) nuclear antigen-1 (EBNA-1) IgG antibodies, as a measure of history of infection with this pathogen, in large Mexican American families. Genome-wide evidence of both significant linkage and association was obtained on chromosome 6 in the human leukocyte antigen (HLA) region and replicated in an independent Mexican American sample of large families (minimum p-value in combined analysis of both datasets is 1.4×10⁻¹⁵ for SNPs rs477515 and rs2516049). Conditional association analyses indicate the presence of at least two separate loci within MHC class II, and along with lymphocyte expression data suggest genes HLA-DRB1 and HLA-DQB1 as the best candidates. The association signals are specific to EBV and are not found with IgG antibodies to 12 other pathogens examined, and therefore do not simply reveal a general HLA effect. We investigated whether SNPs significantly associated with diseases in which EBV is known or suspected to play a role (namely nasopharyngeal lymphoma, Hodgkin lymphoma, systemic lupus erythematosus, and multiple sclerosis) also show evidence of associated with EBNA-1 antibody levels, finding an overlap only for the HLA locus, but none elsewhere in the genome. The significance of this work is that a major locus related to EBV infection has been identified, which may ultimately reveal the underlying mechanisms by which the immune system regulates infection with this pathogen.
Introduction
Epstein-Barr virus (EBV) belongs to the herpes virus family, which consists of double-stranded DNA viruses, composed of a DNA core surrounded by a nucleocapsid and a tegument, with relatively large genomes (100–200 genes). There are currently eight known human herpesviruses, which include herpes simplex virus type I, herpes simplex virus type II, varicella-zoster virus, EBV, cytomegalovirus, human herpesvirus 6, human herpesvirus 7, and Kaposi sarcoma herpesvirus. Infection with EBV is common, with over 90% of the world's adult population estimated to be infected [1]. EBV is thought to be typically transmitted through contact with saliva, infecting B lymphocytes and epithelial cells of the oropharynx [2]. The virus is shed consistently into saliva during primary infection, but intermittent shedding can continue for years afterwards. Following initial infection, EBV establishes a dormant, lifelong infection (mainly in memory B cells) and retains the potential to reactivate [3], [4]. In developing countries primary EBV infection usually occurs during infancy or early childhood, and is typically without clinical symptoms or presents as a mild febrile illness. In more affluent countries infection in childhood is still common, but for approximately one third of individuals primary infection occurs during adolescence or early adulthood and is associated with a higher risk of infectious mononucleosis [5]. EBV infection has also been associated with some malignant conditions including Burkitt lymphoma, nasopharyngeal carcinoma, some gastric cancers, and Hodgkin lymphoma [6]–[11].
EBV has been studied extensively. It was the first human tumor virus identified, and its viral genome was the first to be fully described [12]–[13]. While genetic risk factors have been reported for particular EBV-infected subpopulations (e.g., individuals with Hodgkin lymphoma, infectious mononucleosis, and multiple sclerosis [14]–[19]), there is still much that remains unknown about inter-individual differences in antibody response to EBV exposure and potential adverse outcomes related to infection with this pathogen. Here we have quantified antibody titer to the Epstein-Barr virus nuclear antigen 1 (anti-EBNA-1), which reflects history of infection with this pathogen, in a randomly ascertained sample (i.e., one that is not enriched for a particular phenotype) of Mexican Americans and used genome-wide linkage and association analyses and expression profiling on lymphocytes to identify underlying genetic loci.
Results
Seroprevalence
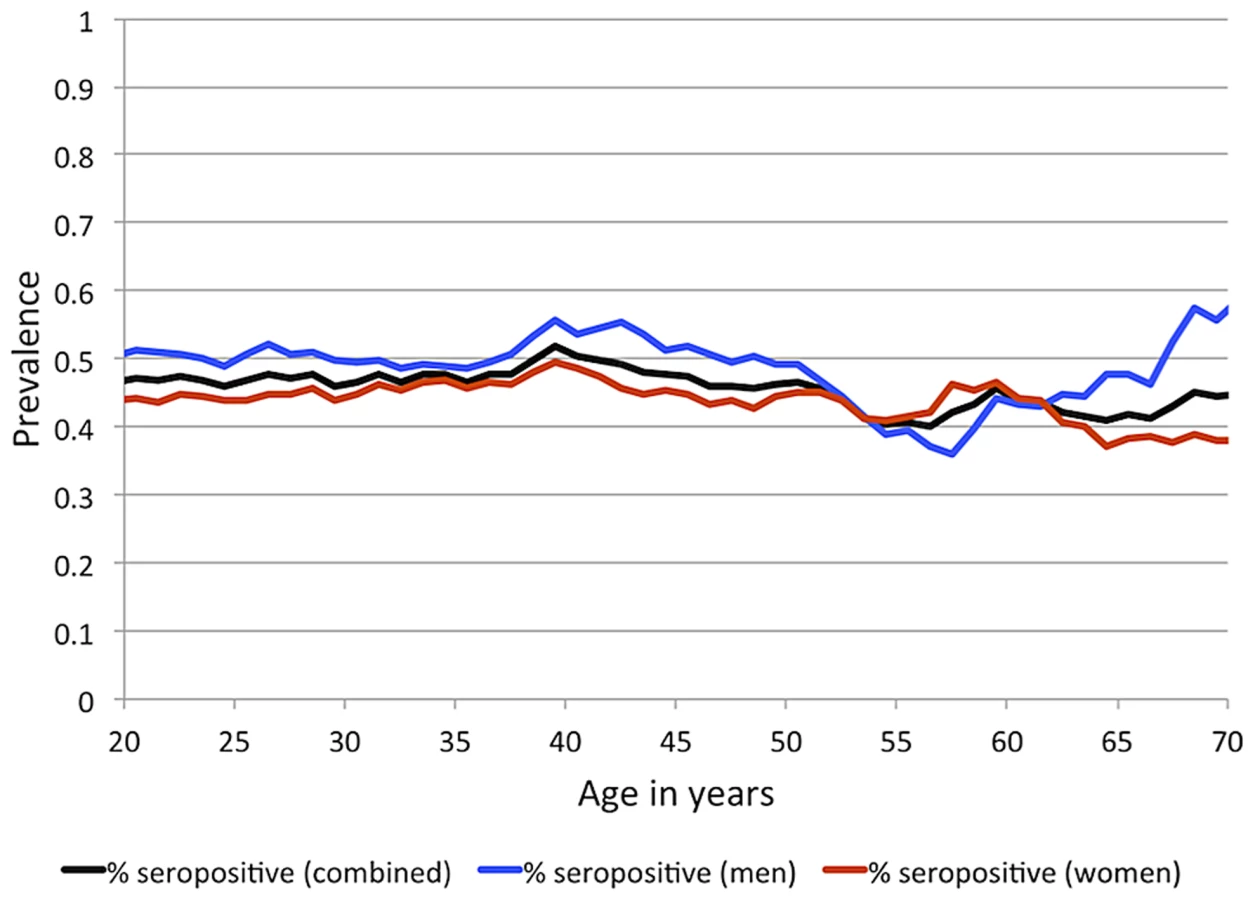
IgG antibodies to EBNA-1 were quantified in plasma samples from 1,367 randomly ascertained and naturally infected Mexican American participants of the San Antonio Family Heart Study (SAFHS), which represent 63 families, many of which are large genealogies (Table S1). While seropositivity to infection with EBV is sometimes measured using IgG antibodies against the viral capsid antigen (VCA), here we refer to EBV seropositivity as based on measurement of anti-EBNA-1 antibodies, which are produced during latent EBV infection. In this study, 48% of individuals are categorized as seropositive for anti-EBNA-1 antibodies, 24% have intermediate (seroindeterminate) levels, and 28% are seronegative. EBNA-1 seroprevalence is similar in men and women and does not change substantially with age within the examined age range of 16–94 years (Figure 1), indicating that most subjects underwent primary infection before adulthood. Given the prevalence of EBV infection and mode of transmission, we assume that essentially all individuals have been exposed to this pathogen multiple times during their lifetime, and therefore seronegative status should be informative in that those individuals failed to mount an antibody-mediated immune response to EBNA-1 (or mounted only a response so weak as to lead to undetectable antibody levels).
Heritability analysis
While the measured antibody assay generates a quantitative read-out of antibody levels, conceptually the antibody-mediated immune response may be viewed as a yes/no trait, in which the immune system did or did not mount an antibody response after exposure, and thus it may also be justifiable to discretize the assay results. We have performed all analyses presented below on both the quantitative antibody phenotype and the dichotomized serostatus phenotype. For clarity, in the text we pay more attention to the results with the quantitative phenotype. In addition, we view the quantitative trait as more informative and the statistical results to be more reliable, partly because the cut-off levels for discretization are somewhat arbitrary. However, the results for both traits are presented in the Figures and Tables, and the findings are highly consistent with one another.
Heritability rates of EBNA-1 serological phenotypes were estimated using a variance components approach, and shared environment was accounted for by using a “household” random effects model [20]. EBNA-1 serological measures are significantly heritable, at 43% (p≪10−9) and 68% (p≪10−9) for the quantitative antibody titer and discrete serostatus traits, respectively (Table 1), indicating that host-genetic factors are important determinants of immune response (as we have previously found to be the case for other pathogens [21]). However, household effects, which are one measure of shared environmental exposures and which were based on reported co-habitation at the time of blood draw for serological assaying, are not significant in this sample. Given the high prevalence of this pathogen, this observation may indicate that an individual is just as likely to be infected by someone who does not share the same residence as they are by someone who does.

Linkage and association analyses
To localize any underlying genetic factors, we performed a variety of genome-wide analyses using nearly 1 million available SNPs. The SAFHS consists of extended families that provide information on linkage as well as association. We therefore performed joint analysis of linkage and association, thereby using both information sources available in families in order to localize the responsible loci. After Bonferroni correction for the number of SNPs analyzed, multiple genome-wide significant SNPs (most significant p-values of 3.3×10⁻⁹ and 8.3×10⁻¹¹ for the quantitative and dichotomous serological trait, respectively) were found in the human leukocyte antigen (HLA) region on chromosome 6 (Figure 2, Table S2). The HLA region is also implicated by linkage analysis itself, with maximum LOD scores of 1.27 and 3.05 for the quantitative and discrete trait, respectively (Figure S1). No genome-wide significant evidence of linkage and/or association was found elsewhere in the genome.

Having identified the HLA region as a major locus, we performed association analysis conditional on linkage, in order to separate out the association signal from individual SNPs (see Methods section for more detail). The most significant association p-value for the quantitative trait occurs with SNPs rs477515 and rs2516049 (p = 1.4×10⁻⁸) (Table 2), two SNPs that are in complete linkage disequilibrium (LD) with each other and are located within the HLA-DRB1 gene in the HLA class II region. The most significant result for the discrete trait is for SNP rs9268832 in HLA-DRB9 (p = 2.2×10⁻⁹). In all, 5 and 19 SNPs reach genome-wide significance for the quantitative and discrete EBNA-1 traits, respectively, and all are located in the HLA region of chromosome 6. As shown by the quantile-quantile plot, the HLA region accounts for the entirety of the deviation from the diagonal line of expected p-values under the null hypothesis, and there was no evidence of any inflation in p-values once the HLA region was excluded from the plot (Figure S2).

Replication
To confirm our findings, we generated anti-EBNA-1 antibody measurements (using the same assay) in plasma samples from 589 participants (representing 39, mainly extended families [Table S1]) in a separate Mexican American family cohort from San Antonio, the San Antonio Family Diabetes/Gall Bladder Study (SAFDGS) [22]. EBNA-1 seroprevalence in this cohort was estimated to be somewhat higher at 85%. Heritability estimates are 37% (p = 1.0×10⁻⁶) and 42% (p = 1.9×10⁻³) for the quantitative and discrete traits, respectively, nearly identical to the prior estimates from the SAFHS. Linkage analysis yielded LOD scores of 3.37 and 2.22 in the HLA region on chromosome 6 for the quantitative and dichotomous traits, respectively (Figure S3). Also, genome-wide joint linkage and association analysis points to significant results only for chromosome 6, and not elsewhere in the genome (Figure S4). We then performed association analysis conditional on linkage of all SNPs from the extended HLA region, and after Bonferroni correction for the number of SNPs analyzed we obtained significant evidence of association with the same two SNPs (rs477515/rs2516049) (most significant p-values of 4.1×10⁻⁶ and 8.8×10⁻⁷ for the quantitative and discrete traits, respectively) (Table 2).
Given the unambiguous replication of the HLA locus, including evidence of linkage and association in the extended HLA region in both datasets, we also performed joint analysis of both pedigree cohorts (SAFHS+SAFDGS) using all available SNPs in the extended HLA region, in order to use all available information for identification and prioritization of the most candidate SNPs within this region. The minimum p-values for association analysis conditional on linkage for the combined dataset were even more significant and occurred at the very SNPs that gave the most significant results for each dataset alone (p = 3.1×10⁻¹³ and p = 3.9×10⁻¹² for SNPs rs477515/rs2516049 for the quantitative and discrete traits, respectively) (Figure 3, Table 2).

Conditional association analyses
The HLA region is highly complex and exhibits considerable and long-range LD. In order to determine whether a single or multiple haplotype block harbors genetic variants influencing the serological EBNA-1 phenotypes, we performed several rounds of conditional association analysis within the extended HLA region using the combined sample of both studies. We first conditioned on the most significant SNP for the quantitative trait (rs477515/rs2516049) and identified one additional significant SNP (rs2854275, located within the HLA-DQB1 gene in the MHC class II region) that was independently associated with EBNA-1 at a genome-wide level of significance (Table 3, Figure S5). After conditioning on both independent SNPs (rs477515/rs2516049 and rs2854275), no additional SNPs were significant for the quantitative antibody trait. This suggests that at least two haplotype blocks harbor variants influencing EBNA-1 seroreactivity. The pattern of LD among SNPs giving genome-wide significant association evidence with either EBNA-1 quantitative or dichotomous EBNA-1 trait is shown in Figure S6.

Expression profile analysis
In order to pinpoint the most likely gene(s) influencing anti-EBNA-1 antibodies, we used an integrative genomics approach based on available expression profiles from 1,243 peripheral blood mononuclear cell (PBMC) samples (collected at the same point in time as the plasma samples used for antibody assays) from SAFHS study participants. Specifically, we examined whether the SNPs that are significantly associated with anti-EBNA-1 antibody status are also significantly associated with expression levels of any nearby gene transcripts (which would suggest that such SNPs are putative cis-regulatory variants of these transcripts), and whether those transcript levels in turn are significantly associated with antibody status.
Using the 41 SNPs that were significantly associated with EBNA-1 seroreactivity in the combined SAFHS+SAFDGS sample (with either the quantitative and/or discrete trait, and in the initial and/or subsequent association analysis, i.e. the SNPs included in Table 2 and Table 3), we conducted association analyses on the 150 expressed transcripts from the extended HLA region, yielding 6,750 SNP-transcript pairs. After Bonferroni correction, we observed significant association results (conditional on linkage) for four SNP-transcript pairs (Table S3). SNPs rs204999 and rs10947261 are significantly associated with expression of the housekeeping gene RPS18 (p = 4.8×10⁻⁵ and p = 3.0×10⁻⁴, respectively), and SNPs rs9273327 and rs2854275 are significantly associated with PBX2 expression. PBX2 is a gene involved in B-cell and certain T-cell leukemias. Our results indicate that that these SNPs (or variants in LD with them) may be putative cis-acting regulators of these genes. However, the evidence of association is only of moderate strength for any SNP-transcript pair (the p-values are significant after Bonferroni correction for the number of transcripts analyzed within the extended HLA region, but not if one were to impose a genome-wide multiple testing correction). In addition, the distance between SNPs and probes is fairly large compared to commonly observed, strong cis-acting expression nucleotides. Other SNP-transcript pairs yielded suggestive, but not statistically significant, results after correction for multiple testing.
We subsequently looked at whether any HLA transcripts were significantly correlated with EBNA-1 seroreactivity. However, the expression levels of RPS18 and PBX2, which we had found to be potentially cis-regulated by SNPs associated with EBNA-1 antibody phenotypes, were not significantly correlated with the EBNA-1 traits (p = 0.17 and p = 0.82, for RPS18 and PBX2 respectively, for the quantitative trait). Among the other HLA transcripts, the expression level of HLA-DRB1 is most significantly associated with both anti-EBNA-1 traits (quantitative: p = 2.8×10⁻⁵; discrete: p = 3.0×10⁻⁴) (Table S4). Thus, in conclusion, while our integrative genomic analyses point to potential candidate genes, the evidence obtained does not yield overwhelming support for a particular candidate gene. A potential explanation may be the fact that the relevant differences in HLA function are attributable to alteration in protein sequence or binding affinity rather than gene expression level.
Examination of other pathogens
As the HLA region is well known to play a role in many aspects of the immune system, it may not be surprising that genetic variants therein appear to influence anti-EBNA-1 antibody levels. To examine whether the identified locus is specific to EBNA-1, or whether it plays a role in determining antibody titers more generally, we assessed whether the EBNA-1-associated SNPs are also significantly associated with antibodies directed at other herpesviruses or other pathogens. IgG antibody titers had previously been measured on the same plasma samples [23] for 12 other pathogens, including 5 herpesviruses. We focused on the top two independent SNPs associated with the quantitative EBV antibody titer in the SAFHS, and found no evidence of association of SNPs rs477515/rs2516049 or rs2854275 with any of these other pathogens, suggesting that the identified loci are specific to EBV (Table 4) and not some general IgG HLA control mechanism.

Relationship to EBV–related cancer
Several types of cancer have been linked to infection with EBV, we therefore looked for evidence of genetic overlap between anti-EBNA-1 antibody traits and published susceptibility loci for two common EBV-related cancers, nasopharyngeal carcinoma (NPC) and Hodgkin lymphoma (HL). A comparison with Burkitt lymphoma was not made, however, as genetic association loci were not available in the published literature. The results for association analysis (conditional on linkage) for EBNA-1 quantitative and discrete traits for NPC-related SNPs are presented in Table 5, and Table 6 presents the results for HL-related SNPs. Two NPC SNPs, rs2860580 and rs28421666, were significantly associated with the EBNA-1 traits, after applying a Bonferroni correction to account for testing 23 SNPs. Both SNPs are located on chromosome 6, in HLA class I and II regions, respectively. Similarly, four HL SNPs that were found to be significantly associated with EBNA-1 trait (rs204000, rs9268542, rs2395185, and rs2858870) were also located in the HLA region. EBNA-1 traits were not significantly associated with cancer-related SNPs that are located outside the HLA region.


Relationship to autoimmune diseases
Because EBV infection has been associated with certain autoimmune diseases, in particular systemic lupus erythematosus (SLE) and multiple sclerosis (MS), we examined whether there is evidence for overlap of genetic factors influencing these traits and anti-EBNA-1 antibody traits by investigating whether any of the previously reported SNPs significantly associated with these disorders also show association with EBNA-1 antibody traits. Table 7 provides the results of the association analysis (conditional on linkage) for EBNA-1 quantitative and discrete traits with SLE-associated SNPs taken from the literature, and Table 8 focuses on SNPs associated with MS. After applying a Bonferroni correction for examining 47 SLE-relevant SNPs, rs9268832 and rs9271366 were significantly associated with both EBNA-1 serological traits, and rs3135391 with the discrete EBNA-1 trait. Notably, all three of these SNPs are located in the HLA region on chromosome 6. None of the 41 SLE-associated SNPs outside of the HLA region show any evidence of association to EBNA-1. A comparison with 30 genome-wide significant MS SNPs from published reports yielded similar results, with statistically significant association results, for both EBNA-1 traits with SNP rs9271366, and also for the discrete EBNA-1 serostatus trait with SNPs rs3129860 and rs3135388, all of which are located within the HLA region (Table 8). As with SLE, there was no evidence for association of EBNA-1 with MS-associated SNPs from anywhere else in the genome.


Discussion
In this study, we estimated the seroprevalence rate of EBV infection as 48% seropositive in the study population of 1,367 Mexican American participants from the SAFHS. Our estimate is lower than estimates of EBV prevalence for other adult populations [24], but this study characterized anti-EBNA-1 antibody titers, while many other estimates are based on measurements of IgG antibodies against EBV VCA. Typically, anti-VCA antibody titers will give a slightly higher estimate, as some anti-VCA positive individuals will subsequently fail to also make anti-EBNA-1 antibodies [25]. In addition, there may be other variations between assays and their cutoff values. When we include the indeterminate samples as seropositive in our analysis, the estimate increases to 70% EBV seropositivity, which is close to estimates for the U.S. general adult population of 73% to 90% [26]. In the replication study (SAFDGS), the same assay yielded a higher seroprevalence estimate (85%). The reason for this difference is unclear, but may be related to simple threshold effects that magnify differences between assays being run at two separate points in time when dichotomizing quantitative assay read-outs. A comparison of our heritability estimates for anti-EBNA-1 antibody titers (h2 = 0.43 for the SAFHS, and h2 = 0.37 for the SAFDGS) with estimates for anti-VCA antibody titers (h2 = 0.32–0.48 [27]) shows that they fall within the same range.
Our study identified multiple, significant associations of anti - EBNA-1 antibody measures with genetic factors located in the HLA region, which contains genes related to immune function in humans. These associations were not found for seroreactivity to 12 other pathogens examined in this study, and therefore appear to be specific to EBNA-1. HLA class I genes are involved in the presentation of peptides (including viral antigens) from within the cell, which attract CD8+ T lymphocytes (cytotoxic T cells) to destroy cells presenting foreign antigens. Previous research identified genetic loci within this region that were associated with the development of infectious mononucleosis upon primary infection with EBV, suggesting that HLA class I polymorphisms influence T cell response during primary EBV infection and viral persistence [17]. The HLA class I region has also been implicated in the development of classical Hodgkin lymphoma among EBV-positive individuals [14]–[16]. HLA class II genes are involved in presenting peptides from outside the cell to CD4+ T lymphocytes (helper T cells), which in turn stimulate B cells to produce antibodies. In our study, genes significantly associated with anti-EBNA-1 antibody levels belong to HLA class II. This supports earlier reports of an association between HLA class II and EBV susceptibility among individuals with multiple sclerosis [17]–[19].
EBV primarily targets resting B cell lymphocytes, which are induced to proliferate, and also infects epithelial cells of the nasopharynx and oropharynx. EBV infects B lymphocytes via attachment to the target cell by binding of the viral major envelope glycoprotein gp350 to complement receptor type two, CD21, on the cell surface [28]. Subsequent penetration of the cell membrane requires a complex of three glycoproteins: gH and gL, which have functional homologs in other herpesviruses; and gp42, which is EBV-specific. Glycoprotein gp42 binds to HLA-DR on the host cell, and in this way HLA class II molecules serve as cofactors for EBV infection of B cells [29]. In our study, we demonstrate a significant association between EBV serostatus and SNP rs477515/rs2516049, which is located in gene HLA-DRB1 within the HLA-DR gene cluster, and the expression level of HLA-DRB1 is also significantly correlated with both EBNA-1 serological traits, though we did not observe evidence indicating that the particular EBNA-1-associated SNPs are likely cis-acting regulators of this gene. Nearby genes HLA-DRA and HLA-DRB9 do appear to be associated with significant EBNA-1 SNPs, but their expression levels are not significantly correlated with the examined antibody traits. Nonetheless, based on our results, these genes appear to be the best candidates for playing a role in EBV susceptibility in the study population. This may be related to viral penetration of B cells, but it is more likely due to specific haplotype and T cell recognition, as HLA class II genes are also involved in the presentation of viral antigens to T cells, which is important in suppressing proliferation of EBV-infected B cells. HLA-DR is a class II cell surface receptor that serves as a ligand for the T cell receptor. The primary function of HLA-DR is the presentation of peptide antigens to the immune system, and it is closely linked to HLA-DQ, another molecule that presents antigens to T cells. In our study, after conditioning on the top SNP (rs477515/rs2516049) there was significant association of EBNA-1 serostatus and a second independent SNP (rs2854275) that is located within the HLA-DQB1 gene. After binding to the foreign antigen, T cells stimulate B-cells to produce anti-EBV antibodies. Our finding of significant SNPs located in the HLA-DR and HLA-DQ genes may relate to the efficiency of cell surface antigen presentation to T cell receptors in EBNA-1 seropositive individuals.
Under normal circumstances, the host immune system is capable of limiting the proliferation of EBV-infected B cells through natural killer (NK) cell and T cell responses. However, some copies of the virus will become latent in memory B cells, at concentrations of approximately 1 to 50 per 106 in cells within peripheral blood in healthy individuals [30]. Although most individuals will not experience clinical symptoms after EBV enters latency, a small percentage may develop cancer following a re-activation of infection. During active infection, the virus produces approximately 100 different viral proteins that are involved in viral replication and modulating the immune response in the host. However, during latent infection only about 10 proteins are produced by the virus, including EBNA-1. This protein, which was used in our study to quantify EBV antibody titer, correlates closely with past infection [31] and is expressed on all EBV-associated tumors. EBNA-1 is suggested to elicit poor CD8+ T cell response [32] and it is considered to be a universal viral oncogene [2]. EBV-associated malignancies are higher in particular geographic locations as well as among certain ethnic groups, indicating that both environmental exposures and genetic factors are likely involved in disease risk. Cancers linked to EBV infection include: Burkitt lymphoma, which is prevalent in Africa and for which malaria may be a cofactor [6]; nasopharyngeal carcinoma, which is more common among individuals from South China [33], [34]; Hodgkin lymphoma, which is reported to have a higher incidence in Hispanic and Asian/Pacific Islander populations [35]; parotid tumors in patients from Alaska [8]; and some gastric cancers [9]. EBV infection is also associated with post-transplant lymphoproliferative disorders [36]. Serological evidence points to high EBNA-1 antibody titers prior to the onset of clinical symptoms for several of these malignancies [7], [37]. In our study, we found an overlap between EBNA-1 traits and NPC susceptibility loci in HLA-A and HLA-DR/DQ genes, and with HL loci in BTNL2, and HLA-DR genes. It has been suggested that the presentation of EBV-derived peptides is in some way involved in the pathogenesis of EBV-related cancer [16]. We also found suggestive evidence for association of top SNPs with the expression of EGFL8, which has previously been implicated in cancer progression, and NCR3, a gene that encodes a natural cytotoxicity receptor that may aid NK cells in lysing tumor cells.
Studies indicate that EBV may be implicated in the development of autoimmune disease, including systemic lupus erythematosus (SLE) and multiple sclerosis (MS) [38], [39]. In SLE, patients may be unable to keep latent EBV infection in check, possibly due to defective T cell response to the virus. Molecular mimicry appears to play a role in SLE autoimmunity, as humoral immune response initially targets the proline-rich repeat motif PPPGMRPP, antibodies against which also cross-react with the EBNA-1 peptide PPPGRRP [40], [41]. In our study we provide evidence for shared genetic factors that influence both anti-EBNA-1 antibody status and autoimmunity, as shown by a significant association between EBNA-1 serological measures and SLE SNPs rs3135391, rs9268832 and rs9271366, all located in the HLA region. SNP rs9268832 was both the top SNP associated with the EBNA-1 discrete serostatus trait in our study of Mexican Americans and the top SNP identified in a Spanish SLE cohort [42]. Given that this SNP lies within the HLA class II pseudogene DRB9, it has been suggested that this association is due to the composite effect of SNPs rs3130490 (located in the MSH5 gene) and rs3129768 (located between HLA-DRB1 and HLA-DQA1 genes). Dysregulation of the MSH5 gene, which plays a role in immunoglobulin class switching, allowing B cells to generate different classes of antibody but with the same specificity, is proposed to contribute to risk of developing SLE. While SNPs located within this gene were not statistically significant in our sample after adjusting for multiple testing, other genetic factors that appear to influence both EBNA-1 serostatus and SLE include HLA-DR and HLA-DQ loci, possibly due to mechanisms shared across various autoimmune and inflammatory diseases.
Susceptibility to MS was previously shown to be associated with HLA genes, and with HLA-DRB1 in particular [43], which in our study was significantly related to EBNA-1 serostatus. Indeed, our results, which are based on genome-wide investigation, support an earlier report of association between anti-EBNA-1 antibody titer level and HLA-DRB1 in an MS cohort [18]. That study observed that HLA-DRB1*15 positive individuals had a higher level of anti-EBNA-1 antibody titer and greater risk of developing MS, indicating that HLA genetic influence on MS risk may also involve control of EBV infection. In addition to HLA-DRB1, MS has been associated with changes in the expression of a number of other genes, including other HLA-DR genes and HLA-DQ genes [44]. We found evidence for a significant overlap between anti-EBNA-1 antibodies and three MS HLA SNPs (rs3129860, rs3135388, and rs9271366), which are associated with HLA-DR and HLA-DQ genes, and may be related to a more general autoimmune/inflammatory response.
In summary, the results of our study indicate that genetic determinants in the HLA region are important in the immune response to EBV and subsequent regulation of infection with this pathogen. Variation in EBNA-1 antibody titer among individuals may be due in part to variation in B cell permeability to EBV infection and/or differences in cell surface antigen presentation, as indicated by a statistically significant relationship between genetic factors within the HLA II region and EBV serostatus (defined here by the level of anti-EBNA-1 antibodies) that was not found for the other pathogens examined. Further investigation may reveal the underlying mechanisms by which these HLA genes potentially limit EBV viral load, possibly influencing risk for developing autoimmune disease or cancer in infected individuals.
Methods
Ethics statement
The study and protocols were approved by the Institutional Review Board at the University of Texas Health Science Center at San Antonio, and informed consent was obtained from all participants.
Study population
Individuals in this study included 1,367 members of extended, multi-generational families from the Mexican American community in San Antonio, Texas, and surrounding region. They were recruited during the years 1991–1995 for participation in the San Antonio Family Heart Study (SAFHS), which seeks to identify genetic risk factors for cardiovascular disease [45], and were ascertained without regard to any specific disease phenotype. Participants included 551 men and 816 women, who ranged in age from 16–94 years and represented 63 families (Table S1). These families had up to 6 generations and the largest consisted of 101 phenotyped individuals. Included in the study were 267 sibships, with an average size of 3.3 and size range of 2–12.
Significant findings were replicated for a separate sample of 589 Mexican Americans participating in the San Antonio Diabetes/Gallbladder Study (SAFDGS). The SAFDGS seeks to investigate the genetic influences underlying type II diabetes mellitus and gallbladder disease, and it is similar in design to the SAFHS except that recruitment was based on a single diabetic proband in each pedigree, and the sample is therefore enriched for diabetics [21], [46]. Please note that this is a very weak form of ascertainment in Mexican Americans from San Antonio, where lifetime prevalence of diabetes approaches 30%. In fact, 20 years after the initiation of both studies, the prevalence rates of major diseases, such as heart disease, diabetes, and obesity, are not significantly different between these two component studies. The SAFDGS participants consisted of 39 families, representing up to 6 generations, and included 115 sibships, which ranged in size from 2–9 (average size of 3.2). Analyses were also run on the combined data set (SAFHS+SAFDGS), which included 1,956 phenotyped individuals. Familial relationships were confirmed based on genotype composition using PREST [47].
Sample collection and determination of serostatus
Blood samples were collected from participants after an overnight fast, at the time of recruitment (1991–1995) using EDTA vacutainers. Frozen plasma aliquots were obtained as previously described [48], along with the buffy coat for DNA extraction, and stored at −80°C. Plasma samples were thawed just prior to antibody determinations, and IgG antibodies to Epstein-Barr virus nuclear antigen 1 (EBNA-1) were measured using a commercially available enzyme-linked immunosorbent assay (ELISA) kit (IBL-America, Minneapolis, MN). Seropositive/seronegative status was determined according to the manufacturer's instructions using the following absorbance values: seronegative if ≤0.9; indeterminate if >0.9 and <1.1; and seropositive if ≥1.1. Antibody titers to 12 comparative pathogens were also obtained and included: Chlamydophila pneumoniae, Helicobacter pylori, Toxoplasma gondii, cytomegalovirus (CMV), herpes simplex type I virus (HSV-1), herpes simplex type II virus (HSV-2), human herpesvirus 6 (HHV-6), varicella zoster virus (VZV), adenovirus 36 (Ad36), hepatitis A virus (HAV), influenza A virus, and influenza B virus [23]. For Ad36, a previously described serum neutralization test was utilized for measuring antibodies [49], and analyses were run in duplicate, with specimens assigned as seropositive if both replicates had neutralization titers ≥1∶8, otherwise they were considered to be seronegative. Serostatus for all other pathogens was determined using the same criteria as for EBNA-1 (i.e., seronegative if ≤0.9; indeterminate if >0.9 and <1.1; and seropositive if ≥1.1 [23]).
SNP genotyping
DNA was extracted from the lymphocyte samples from study participants. SNPs were typed using several versions of Illumina's SNP genotyping BeadChip microarrays (HumanHap550v3, HumanExon510Sv1, Human1Mv1 and Human1M-Duov3), according to the Illumina Infinium protocol (Illumina, San Diego, CA). SNP genotype data underwent extensive processing prior to analysis: SNPs with a low call rate, that were monomorphic or those comprising <10 individuals with the minor allele were excluded from analysis. Additional SNPs were excluded if Hardy-Weinberg Equilibrium test statistics were equivalent to p≤10−4 (calculated using SOLAR [50] while taking relationships properly into account), leaving a total of 944,565 SNPs for further analysis. Allele frequencies were computed using maximum likelihood estimates in SOLAR [50]. SNP genotypes were checked for Mendelian consistency using Simwalk [51]. MERLIN [52] was used to impute missing genotypes conditional on relatives' genotypes, with a weighted average of possible genotypes being used when an individual's genotype could not be inferred with certainty. Multipoint identity-by-descent (MIBD) matrices, based on a subset of 28,219 informative SNPs that were not in LD with one another, were calculated with LOKI [53]. The chromosomal maps used in the analyses were based on those generated by deCODE genetics [54].
Statistical analysis
Both anti-EBNA-1 quantitative antibody titer and discrete serostatus traits were analyzed. Statistical analyses of the sample of related individuals were performed using a variance components (VC) approach with the computer software package SOLAR [50]. Due to the sensitivity of VC analyses to non-normality, the quantitative antibody titer trait was transformed prior to analysis using an inverse, rank-based normalization to ensure a standard normal distribution of this phenotype. For the genetic analysis of the discrete EBNA-1 serostatus trait within a VC framework, a liability threshold model was used, in which serostatus was assumed to reflect an unobservable underlying quantitative liability, with individuals above a threshold being seropositive, and those below being seronegative [55], [56], individuals with indeterminate serostatus were excluded from analysis. All analyses included sex, age (at the time of sample collection), and their interactions as covariates. Although the SAFDGS was enriched for diabetics, diabetes status was found to not be a significant predictor of EBNA-1 antibody status and therefore was not included in further analyses. Narrow-sense heritability, or the proportion of phenotypic variance attributable to the aggregate effects of additive genetic variation, was estimated along with the influence of shared environmental factors, which were modeled using a “household” random effects component [20]. Individuals living together at the time of the blood draw were considered members of the same household. Details concerning the length of cohabitation, however, were not available. Because the SAFHS includes extended families, which provide information on both linkage and association, we performed several analyses in order to maximize the amount of information obtained from this sample. We performed genome-wide linkage analysis, using MIBDs based on 28,219 SNPs, to identify regions of the genome that may harbor genetic variants influencing EBNA-1 serological traits. We also performed joint genome-wide linkage and association analysis, based on 944,565 SNPs that were available for 1,367 individuals, in order to have more power for localizing the responsible loci. The joint analysis was conducted under a VC model in which the linkage component was implemented as a regular VC-based random effects linkage model, and an additive measured genotype model was used for the association component. Two-times the natural logarithm of the likelihood ratio of the joint linkage and association test was assumed to be distributed as a 50∶50 mixture of chi-squared random variables with 1 and 2 degrees of freedom, respectively. In order to remove the long-distance linkage effect and hone in on the shorter-range association signal, and thus achieve better differentiation among SNPs, we then performed association conditional on linkage for the extended HLA region (nucleotide positions 29,677,984 to 33,485,635), based on all 5689 available SNPs. As population substructure may result in spurious associations in GWAS studies, we corrected for this by using principal components analysis to model differences in ancestral contributions among study participants [57]. R princomp [58] was used to run the principal components analysis on a subset of 11,512 autosomal SNPs (determined to be in low mutual linkage distribution [LD]) in 345 genotyped founders, and offspring were assigned PC values averaged over their parents, in order to not accidentally remove true pedigree differences. The first five principal components were included as additional covariates in all statistical analyses (these account for ∼3% of the variance in the genotype scores, indicating that there is in fact little evidence for stratification in the Mexican American cohort). Given that there is a large amount LD in the HLA region on chromosome 6, we ran multiple conditional analyses on the top EBNA-1 SNPs, in order to determine the number of independent significantly-associated SNPs. In addition, LD specific to the Mexican American study population, and appropriately taking the relatedness into account, was calculated using SOLAR [50] and regional plots, based on this information, were generated using LocusZoom [59].
Transcriptional profiles
Transcriptional profile data were available for PBMCs from 1,243 study participants, collected at the same time as the plasma samples used for EBNA-1 screening, as previously described [60]. Raw and normalized expression values are available under the accession number E-TABM-305 at: http://www.ebi.ac.uk/arrayexpress. Briefly, sample quality was examined by comparing the number of expressed probes (p≤0.05), mean expression across expressed probes, and mean correlation (across expressed probes) with other samples, and 1,243 samples were deemed to give high quality expression profiles. Transcripts with significant expression at a false discovery rate (FDR) ≤0.05 were identified using a one-sided binomial test (based on counts of samples with successful and unsuccessful detection at p≤0.05), yielding 20,634 significantly detected probes. Subsequently, we performed “background noise correction”, log2 transformation, and quantile normalization.
We then tested whether SNPs that were significantly associated with EBNA-1 antibody measurements were also significantly associated with the quantitative expression levels of neighboring transcripts (i.e., whether the candidate SNPs are putative cis-regulatory variants), and whether those transcripts were in turn associated with EBNA-1 antibody measures. Prior to these analyses, in order to detect and remove the impact of suspected as well as unknown confounding variables on expression levels, we performed principal components (PC) analysis (after inverse, rank-based normalization of transcripts) on the expression profile data (details on methodology are being prepared for publication elsewhere). For detection of putative cis-acting expression quantitative trait nucleotides, the top 50 expression PCs were regressed out, followed by additive measured-genotype-based association analysis (conditional on linkage) on transcripts in the HLA region. Before correlating expression levels with anti-EBNA-1 traits, we examined (by regression analysis) the relationship between each of the top 50 expression PCs to the antibody traits, and regressed out all of the top 50 PCs except those that were significantly related to the antibody traits (so that we would not accidentally remove any true connection between expression and antibody traits).
Supporting Information
Zdroje
1. CohenJI (2000) Epstein-Barr virus infection. N Engl J Med 7 : 481–492.
2. BornkammGW (2009) Epstein-Barr virus and its role in the pathogenesis of Burkitt's lymphoma: an unresolved issue. Semin Cancer Biol 19 : 351–365.
3. BabcockGJ, DeckerLL, VolkM, Thorley-LawsonD (1998) EBV persistence in memory B cells in vivo. Immunity 9 : 395–404.
4. HochbergD, SouzaT, CatalinaM, SullivanJL, LuzuriagaK, et al. (2004) Acute infection with Epstein-Barr virus targets and overwhelms the peripheral memory B-cell compartment with resting, latently infected cells. J Virol 78 : 5194–5204.
5. StevenNM (1996) Infectious mononucleosis. EBV Reports 3 : 91–95.
6. de-TheG, GeserA, DayNE, TukeiPM, WilliamsEH, et al. (1978) Epidemiological evidence for causal relationship between Epstein-Barr virus and Burkitt's lymphoma from Ugandan prospective study. Nature 274 : 756–761.
7. HenleW, HenleG, HoHC, BurtinP, CachinY, et al. (1970) Antibodies to Epstein-Barr virus in nasopharyngeal carcinoma, other head and neck neoplasms, and control groups. J Natl Cancer Inst 44 : 225–231.
8. LanierAP, CliftSR, BornkammG, HenleW, GoepfertH, et al. (1991) Epstein-Barr virus and malignant lymphoepithelial lesions of the salivary gland. Arctic Med Res 50 : 55–61.
9. ShibataD, TokunagaM, UemuraY, SatoE, TanakaS, et al. (1991) Association of Epstein-Barr virus with undifferentiated gastric carcinomas with intense lymphoid infiltration. Lymphoepithelioma-like carcinoma. Am J Pathol 139 : 469–474.
10. WeissLM, MovahedLA, WarnkeRA, SklarJ (1989) Detection of Epstein-Barr viral genomes in Reed-Sternberg cells of Hodgkin's disease. N Engl J Med 320 : 502–506.
11. WeissLM, StricklerJG, WarnkeRA, PurtiloDT, SklarJ (1987) Epstein-Barr viral DNA in tissues of Hodgkin's disease. Am J Pathol 129 : 86–91.
12. EpsteinM, WoodallJ, ThomsonA (1964) Lymphoblastic lymphoma in bone-marrow of African green monkeys (Cercopithecus aethiops) inoculated with biopsy material from a child with Burkitt's lymphoma. Lancet 2 : 288–291.
13. BaerR, BankierAT, BigginMD, DeiningerPL, FarrellPJ, et al. (1984) DNA sequence and expression of the B95-8 Epstein-Barr virus genome. Nature 310 : 207–211.
14. UrayamaKY, JarrettRF, HjalgrimH, DiepstraA, KamataniY, et al. (2012) Genome-wide association study of classical Hodgkin lymphoma and Epstein-Barr virus status-defined subgroups. J Natl Cancer Inst 104 : 240–253.
15. HjalgrimH, RostgaardK, JohnsonPCD, LakeA, ShieldL, et al. (2010) HLA-A alleles and infectious mononucleosis suggest a critical role for cytotoxic T-cell response in EBV-related Hodgkin lymphoma. Proc Natl Acad Sci USA 107 : 6400–6405.
16. DiepstraA, NiensM, VellengaE, van ImhoffGW, NolteIM, et al. (2005) Association with HLA class I in Epstein-Barr-virus-positive and with HLA class III in Epstein-Barr-virus-negative Hodgkin's lymphoma. Lancet 365 : 2216–2224.
17. McAulayKA, HigginsCD, MacsweenKF, LakeA, JarrettRF, et al. (2007) HLA class I polymorphisms are associated with development of infectious mononucleosis upon primary EBV infection. J Clin Invest 117 : 3042–3048.
18. SundqvistE, SundströmP, LindénM, HedströmAK, AloisiF, et al. (2012) Epstein-Barr virus and multiple sclerosis: interaction with HLA. Genes Immun 13 : 14–20.
19. SundströmP, NyströmL, JidellE, HallmansG (2008) EBNA-1 reactivity and HLA DRB1*1501 as statistically independent risk factors for multiple sclerosis: a case-control study. Mult Scler 14 : 1120–1122.
20. SpenceA, WestlakeJ, LangeK (1977) Estimation of the variance components for dermal ridge count. Ann Hum Genet 41 : 111–115.
21. RubiczR, LeachCT, KraigE, DhurandharNV, DuggiralaR, et al. (2011) Genetic factors influence serological measures of common infections. Hum Hered 72 : 133–141.
22. PuppalaS, DoddGD, FowlerS, AryaR, SchneiderJ, et al. (2006) A genomewide search finds major susceptibility loci for gallbladder disease on chromosome 1 in Mexican Americans. Am J Hum Genet 78 : 377–392.
23. RubiczR, LeachCT, KraigE, DhurandharNV, GrubbsB, et al. (2011) Seroprevalence of 13 common pathogens in a rapidly growing U.S. minority population: Mexican Americans from San Antonio, TX. BMC Res Notes 21 : 433.
24. Rickinson AB, Kieff E (2001) Epstein-Barr virus. In Field's Virology, Knipe, D.M., Howley P.M., Griffin, DE. Martin, M.A., Lamb, R.A., and Roizman, B., ed. (Philadelphia, PA: Lippincott Williams & Wilkins).
25. De PaschaleM, AgrappiC, MancoMT, MirriP, ViganòEF, et al. (2009) Seroepidemiology of EBV and interpretation of the “isolated VCA IgG” pattern. J Med Virol 81 : 325–331.
26. PorterDD, WimberlyI, Benyesh-MelnickM (1969) Prevalence of antibodies to EB virus and other herpesviruses. JAMA 208 : 1675–1679.
27. BessonC, AmielC, Le-PendevenC, PlancoulaineS, RanqueB, et al. (2009) Strong correlations of anti-viral capsid antigen antibody levels in first-degree relatives from families with Epstein-Barr virus-related lymphomas. J Infect Dis 199 : 1121–1127.
28. NemerowGR, MoldC, SchwendVK, TollefsonV, CooperNR (1987) Identification of gp350 as the viral glycoprotein mediating attachment of Epstein-Barr virus (EBV) to the EBV/C3d receptor of B cells: sequence homology of gp350 and C3 complement fragment C3d. J Virol 61 : 1416–1420.
29. LiQ, SpriggsMK, KovatsS, TurkSM, ComeauMR, et al. (1997) Epstein-Barr virus uses HLA class II as a cofactor for infection of B lymphocytes. J Virol 71 : 4657–4662.
30. KhanG, MiyashitaEM, YangB, BabcockGJ, Thorley-LawsonDA (1996) Is EBV persistence in vivo a model for B cell homeostasis? Immunity 5 : 173–179.
31. Nebel-SchickelH, HindererW, SaavedraC, SchmutzlerR, HornJ, et al. (1994) Anti-EBNA-1 (carboxy-half) IgG antibodies as a seroepidemiological marker for Epstein-Barr virus infection. Beitr Infusionsther Transfusionsmed 32 : 134–137.
32. LevitskayaJ, SharipoA, LeonchiksA, CiechanoverA, MasucciMG (1997) Inhibition of ubiquitin/proteasome-dependent protein degradation by the Gly-Ala repeat domain of the Epstein-Barr virus nuclear antigen 1. Proc Natl Acad Sci USA 94 : 12616–12621.
33. ZengY, JanMG, ZhangQ, ZhangLG, LiHY, et al. (1982) Serological mass survey for early detection of nasopharyngeal carcinoma in Wuzhou City, China. Int J Cancer 29 : 139–141.
34. PathmanathanR, PrasadU, SadlerR, FlynnK, Raab-TraubN (1995) Clonal proliferations of cells infected with Epstein-Barr virus in preinvasive lesions related to nasopharyngeal carcinoma. N Engl J Med 333 : 693–698.
35. GlaserSL, GulleyML, ClarkeCA, KeeganTH, ChangET, et al. (2008) Racial/ethnic variation in EBV-positive classical Hodgkin lymphoma in California populations. Int J Cancer 123 : 1499–1507.
36. NourseJP, JonesK, GandhiMK (2011) Epstein-Barr Virus-related post-transplant lymphoproliferative disorders: pathogenic insights for targeted therapy. Am J Transplant 11 : 888–895.
37. HenleG, HenleW, CliffordP, DiehlV, KafukoGW, et al. (1969) Antibodies to Epstein-Barr virus in Burkitt's lymphoma and control groups. J Natl Cancer Inst 43 : 1147–1157.
38. JamesJA, HarleyJB, ScofieldRH (2006) Epstein-Barr virus and systemic lupus erythematosus. Curr Opin Rheumatol 18 : 462–467.
39. AscherioA, MungerKL, LennetteET, SpiegelmanD, HernanMA, et al. (2001) Epstein-Barr virus antibodies and risk of multiple sclerosis: a prospective study. JAMA 286 : 3083–3088.
40. ArbuckleMR, ReichlinM, HarleyJB, JamesJA (1999) Shared early autoantibody recognition events in the development of anti-Sm B/B' in human lupus. Scand J Immunol 50 : 447–455.
41. PooleBD, ScofieldRH, HarleyJB, JamesJA (2006) Epstein-Barr virus and molecular mimicry in systemic lupus erythematosus. Autoimmunity 39 : 63–70.
42. FernandoMMA, FreudenbergJ, LeeA, MorrisDL, BotevaL, et al. (2012) Transancestral mapping of the MHC region in systemic lupus erythematosus identifies new independent and interacting loci at MSH5, HLA-DPB1 and HLA-G. Ann Rheum Dis Epub Jan 10.
43. LincolnMR, MontpetitA, CaderMZ, SaarelaJ, DymentDA, et al. (2005) A predominant role for the HLA class II region in the association of the MHC region with multiple sclerosis. Nat Genet 37 : 1108–1112.
44. HandelAE, HandunnetthiL, BerlangaAJ, WatsonCT, MorahanJM, et al. (2010) The effect of single nucleotide polymorphisms from genome wide association studies in multiple sclerosis on gene expression. PLoS ONE 5: e10142 doi:10.1371/journal.pone.0010142.
45. MitchellBD, KammererCM, BlangeroJ, MahaneyMC, RainwaterDL, et al. (1996) Genetic and environmental contributions to cardiovascular risk factors in Mexican Americans. The San Antonio Family Heart Study. Circulation 9 : 2159–2170.
46. HuntKJ, LehmanDM, AryaR, FowlerS, LeachRJ, et al. (2005) Genome-wide linkage analyses of type 2 diabetes in Mexican Americans: the San Antonio Family Diabetes/Gallbladder Study. Diabetes 54 : 2655–2662.
47. McPeekMS, SunL (2000) Statistical tests for detection of misspecified relationships by use of genome-screen data. Am J Hum Genet 66 : 1076–1094 (2000).
48. ChengML, WoodfordSC, HilburnJL, VandeBergJL (1986) A novel system for storage of sera frozen in small aliquots. J Biochem Biophys Methods 1 : 47–51.
49. DhurandharNV, IsraelBA, KolesarJM, MayhewGF, CookME, et al. (2000) Increased adiposity in animals due to a human virus. Int J Obes Relat Metab Disor 24 : 989–996.
50. AlmasyL, BlangeroJ (1998) Multipoint quantitative-trait linkage analysis in general pedigrees. Am J Hum Genet 62 : 1198–1211.
51. SobelE, PappJC, LangeK (2002) Detection and integration of genotyping errors in statistical genetics. Am J Hum Genet 70 : 496–508.
52. AbecasisGR, ChernySS, CooksonWO, CardonLR (2002) Merlin–rapid analysis of dense genetic maps using sparse gene flow trees. Nat Genet 30 : 97–101.
53. HeathSC (1997) Markov chain Monte Carlo segregation and linkage analysis for oligogenic models. Am J Hum Genet 61 : 748–760.
54. KongA, GudbjartssonDF, SainzJ, JonsdottirGM, GudjonssonSA, et al. (2002) A high-resolution recombination map of the human genome. Nat Genet 31 : 241–247.
55. DuggiralaR, WilliamsJT, Williams-BlangeroS, BlangeroJ (1997) A variance component approach to dichotomous trait linkage analysis using a threshold model. Genet Epidemiol 6 : 987–992.
56. WilliamsJT, Van EerdeweghP, AlmasyL, BlangeroJ (1999) Joint multipoint linkage analysis of multivariate qualitative and quantitative traits. I. Likelihood formulation and simulation results. Am J Hum Genet 4 : 1134–1147.
57. PriceAL, PattersonNJ, PlengeRM, WeinblattME, ShadickNA, et al. (2006) Principal components analysis corrects for stratification in genome-wide association studies. Nat Genet 38 : 904–909.
58. R Development Core Team (2011). R: A language and environment for statistical computing. R Foundation for Statistical Computing, Vienna, Austria. URL http://www.R-project.org/.
59. PruimRJ, WelchRP, SannaS, TeslovichTM, ChinesPS, et al. (2010) LocusZoom: regional visualization of genome-wide association scan results. Bioinformatics 26 : 2336–2337.
60. GöringHHH, CurranJE, JohnsonMP, DyerTD, CharlesworthJ, et al. (2007) Discovery of expression QTLs using large-scale transcriptional profiling in human lymphocytes. Nat Genet 10 : 1208–1216.
61. NgCC, YewPY, PuahSM, KrishnanG, YapLF, et al. (2009) A genome-wide association study identifies ITGA9 conferring risk of nasopharyngeal carcinoma. J Hum Genet 54 : 392–397.
62. BeiJX, LiY, JiaWH, FengBJ, ZhouG, et al. (2010) A genome-wide association study of nasopharyngeal carcinoma identifies three new susceptibility loci. Nat Genet 42 : 599–603.
63. TseKP, SuWH, ChangKP, TsangNM, YuCJ, et al. (2009) Genome-wide association study reveals multiple nasopharyngeal carcinoma-associateed loci within the HLA region at chromosome 6p21.3. Am J Hum Genet 85 : 194–203.
64. ZhaoM, CaiH, LiX, ZhengH, YangX, et al. (2010) Further evidence for the existence of major susceptibility of nasopharyngeal carcinoma in the region near HLA-A locus in Southern Chinese. J Transl Med 10 : 57.
65. JiaWH, PanHQ, QinHD, XuYF, ShenGP, et al. (2009) A case-control and family-based association study revealing an association between CYP2E1 polymorphisms and nasopharyngeal carcinoma risk in Cantonese. Carcinogenesis 30 : 2031–2036.
66. QinHD, ShugartYY, BeiJX, PanQH, ChenL, et al. (2011) Comprehensive pahtway-based association study of DNA repair gene variants and the risk of nasopharyngeal carcinoma. Cancer Res 71 : 3000–3008.
67. Encisco-MoraV, BroderickP, MaY, JarrettRF, HjalgrimH, et al. (2010) A genome-wide association of Hodgkin's lymphoma identifies new susceptibility loci at 2p16.1 (REL), 8q24.21 and 10p14 (GATA3). Nat Genet 42 : 1126–1130.
68. UrayamaKY, JarrettRF, HjalrimH, DiepstraA, KamataniY, et al. (2012) Genome-wide association study of classical Hodgkin lymphoma and Epstein-Barr virus status defined subgroups. JNCI 104 : 240–253.
69. CozenW, LiD, BestT, Van Den BergDJ, GourraudPA, et al. (2012) A genome-wide meta-analysis of nodular sclerosing Hodgkin lymphoma identifies risk loci at 6p21.32. Blood 119 : 469–475.
70. GatevaV, SandlingJK, HomG, TaylorKE, ChungSA, et al. (2009) A large-scale replication study identifies TNIP1, PRDM1, JAZF1, UHRF1BP1 and IL10 as risk loci for systemic lupus erythematosus. Nat Genet 41 : 1228–1233.
71. International Consortium for Systemic Lupus Erythematosus Genetics (SLEGEN) (2008) HarleyJB, Alarcón-RiquelmeME, CriswellLA, JacobCO, et al. (2008) Genome-wide association scan in women with systemic lupus erythematosus identifies susceptibility variants in ITGAM, PXK, KIAA1542 and other loci. Nat Genet 40 : 204–210.
72. KyogokuC, LangefeldCD, OrtmannWA, LeeA, SelbyS, et al. (2004) Genetic association of the R620W polymorphism of protein tyrosine phosphatase PTPN22 with human SLE. Am J Hum Genet 75 : 504–507.
73. KarassaFB, TrikalinosTA, IoannidisJP (2002) Role of the Fcgamma receptor IIa polymorphism in susceptibility to systemic lupus erythematosus and lupus nephritis: a meta-analysis. Arthritis Rheum 46 : 563–1571.
74. EdbergJC, LangefeldCD, WuJ, MoserKL, KaufmanKM, et al. (2002) Genetic linkage and association of Fcgamma receptor IIIA (CD16A) on chromosome 1q23 with human systemic lupus erythematosus. Arthritis Rheum 46 : 2132–2140.
75. HanJW, ZhengHF, CuiY, SunLD, YeDQ, et al. (2009) Genome-wide association study in a Chinese Han population identifies nine new susceptibility loci for systemic lupus erythematosus. Nat Genet 41 : 1234–1237.
76. Cunninghame GrahamDS, GrahamRR, MankuH, WongAK, WhittakerJC, et al. (2008) Polymorphism at the TNF superfamily gene TNFSF4 confers susceptibility to systemic lupus erythematosus. Nat Genet 40 : 83–89.
77. CunninghameG, MorrisDL, BhangaleTR, CriswellLA, SyvänenAC, et al. (2011) Association of NCF2, IKZF1, IRF8, and TYK2 with systemic lupus erythematosus. PLoS Genet 7: e1002341 doi:10.1371/journal.pgen.1002341.
78. HomG, GrahamRR, ModrekB, TaylorKE, OrtmannW, et al. (2008) Association of systemic lupus erythematosus with C8orf13-BLK and ITGAM-ITGAX. N Engl J Med 358 : 900–909.
79. GrahamRR, CotsapasC, DaviesL, HackettR, LessardCJ, et al. (2008) Genetic variants near TNFAIP3 on 6q23 are associated with systemic lupus erythematosus. Nat Genet 40 : 1059–1061.
80. Suarez-GestalM, CalazaM, EndreffyE, PullmannR, Ordi-RosJ, et al. (2009) Replication of recently identified systemic lupus erythematosus genetic associations: a case-control study. Arthritis Res Ther 11: R69.
81. NamjouB, KothariPH, KellyJA, GlennSB, OjwangJO, et al. (2011) Evaluation of the TREX1 gene in a large multi-ancestral lupus cohort. Genes Immun 12 : 270–279.
82. Lee-KirschMA, GongM, ChowdhuryD, SenenkoL, EngelK, et al. (2007) Mutations in the gene encoding the 3′-5′ DNA exonuclease TREX1 are associated with systemic lupus erythematosus. Nat Genet 39 : 1065–1067.
83. KozyrevSV, AbelsonAK, WojcikJ, ZaghloolA, Linga ReddyMV, et al. Functional variants in the B-cell gene BANK1 are associated with systemic lupus erythematosus. Nat Genet 40 : 211–216.
84. YuB, ChenY, WuQ, LiP, ShaoY, et al. (2011) The association between single-nucleotide polymorphisms of NCF2 and systemic lupus erythematosus in Chinese mainland population. Clin Rheumatol 30 : 521–527.
85. HughesT, Kim-HowardX, KellyJA, KaufmanKM, LangefeldCD, et al. (2011) Fine mapping and transethnic geotyping establish IL2/IL21 genetic association with lupus and localize this genetic effect to IL21. Arthritis Rheum 63 : 1689–1697.
86. FernandoMM, FreudenbergJ, LeeA, MorrisDL, BotevaL, et al. (2012) Transancestral mapping of the MHC region in systemic lupus erythematosus identifies new independent and interacting loci at MSH5, HLA-DPB1 and HLA-G. Ann Rheum Dis 71 : 777–784.
87. BarcellosLF, MaySL, RamsayPP, QuachHL, LaneJA, et al. (2009) High density SNP screening of the major histocompatibility complex in systemic lupus erythematosus demonstrates strong evidence for independent susceptibility regions. PLoS Genet 5: e1000696 doi:10.1371/journal.pgen.1000696.
88. ZhangY, YangW, MokCC, ChanTM, WongRW, et al. (2011) Two missense variants in UHRF1BP1 are independently associated with systemic lupus erythematosus in Hong Kong Chinese. Genes Immun 12 : 231–234.
89. MusoneSL, TaylorKE, LuTT, NitithamJ, FerreiraRC, et al. (2008) Multiple polymorphisms in the TNFAIP3 region are independently associated with systemic lupus erythematosus. Nat Genet 40 : 1062–1064.
90. SigurdssonS, GöringHH, KristjansdottirG, MilaniL, NordmarkG, et al. (2008) Comprehensive evaluation of the genetic variants of interferon regulatory factor 5 (IRF5) reveals a novel 5 bp length polymorphism as strong risk factor for systemic lupus erythematosus. Hum Mol Genet 17 : 872–881.
91. SigurdssonS, PadyukovL, KurreemanFA, LijedahlU, WimanAC, et al. (2007) Association of a haplotype in the promoter region of the interferon regulatory factor 5 gene with rheumatoid arthritis. Arthritis Rheum 56 : 2202–2210.
92. SigurdssonS, NordmarkG, GöringHH, LindroosK, WimanAC, et al. (2005) Polymorphisms in the tyrosine kinase 2 and interferon regulatory factor 5 genes are associated with systemic lupus erythematosus. Am J Hum Genet 76 : 528–537.
93. GrahamRR, KozyrevSV, BaechlerEC, ReddyMV, PlengeRM, et al. (2006) A common haplotype of interferon regulatory factor 5 (IRF5) regulates splicing and expression and is associated with increased risk of systemic lupus erythematosus. Nat Genet 38 : 550–555.
94. BudarfML, GoyetteP, BoucherG, LianJ, GrahamRR, et al. (2011) A targeted association study in systemic lupus erythematosus identifies multiple susceptibility alleles. Genes Immun 12 : 51–58.
95. LuR, VidalGS, KellyJA, Delgado-VegaAM, HowardXK, et al. (2009) Genetic associations of LYN with systemic lupus erythematosus. Genes Immun 10 : 397–403.
96. RamosPS, CriswellLA, MoserKL, ComeauME, WilliamsAH, et al. (2011) A comprehensive analysis of shared loci between systemic lupus erythematosus (SLE) and sixteen autoimmune diseases reveals limited genetic overlap. PLoS Genet 7: e1002406 doi:10.1371/journal.pgen.1002406.
97. LessardCJ, AdriantoI, KellyJA, KaufmanKM, GrundahlKM, et al. (2011) Identification of a systemic lupus erythematosus susceptibility locus at 11p13 between PDHX and CD44 in a multiethnic study. Am J Hum Genet 88 : 83–91.
98. YangJ, YangW, HirankarnN, YeDQ, ZhangeY, et al. (2011) ELF1 is associated with systemic lupus erythematosus in Asian populations. Hum Mol Genet 20 : 601–607.
99. ShengYJ, GaoJP, LiJ, HanJW, XuQ, et al. (2011) Follow-up study identifies two novel susceptibility loci PRKCB and 8p11.21 for systemic lupus erythematosus. Rheumatology 50 : 682–688.
100. YangW, ShenN, YeDQ, LiuQ, ZhangY, et al. (2010) Genome-wide association study in Asian populations identifies variants in ETS1 and WDFY4 associated with systemic lupus erythematosus. PLoS Genet 6: e1000841 doi:10.1371/journal.pgen.1000841.
101. MolinerosJE, Kim-HowardX, DeshmukhH, JacobCO, HarleyJB, et al. (2009) Admixture in Hispanic Americans: its impact on ITGAM association and implications for admixture mapping in SLE. Genes Immun 10 : 539–545.
102. VazgiourakisVM, ZervouMI, ChoulakiC, BertsiasG, MelissourgakiM, et al. (2011) A common SNP in the CD40 region is associated with systemic lupus erythematosus and correlates with altered CD40 expression: implications for the pathogenesis. Ann Rheum Dis 70 : 2184–2190.
103. Australia and New Zealand Multiple Sclerosis Genetics Consortium (ANZgene) (2009) Genome-wide association study identifies new multiple sclerosis susceptibility loci on chromosomes 12 and 20. Nat Genet 41 : 824–828.
104. De JagerPL, JiaX, WangJ, de BakkerPI, OttoboniL, et al. (2009) Meta-analysis of genome scans and replication identify CD6, IRF8 and TNFRSF1A as new multiple sclerosis susceptibility loci. Nat Genet 41 : 776–782.
105. BaranziniSE, WangJ, GibsonRA, GalweyN, NaegelinY, et al. (2009) Genome-wide association analysis of susceptibility and clinical phenotype in multiple sclerosis. Hum Mol Genet 18 : 767–778.
106. GregorySG, SchmidtS, SethP, OksenbergJR, HartJ, et al. (2007) Interleukin 7 receptor alpha chain (IL7R) shows allelic and functional association with multiple sclerosis. Nat Genet 39 : 1083–91.
107. ComabellaM, CraigDW, Camiña-TatoM, MorcilloC, LopezC, et al. (2008) Identification of a novel risk locus for multiple sclerosis at 13q31.3 by a pooled genome-wide scan of 500,000 single nucleotide polymorphisms. PLoS ONE 3: e3490 doi:10.1371/journal.pone.0003490.
108. International Multiple Sclerosis Genetics Consortium (2007) HaflerD, CompostonA, SawcerS, LanderES, et al. (2007) Risk alleles for multiple sclerosis identified by a genomewide study. N Engl J Med 357 : 851–862.
109. JakkulaE, LeppäV, SulonenAM, VariloT, KallioS, et al. (2010) Genome-wide association study in a high-risk isolate for multiple sclerosis reveals associated variants in STAT3 gene. Am J Hum Genet 86 : 285–291.
110. NischwitzS, CepokS, KronerA, WolfC, KnopM, et al. (2010) Evidence for VAV2 and ZNF433 as susceptibility genes for multiple sclerosis. J Neuroimmunol 227 : 162–166.
Štítky
Genetika Reprodukční medicínaČlánek vyšel v časopise
PLOS Genetics
2013 Číslo 1
Nejčtenější v tomto čísle
- Function and Regulation of , a Gene Implicated in Autism and Human Evolution
- An Insertion in 5′ Flanking Region of Causes Blue Eggshell in the Chicken
- Comprehensive Methylome Characterization of and at Single-Base Resolution
- Susceptibility Loci Associated with Specific and Shared Subtypes of Lymphoid Malignancies