
Early Lineage Priming by Trisomy of Leads to Myeloproliferation in a Down Syndrome Model
An excess number of genes in trisomy on human chromosome 21 leads to the development of specific diseases in human Down syndrome. An excess copy of the gene, ERG, an ETS family transcription factor, has been implicated in abnormal blood system development in Down syndrome. In this study we show how trisomy of Erg in a murine Down syndrome model perturbs hematopoietic progenitor cells in a manner similar to that observed in human Down syndrome by inducing gene expression changes and lineage priming in early multi-potential progenitors. We show that the gene expression signature specifically attributable to trisomy of Erg in the murine model is strongly correlated with gene expression changes in human Down syndrome hematopoietic cells. The data suggest that Erg is an important regulator of megakaryocyte-erythroid lineage specification in multipotential hematopoietic cells and that trisomy of Erg in the context of DS prediposes to a transient myeloproliferative disorder and acute megakaryocyte leukaemia in a multi-step model of leukemogenesis.
Published in the journal:
. PLoS Genet 11(5): e32767. doi:10.1371/journal.pgen.1005211
Category:
Research Article
doi:
https://doi.org/10.1371/journal.pgen.1005211
Summary
An excess number of genes in trisomy on human chromosome 21 leads to the development of specific diseases in human Down syndrome. An excess copy of the gene, ERG, an ETS family transcription factor, has been implicated in abnormal blood system development in Down syndrome. In this study we show how trisomy of Erg in a murine Down syndrome model perturbs hematopoietic progenitor cells in a manner similar to that observed in human Down syndrome by inducing gene expression changes and lineage priming in early multi-potential progenitors. We show that the gene expression signature specifically attributable to trisomy of Erg in the murine model is strongly correlated with gene expression changes in human Down syndrome hematopoietic cells. The data suggest that Erg is an important regulator of megakaryocyte-erythroid lineage specification in multipotential hematopoietic cells and that trisomy of Erg in the context of DS prediposes to a transient myeloproliferative disorder and acute megakaryocyte leukaemia in a multi-step model of leukemogenesis.
Introduction
Down syndrome (DS) is the commonest human aneuploidy [1]. DS infants with trisomy of human chromosome 21 (HSA21) are uniquely predisposed to a transient myeloproliferative disorder (DS-TMD) and acute megakaryocytic leukemia (DS-AMKL) [2]. DS-TMD, usually characterised by the presence of peripheral immature myeloblasts/megakaryoblasts and the variable involvement of other organs, is restricted to the neonatal period, spontaneously regresses and is the result of genetic co-operation between trisomy of HSA21 gene(s) with an acquired somatic mutation in GATA1 in virtually all cases [3]. However, up to 30% of children will subsequently develop DS-AMKL, a malignancy clonally related to the preceding DS-TMD. Candidate gene analysis and genome-wide exome sequencing have identified somatic mutations and deletions implicated in the progression of DS-TMD to DS-AMKL, in genes including JAK1, JAK2, JAK3, FLT3, TP53, TRIB1, MPL, EZH2, APC, PARK-2, PACRG, EXT1, DLEC1 and SMC3, and further suggested that GATA-1 mutations alone in the context of HSA21 trisomy were sufficient for development of DS-TMD [4–12].
Preceding acquisition of GATA1 mutations, human DS foetal livers exhibit perturbed hematopoiesis. Increased numbers and clonogenicity of hematopoietic stem (HSC) and progenitor cells, increased frequency of bi-potential megakaryocyte-erythroid progenitors, and reduced numbers of granulocyte-macrophage-committed progenitor cells have been described [13–15]. This perturbation must be attributed to a specific trisomic gene or genes on HSA21 that drive the pre-leukemic DS phenotype from which DS-AMKL and DS-TMD subsequently arise. Murine DS models with germline transmissible segmental trisomies of human or murine orthologues of HSA21 genes have allowed genetic analyses of the contributions of genes within the DS critical interval to specific DS phenotypes [16–19]. A well studied model is the Ts(1716)65Dn mouse, which is trisomic for orthologs of ~104 human chromosome 21 genes [17]. Ts(1716)65Dn mice display progressive myeloproliferation chracterised by thrombocytosis, megakaryocyte hyperplasia, dysplastic megakaryocytic morphology and myelofibrosis. Similarly, blasts with erythro-megakaryocytic features and myelofibrosis are commonly observed in organs affected by DS-TMD/AMKL, while DS foetal livers show increased numbers of bipotential megakaryocyte-erythroid progenitors with increased clonogenicity and megakaryocyte/erythroid potential as well as megakaryocytosis [13–15].
We previously implicated the ETS family transcription factor ERG as a critical HSA21 gene in DS hematopoietic disease by demonstrating that specific reversion of Erg gene dosage to functional disomy, while the other ~103 orthologs remained trisomic, abrogated the myelo-megakaryocytic proliferation in Ts(1716)65Dn mice [20]. Erg has previously been shown to be essential for normal hematopoietic stem cell function [21–23]. Moreover, Erg deregulation can cause erythro-megakaryocytic leukemia in mice [24,25], and is implicated in acute myeloid and lymphoid malignancy in humans. In t(16;21) AML that carry the ERG/TLS-FUS fusion, complex karyotype AML with amplification of 21q, normal karyotype adult AML, MLL-rearranged paediatric AML and in T-ALL, high levels of ERG expression correlate with poor prognosis [26–29].
The detailed mechanisms by which Erg contributes in trisomy to myeloproliferation in Ts(1716)65Dn mice, and whether molecular changes specifically driven by three copies of Erg in this model reflect those associated with human DS, remained to be elucidated. To address these questions, we detailed hematopoietic progenitor perturbations associated with malignant myeloproliferation in 4 month-old Ts(1716)65Dn mice, the youngest age at which myeloid progenitor abnormalities have been observed [30]. We then performed transcriptome analysis of hematopoieitic stem cell (HSC) and myeloid progenitor cell-enriched populations from the bone marrow of Ts(1716)65Dn mice to define the relevant biological and genetic changes by which trisomy predisposes to development of myeloproliferation in this DS model [20]. Transcriptome changes in multipotential progenitor cells that were attributed specifically to trisomy of Erg in the Ts(1716)65Dn mouse were then compared to expression changes due to trisomy of chromosome 21 (HSA21) in human DS CD34+CD38- hematopoietic cells [31] to explore the role of ERG gene dosage in human disease.
Results
Trisomy of Erg in Ts(1716)65Dn mice drives changes to erythro-megakaryocytic progenitor cells similar to those in human DS
The stem-cell enriched lineage-negative cKit+Sca1+ (LSK) population has been previously shown to be expanded in trisomic Ts(1716)65Dn DS mice [20,30]. This population, which functionally resembles the expanded stem cell-enriched compartment in human DS foetal livers [15], was corrected to wild-type levels in Ts(1716)65Dn mice when Erg was specifically reduced from trisomy to functional disomy [20]. Moreover, it has been observed that, in addition to changes in stem cell numbers, bipotential erythroid-megakaryocyte progenitor populations are also perturbed in human DS [15]. We therefore sought to define the effects of trisomy on specific murine hematopoietic progenitor cells in the Ts(1716)65Dn DS model. Ts(1716)65Dn trisomic mice were crossed to mice carrying the non-functional ErgMld2 allele as previously described [20]. The four resulting genotypes: mice trisomic for ~104 orthologs of human chromosome 21 genes including Erg (Ts65Dn/Erg+/+/+), mice disomic for functional Erg and trisomic for the remaining ~103 genes in the trisomic segment (Ts65Dn/Erg+/+/Mld2), euploid mice (Erg+/+) and disomic mice with one functional Erg allele (Erg+/Mld2), were analysed at 4 months of age for abnormalities in common myeloid progenitors (CMP), granulo-monocytic progenitors (GMP), and megakaryocyte-erythroid progenitors (MEP) as previously defined [32]. Consistent with previous data [30], increased numbers of GMPs and a deficit of MEPs were evident in Ts65Dn/Erg+/+/+ mice (Fig 1A). These abnormalities were corrected in Ts65Dn/Erg+/+/Mld2 mice (Fig 1A), suggesting that trisomy of Erg is specifically associated with perturbations of myeloid progenitors of several hematopoietic lineages in the Ts(1716)65Dn DS model.
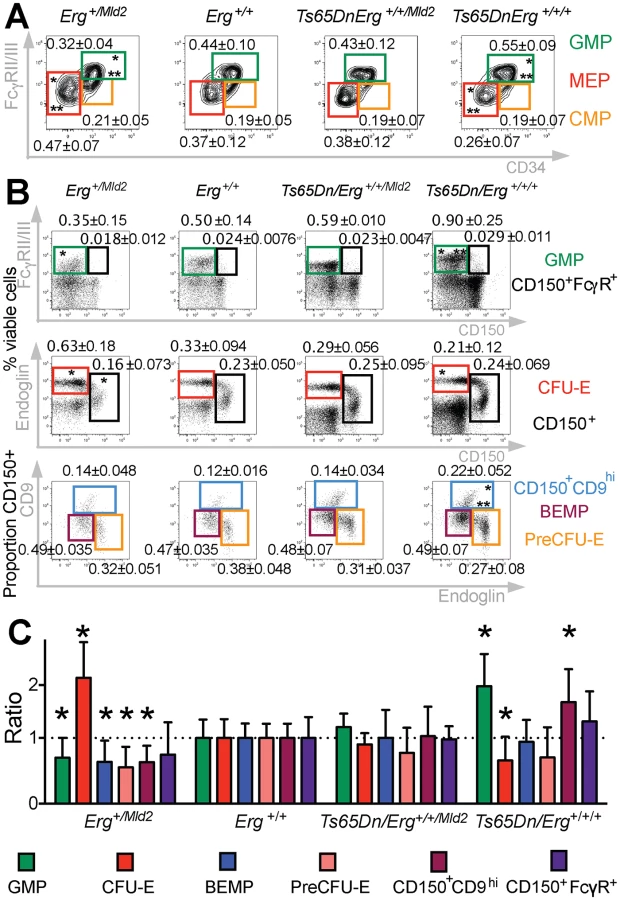
Myeloid progenitors in Ts65Dn/Erg+/+/+ mice were then examined in greater detail, with particular emphasis on the recently described series of progressively maturing BEMP, CD150+CD9hi and CD150+FcγR+ bipotential erythroid-megakaryocyte progenitors [33,34], as well as pre-granulocyte macrophage (PreGM), granulocyte-macrophage (GMP), pre-colony forming unit erythroid (PreCFU-E) and colony forming unit erythroid (CFU-E) populations [33,35], defined in S1 Table (Fig 1B and 1C). Trisomic Ts65Dn/Erg+/+/+ mice contained increased numbers of GMP and CD150+CD9hi bipotential progenitor cells, and these were normalised in number when Erg was reduced to functional disomy in Ts65Dn/Erg+/+/Mld2 mice. Conversely, the numbers of GMPs and bipotential megakaryocyte-erythroid progenitor populations (BEMP, CD150+CD9hi, CD150+FcγR+) were reduced in Erg+/Mld2 mice haploinsufficient for functional Erg. Trisomic Ts65Dn/Erg+/+/+ mice were noted to have significantly fewer CFU-E, an anomaly that was not evident in Ts65Dn/Erg+/+/Mld2 mice and Erg+/Mld2 mice had an expanded population of these late erythroid progenitors, supporting previous data that suggested Erg normally restrains terminal erythroid differentiation [22,24,25]. Consistent with the immunophenotypic analyses, in clonogenic assays, Ts65Dn/Erg+/+/+ bone marrow demonstrated stimuli-specific increases in the numbers of granulocyte, macrophage and megakaryocyte colony-forming units (CFU). This myeloproliferation was moderated in Ts65Dn/Erg+/+/Mld2 mice (Table 1). Together, these data support a role for Erg in regulation of multiple hematopoietic lineages. The bias toward megakaryocyte and away from erythroid progenitor formation that was specifically attributable to trisomy of Erg in Ts(1716)65Dn mice resembles progenitor abnormalities observed in pre-leukemic human DS foetal livers prior to acquisition of GATA1 mutations, although human DS foetal livers exhibit reduced numbers of GMP, in contrast to the mouse model [15].

Trisomy of Erg drives gene expression changes in multipotential progenitor cell populations
We undertook gene expression profiling of prospectively isolated LSK, CMP, GMP and MEP populations from Ts65Dn/Erg+/+/+, Ts65Dn/Erg+/+/Mld2, Erg+/+ and Erg+/Mld2 mice. Gene expression changes within each cell population that were attributable to changes in functional Erg gene dosage were determined by specific pair-wise comparisons using linear modeling and empirical Bayes moderated t-statistics [36]. Changes due to full trisomy of all ~104 syntenic genes were inferred from comparison of Ts65Dn/Erg+/+/+ versus Erg+/+ mice, trisomy-induced changes specifically attributable to trisomy of Erg were evident from comparison of Ts65Dn/Erg+/+/+ versus Ts65Dn/Erg+/+/Mld2 (effects specific to Erg trisomy), changes due to trisomy with two copies of functional Erg (effects due to non-Erg gene trisomy) emerged from comparison of Ts65Dn/Erg+/+/Mld2 versus Erg+/+, and changes due to Erg haplo-insufficiency from comparison of Erg+/Mld2 versus Erg+/+.
We initially explored the expression in LSK, CMP, GMP and MEP cells of the ~104 HSA21 orthologs present in trisomy in Ts65Dn/Erg+/+/+ mice compared with their expression in Erg+/+ cells. Increased expression of these genes in trisomc cells varied and was also dependent on the specific hematopoietic cell type examined (Fig 2A). At a false discovery rate of 5% across the entire transcriptome, Son, Usp16, Cyrzl1, Gart, Cct8 were upregulated in LSK cells, Sfrs15, Ifngr2, Ifnar2, Gart, Atp5j in CMPs, and Gart, Chaf1b, Hlcs, Ttc3 in GMPs of Ts(1716)65Dn mice (Fig 2A and S2 Table).

The greatest number of gene expression changes due to full trisomy (Ts65Dn/Erg+/+/+ versus Erg+/+) or specifically to Erg trisomy (Ts65Dn/Erg+/+/+ versus Ts65Dn/Erg+/+/Mld2) occurred in the LSK compartment, while gene expression changes attributable to trisomy of non-Erg genes in the interval (Ts65Dn/Erg+/+/Mld2 versus Erg+/+) were fewer and occurred principally in MEP and GMP populations (Table 2). In addition, in LSK cells there was a strong degree of overlap in differentially expressed genes due to full trisomy and specifically due to trisomy of Erg, both in up - and down-regulated genes (Fig 2B, 2C and 2D).

Given the correlation of gene expression changes induced by full trisomy with those associated specifically with trisomy of Erg, a Genuine Association Analysis (GENAS) was undertaken. GENAS is a relatively new statistical technique that estimates the biological correlation between two differential expression profiles, correcting for any technical correlation and for the statistical uncertainty with which the fold changes are estimated [37,38]. Unlike the initial analysis in Fig 2B, GENAS does not depend on a significance cut-off and instead calculates an overall correlation using all expressed genes. In confirmation of the initial analyses, there was a very high degree of biological correlation in LSK cells between gene expression changes caused by trisomy of the full HSA21 syntenic segment and those associated specifically with trisomy of Erg. The strongest correlation between expression changes resulting from full trisomy and those due to trisomy of non-Erg genes occurred within MEP cells (Fig 3). Notably, the degree of biological correlation between gene expression changes attributable specifically to Erg trisomy and those due to trisomy of non-Erg genes was weak in all cell types analysed, suggesting gene expression changes induced specifically by trisomy of Erg were distinct from the combined effect of other genes within the Ts(1716)65Dn trisomic segment.

Together, these findings establish that in hematopoietic progenitor cells, Erg is the dominant influence within the Ts(1716)65Dn trisomic interval, three copies of which specifically drives gene expression changes that are evident primarily within multipotential hematopoietic progenitor populations rather than more lineage-restricted progenitors.
Trisomy of Erg induces lineage priming in multipotential progenitor cells
We next sought to understand how gene expression changes induced specifically by trisomy of Erg could lead to perturbations of hematopoietic progenitors and the myeloproliferative phenotype observed in Ts(1716)65Dn mice. To do this, we undertook an expression signature analysis of the expression changes in the Ts65Dn/Erg+/+/+ versus Ts65Dn/Erg+/+/Mld2 cells using curated gene sets from the Molecular Signatures database (MSigDB version 2.5) and pathway gene sets defined by the BioCarta, KEGG and Reactome databases. A ROAST test was conducted for each signature gene set. ROAST is a gene set test suitable for small samples and linear models that accounts for inter-gene correlation [38,39]. ROAST evaluates whether the overall expression signature defined by a gene set is up - or down-regulated within a specific comparison. This analysis found that expression signatures associated with progenitor cells of specific hematopoietic lineages, including granulocyte-monocyte progenitors, megakaryocytes, platelets and platelet processes, were significantly upregulated in the Ts65Dn/Erg+/+/+ cells (ROAST P-value < 0.05, S3 Table). By contrast, signatures associated with myeloproliferation were not significantly enriched in Ts65Dn/Erg+/+/+ versus Ts65Dn/Erg+/+/Mld2 LSK cells.
Given these findings, and as we had observed perturbations in specific hematopoietic progenitor populations in Ts65Dn/Erg+/+/+ bone marrow (Fig 1 and Table 1), we examined whether the gene expression changes specific to trisomy of Erg in Ts(1716)65Dn mice could be interpreted in terms of cell lineage priming. We generated gene expression signatures that define specific cell populations: LSK, GMP and their precursors (Pre-GM Flt3+, Pre-GM Flt3-), megakaryocytes and their progenitors (BEMP, CD150+ CD9hi, CD150+ FcγR+), and CFU-E and pre-CFU-E. An expression signature was defined for each cell population by compiling the significantly up-regulated genes in that cell type compared to the average of all the other populations, together with the magnitude of the up-regulation for each gene as measured by the moderated t-statistic (S4 Table). ROAST tests were then conducted, with genes weighted by their magnitude of change, to determine whether these signatures were associated with the gene expression changes due to full trisomy (Ts65Dn/Erg+/+/+ versus Erg+/+), the specific effects of Erg trisomy (Ts65Dn/Erg+/+/+ versus Ts65Dn/Erg+/+/Mld2), the effects of trisomy of non-Erg genes (Ts65Dn/Erg+/+/Mld2 versus Erg+/+) and Erg haploinsufficiency (Ts65Dn/Erg+/+ versus Erg+/Mld2) in LSK, CMP, GMP and MEP populations.
Signatures of more committed progenitors, particularly multipotential PreGM Flt3- cells, granulo-monocytic progenitors (PreGM Flt3+ and GMP), bipotential megakaryocyte-erythroid progenitors (CD150+CD9hi and CD150+FcγR+) and megakaryocytes, were enriched in the gene expression changes due to trisomy of Erg in LSK cells, and this was also evident in CMPs by this comparison (Fig 4). In LSK cells, this was accompanied by downregulation of the normal LSK gene signature indicative of a more differentiated profile (Fig 4). In contrast, erythroid progenitor signatures (PreCFU-E and CFU-E) were enriched in the gene expression changes caused by haploinsufficiency of functional Erg in LSK and CMP cells (Fig 4). Strikingly, these genetic changes attributable specifically to trisomy of Erg in Ts(1716)65Dn LSKs and CMPs were concordant with the increased numbers of GMP and megakaryocyte-committed cells and fewer erythroid progenitors that were evident in Ts65Dn/Erg+/+/+ but not Ts65Dn/Erg+/Mld2+ mice, as well as the relative enrichment of erythroid progenitors in mice with Erg haploinsufficiency (Fig 1).

Finally, we investigated the expression of genes implicated by somatic mutations and deletions in the progression of DS-TMD to DS-AMKL. Of these genes, expression of the murine orthologues for JAK1, JAK2, JAK3, FLT3, TP53, TRIB1, MPL, EZH2, APC, EXT1 and SMC3 was detected in the microarray data from LSK, CMP, GMP or MEP cells. While modest differences were evident in expression of some of these genes in comparisons between cells from Ts65Dn/Erg+/+/+ and Erg+/+ mice, differential expression of these genes did not reach statistical significance (S1 Fig and S2 Table).
Thus, the data support a model in which gene expression changes attributable specifically to trisomy of Erg in Ts(1716)65Dn mice occur primarily in multipotential hematopoietic cells with priming for specific hematopoietic progenitor lineages leading to myeloid progenitor perturbation, myeloproliferative changes and megakaryocytosis.
Erg-trisomy gene signatures in Ts(1716)65Dn LSKs correlate with gene expression changes in human DS CD34+CD38- bone marrow cells
Transcriptome profiling of human DS Lin-CD45+CD34+CD38- bone marrow cells enriched for HSCs and multipoential hematopoietic progenitors that had been previously combined with transcriptomes of DS neurospheres derived from foetal cortical precursors, demonstrated differences in gene expression when compared to diploid controls [31]. We sought to establish if DS Lin-CD45+CD34+CD38- bone marrow cells specifically demonstrated gene expression changes associated with trisomy of HSA21 when compared to diploid controls, and if these were related to differential gene expression due to Erg trisomy in LSKs in the Ts(1716)65Dn DS model. From the published data [31], we derived gene expression signatures for human DS HSC and multipotential progenitor cells that were induced by trisomy of HSA21 (S5 Table). We then used ROAST to compare these human DS gene signatures to gene expression changes induced by full trisomy in Ts(1716)65Dn LSK cells, as well as those specific to trisomy of Erg and those due to trisomy of non-Erg genes (Fig 5). The human DS gene signatures were strongly and significantly correlated with gene expression changes due specifically to Erg trisomy in Ts(1716)65Dn LSK cells, but not with those attributable to trisomy of non-Erg genes (Fig 5A). The complementary analysis was then undertaken. ROAST tests showed that gene expression changes specifically induced by trisomy of Erg in Ts(1716)65Dn LSK cells significantly correlated with gene expression changes due to trisomy of HSA21 in human DS Lin-CD34+CD38- cells (Fig 5B). This genetic data supports the role of ERG as a key gene on HSA21 which in trisomy, drives the hematopoietic phenotype in human DS.

Discussion
We show here, in comparisons between Ts65Dn/Erg+/+/+ mice, in which a ~104-gene interval syntenic to HSA21 is present in trisomy, and their Ts65Dn/Erg+/+/Mld2 counterparts, in which the Erg gene within this interval is specifically reduced to functional disomy, that trisomy of Erg is specifically required for the characteristic perturbations in specific hematopoietic progenitor cell populations in the Ts(1716)65Dn DS model. Unlike transgenic and retroviral models of induced Erg expression, the use of the non-functional ErgMld2 allele in this model allows accurate characterisation of effects of functional Erg gene dosage while expression is endogenously regulated. The hematopoietic changes in Ts(1716)65Dn mice reflected the pre-leukemic changes observed in human DS foetal livers prior to acquisition of GATA-1 or other somatic mutations. While these analyses do not exclude contribution from other genes within the trisomic interval, they clearly establish that three copies of Erg is specifically required to drive transcriptome changes in HSCs and early multipotential progenitors in Ts(1716)65Dn mice. Moreover, the data provide a mechanism by which deregulation of Erg leads to perturbation of myeloid progenitor populations, myeloproliferation and megakaryocytosis in trisomy. Our findings show that perturbation of functional Erg gene dose by trisomy or by haploinsufficiency, is associated with lineage specific gene expression changes and "lineage priming" of multipotential hematopoietic progenitor cells. Notably, the effects specific to trisomy of Erg on gene expression and progenitor cell alterations in Ts(1716)65Dn mice were strongly reflected in Erg+/Mld2 mice, but in the opposite direction. Finally, we demonstrate that the gene signature specifically associated with trisomy of Erg in Ts(1716)65Dn LSK cells is directly related to gene expression changes in human DS Lin-CD34+CD38- cells enriched for HSCs and early multipotential progenitors. These data support a key role for ERG as a critical gene in trisomy of HSA21 that drives hematopoietic changes in human DS.
Previous analyses established that Erg is an important regulator of HSC self-renewal after establishment of definitive hematopoiesis in the embryo [23] and in emergency hematopoiesis in adult HSCs [21,22]. The data presented here imply additional roles for Erg for lineage priming in early multipotential hematopoietic cells which affects subsequent myeloid lineage development (Fig 6). This includes granulocyte-monocyte progenitors and bipotential erythroid-megakaryocyte progenitors, with effects on megakaryocyte and erythroid lineage specification being of particular relevance. In these latter roles, haploinsufficiency of functional Erg resulted in fewer bipotential erythroid-megakaryocyte progenitors and a propensity toward CFU-E formation, consistent with previous transplantation studies which demonstrated a bias toward erythroid lineage formation from Erg+/Mld2 HSCs [22]. Trisomy specifically related to Erg in the Ts(1716)65Dn model led to expansion of bipotential megakaryocyte-erythroid progenitors, fewer committed erythroid progenitors and megakaryocytosis [20]. This finding is consistent with changes in human DS foetal livers [15] and other independent murine models of Erg overexpression [24,40]. Indeed, aberrant megakaryocyte-erythroid differentiation and erythroid maturation block may be a potential unifying mechanism for Erg in predisposing to acute bipotential megakaryocytic-erythroid leukemia [25]. The selective expansion of CD150+CD9hi cells within bipotential megakaryocyte-erythroid progenitor compartment in Ts(1716)65Dn mice is similar to that observed in murine models of thrombopoietin driven myeloproliferation [33,34], providing additional evidence that this progenitor population correlates with the degree of megakaryocytosis in disease models. It was also noted that Ts(1716)65Dn mice exhibited increased numbers of GMP, while human DS foetal livers exhibit reduced numbers of these progenitors [15]. This discrepancy may by attributable to the comparatively low level of endogenous Erg expression in murine models relative to human hematopoietic cells [40]. Indeed, in a transgenic model of ERG overexpression, reduction in GMP number was observed in murine foetal livers [40], suggesting the level of gene expression and the hematopoietic stage is important in explaining this apparently discordant phenotype.

It is notable that the expansion of the LSK compartment in Ts65Dn/Erg+/+/+ mice, which is specifically dependent on trisomy of Erg [20], reflects expansion of HSPCs in DS foetal livers [15], and was associated with downregulation of the LSK gene signature and up-regulation of progenitor cell-specific gene expression patterns, making trisomic LSKs less "stem cell-like". This suggests that an excess of Erg favors progenitor specification at the expense of HSC maintenance. This finding is in keeping with the increased multi-potential pre-progenitor cell frequency in Ts65Dn/Erg+/+/+ bone marrow [20] and the increased propensity to form "blast-my" colonies upstream from CFU-GEMM in DS foetal liver [15]. These observations also argue against increased Erg gene dose inducing a program of self-renewal as a leukemogenic mechanism in the development of DS-AMKL and DS-TMD. Indeed, competitive transplantation assays using the Ts1Rhr trisomic murine model of DS, which carries a trisomic segment that includes the Erg gene, demonstrated fewer competitive repopulating units compared to disomic controls [41]. Nevertheless, the observation that the multipotential PreGMFlt3- progenitor signature was also upregulated in Ts65Dn/Erg+/+/+ CMPs relative to Ts65Dn/Erg+/+/Mld2 suggests that in trisomy, Erg allows maintenance of multipotential progenitor potential while promoting specific lineage commitment toward megakaryocyte and granulocyte-monocyte differentiation. This would be in keeping with the increase in numbers of total colonies, particularly megakaryocyte-containing colonies, observed by in vitro culture experiments.
It remains to be determined whether the consequences of genetic perturbations due to trisomy and effects specific to ERG trisomy in the context of DS as our data may suggest, could be amenable to therapeutic targeting in the prevention or treatment of DS-TMD or DS-AMKL in addition to currently available strategies.
Materials and Methods
Mice
Derivation and genotyping of the ErgMld2 mutant allele has been described [21]. Ts(1716)65Dn mice (The Jackson Laboratory) were maintained as previously described [20]. All mice were derived from the first-generation progeny of matings between Erg+/Mld2 and Ts(1716)65Dn mice and genotyped as previously described [42]. This study was performed in accordance with the Australian Code for the Care and Use of Animals for Scientific Purposes, published by the Australian National Health and Medical Research Council. Procedures were approved by the Walter and Eliza Hall Institute of Medical Research Animal Ethics Committee (Approval number 2012.003).
Haematology
Single-cell suspensions from bone marrow were prepared in balanced salt solution (0.15 M NaCl, 4 mM KCl, 2 mM CaCl2, 1 mM MgSO4, 1 mM KH2PO4, 0.8 mM K2HPO4, and 15 mM N-2-hydroxyethylpiperazine-N'-2-ethanesulfonic acid supplemented with 2% [vol/vol] bovine calf serum). Clonal analysis of bone marrow cells (2.5x10⁴) was performed in 1 mL semisolid agar cultures of 0.3% agar in Dulbecco/s modified Eagles medium containing 20% newborn calf serum and stem cell factor; SCF (100 ng/mL), erythropoietin; EPO (2 U/mL), and interleukin-3; IL-3 (10 ng/mL), granulocyte colony stimulating factor; G-CSF (103 U/mL), granulocyte-macrophage colony stimulating factor; GM-CSF (103 U/mL) and/or macrophage colony stimulating factor; M-CSF (103 U/mL). Cultures were incubated at 37°C for 7 days in a fully humidified atmosphere of 10% CO2 in air, then fixed, dried onto glass slides, and stained for acetylcholinesterase, Luxol fast blue, and hematoxylin, and the number and type of colonies were determined.
Flow cytometry
Staining was performed using rat anti-mouse biotinylated or fluorochrome-conjugated antibodies specific for Ter119 (Ly-76), Gr1 (Ly6G and Ly6C), Mac1 (CD11b), B220 (CD45R), CD4, CD8, CD41, CD34, CD16/32, Sca1 (Ly6A/E), cKit (CD117) and CD150 (Biolegend) and IL-7 receptor α (IL7Rα), CD48, CD105, and CD9 (eBioscience). Secondary staining used streptavidin PE-Texas-Red (BD Pharmingen). Cells were analyzed using a LSR Fortessa flow cytometer (Becton Dickinson), or cells were sorted using a FACSAria II (Becton Dickinson) flow cytometer after antibody staining with lineage depletion.
Statistical analysis
Student's unpaired two-tailed t-tests were used using GraphPad Prism v. 5.0a for Mac Os X (GraphPad Software), unless otherwise specified.
Microarray expression profiling of murine progenitor cell populations
Bone marrow LSK, CMP, GMP and MEP populations were isolated by FACS from 2–4 mice including males and females from each genotype (Ts65Dn/Erg+/+/+, Ts65Dn/Erg+/+/Mld2, Erg+/+ and Erg+/Mld2) at ~ 4 months of age. Total RNA was isolated from 100,000–500,000 cells pooled from genotype and cell population matched samples using the RNeasy Micro kit (Qiagen). RNA quality was assessed with the Agilent Bioanalyzer 2100 (Agilent Technologies) by using the Agilent RNA 6000 Nanokit (Agilent Technologies) according to the manufacturer's protocol. Up to 200ng of RNA was labelled with the Total Prep RNA amplification kit (Ambion), and complementary RNA (1.5 μg) was hybridized to 48 arrays using six Illumina Mouse WG-6 V2.0 Expression BeadChips (Illumina, Inc., San Diego, CA) according to Illumina standard protocols. The resultant microarray probe level data were analyzed by using the limma software package Version 3.21.1 [38]. Raw intensities were normalized by using the neqc function, which performs normexp background correction followed by quantile normalization using control probes [43]. Probes were filtered if not detected in any sample (detection P value < 0.05). Pairwise comparisons were made by using linear modeling and empirical Bayes moderated t statistics [36]. Empirical array quality weights were estimated and incorporated into the linear models [44]. Allowance was made for possible correlations between RNA samples drawn from the same pool of mice [45]. The false discovery rate (FDR) was controlled by using the Benjamini-Hochberg algorithm. Probes with FDR of less than 5% were considered to be differentially expressed. The microarray data have been deposited to the Array Express database (http://www.ebi.ac.uk/arrayexpress) with accession number E-MTAB-2574.
RNA-seq expression profiling
Validation of the microarray data was undertaken via RNA-seq. Total RNA was extracted using the RNeasy Plus minikit (Qiagen) from LSK cells sorted independently from three trisomic Ts65Dn/Erg+/+/+ (two male and one female) and Erg+/+ controls (two male and one female) at ~ 4 months of age. Sequencing was performed on an Illumina Hi-Seq 2500, producing at least 15.9 million 100bp paired-end reads per sample. Reads were mapped to the mm10 mouse genome (Genome Reference Consortium GRCm38) using the Subread aligner [46]. Read counts were summarised at the gene level by featureCounts [47] using NCBI RefSeq gene annotation. Differential expression analysis utilised the edgeR [48] and limma software packages. Genes were filtered as not expressed if they failed to achieve at least 0.5 counts per million reads in at least 2 of the 6 samples. All Entrez gene IDs without an official symbol were removed from further analysis, as were Y chromosome genes, Xist, and immunoglobulin genes, leaving 14,551 genes for downstream analysis. Library sizes were normalised using the TMM method [49]. The voom function of the limma package was used to convert read counts to log2 counts per million with associated precision weights [50]. Differential expression was assessed using empirical Bayes moderated t-statistics [36]. There was a strong correlation between the gene sets identified as differentially expressed by microarray (S2 Table) with RNA-seq data in Ts65Dn/Erg+/+/+ versus Erg+/+ LSK cells (ROAST P value = 0.00795) and of the differentially expressed genes identified from the microarray comparison, over fifty genes were also identified as differentially expressed using non-pooled independent samples by RNA-Seq with a P value of less than 0.05.
Expression profiling of human Down syndrome cells
Affymetrix microarray CEL files containing gene expression profiles of human DS CD34+CD38- HSCs and multipotential progenitors [31] were obtained from the Paterson Institute for Cancer Research at the University of Manchester and analysed with the affy (version 1.34) and limma software packages. Raw intensities were background corrected, normalised and summarized using the Robust Multiarray Average algorithm. Pairwise comparisons were made by using linear modeling and empirical Bayes moderated t statistics.
Expression signature analyses
Gene sets from the Molecular Signatures Database (Broad Institute, Version 2.5) were mapped from human to mouse orthologs (http://bioinf.wehi.edu.au/software/MSigDB/). Genuine Association analysis [37] used the genas function of the limma package. Rotational gene set tests (ROAST) were performed with the roast function of the limma package, using the “mean” set statistic, array quality weights, Holm modification for multiple testing and 10000 rotations [39]. Moderated t-statistics were used to weight genes in the gene set tests. Barcode plots were made using the barcodeplot function of the limma package.
Heatmaps were plotted using the Heatmap.2 function from the gplots software package, using Pearson correlation for hierarchical clustering for rows and columns. Gene signatures were represented in a heatmap as Z score equivalents. The Z scores were derived from the standard normal distribution and correspond to the continuity-corrected single-tailed P values obtained from the ROAST tests, with a positive Z score for an up-regulated gene set and negative Z score for a down-regulated gene set.
Supporting Information
Zdroje
1. LEJEUNE J, TURPIN R, GAUTIER M (1959) [Chromosomic diagnosis of mongolism.]. Arch Fr Pediatr 16 : 962–963. 14415503
2. Massey G, Zipursky A, Chang M, Doyle J, Nasim S, et al. (2006) A prospective study of the natural history of transient leukemia (TL) in neonates with Down syndrome (DS): Children's Oncology Group (COG) study POG-9481. Blood 107 : 4606–4613. 16469874
3. Gamis AS, Smith FO (2012) Transient myeloproliferative disorder in children with Down syndrome: clarity to this enigmatic disorder. Br J Haematol 159 : 277–287. doi: 10.1111/bjh.12041 22966823
4. Malinge S, Ragu C, Della-Valle V, Pisani D, Constantinescu S, et al. (2008) Activating mutations in human acute megakaryoblastic leukemia. Blood 112 : 4220–4226. doi: 10.1182/blood-2008-01-136366 18755984
5. Kiyoi H, Yamaji S, Kojima S, Naoe T (2007) JAK3 mutations occur in acute megakaryoblastic leukemia both in Down syndrome children and non-Down syndrome adults. Leukemia 21 : 574–576. 17252020
6. De Vita S, Mulligan C, McElwaine S, Dagna-Bricarelli F, Spinelli M, et al. (2007) Loss-of-function JAK3 mutations in TMD and AMKL of Down syndrome. Br J Haematol 137 : 337–341. 17456055
7. Hama A, Muramatsu H, Makishima H, Sugimoto Y, Szpurka H, et al. (2012) Molecular lesions in childhood and adult acute megakaryoblastic leukaemia. Br J Haematol 156 : 316–325. doi: 10.1111/j.1365-2141.2011.08948.x 22122069
8. Klusmann JH, Reinhardt D, Hasle H, Kaspers GJ, Creutzig U, et al. (2007) Janus kinase mutations in the development of acute megakaryoblastic leukemia in children with and without Down's syndrome. Leukemia 21 : 1584–1587. 17443226
9. Hussein K, Bock O, Theophile K, Schulz-Bischof K, Porwit A, et al. (2009) MPLW515L mutation in acute megakaryoblastic leukaemia. Leukemia 23 : 852–855. doi: 10.1038/leu.2008.371 19194467
10. Malkin D, Brown EJ, Zipursky A (2000) The role of p53 in megakaryocyte differentiation and the megakaryocytic leukemias of Down syndrome. Cancer Genet Cytogenet 116 : 1–5. 10616523
11. Yokoyama T, Toki T, Aoki Y, Kanezaki R, Park MJ, et al. (2012) Identification of TRIB1 R107L gain-of-function mutation in human acute megakaryocytic leukemia. Blood 119 : 2608–2611. doi: 10.1182/blood-2010-12-324806 22294728
12. Nikolaev SI, Santoni F, Vannier A, Falconnet E, Giarin E, et al. (2013) Exome sequencing identifies putative drivers of progression of transient myeloproliferative disorder to AMKL in infants with Down syndrome. Blood 122 : 554–561. doi: 10.1182/blood-2013-03-491936 23733339
13. Tunstall-Pedoe O, Roy A, Karadimitris A, de la Fuente J, Fisk NM, et al. (2008) Abnormalities in the myeloid progenitor compartment in Down syndrome fetal liver precede acquisition of GATA1 mutations. Blood 112 : 4507–4511. doi: 10.1182/blood-2008-04-152967 18689547
14. Chou S, Opalinska J, Yao Y, Fernandes M, Kalota A, et al. (2008) Trisomy 21 enhances human fetal erythro-megakaryocytic development. Blood 112 : 4503–4506. doi: 10.1182/blood-2008-05-157859 18812473
15. Roy A, Cowan G, Mead AJ, Filippi S, Bohn G, et al. (2012) Perturbation of fetal liver hematopoietic stem and progenitor cell development by trisomy 21. Proc Natl Acad Sci U S A 109 : 17579–17584. doi: 10.1073/pnas.1211405109 23045701
16. Antonarakis SE, Lyle R, Dermitzakis ET, Reymond A, Deutsch S (2004) Chromosome 21 and down syndrome: from genomics to pathophysiology. Nat Rev Genet 5 : 725–738. 15510164
17. Gardiner K, Fortna A, Bechtel L, Davisson M (2003) Mouse models of Down syndrome: how useful can they be? Comparison of the gene content of human chromosome 21 with orthologous mouse genomic regions. Gene 318 : 137–147. 14585506
18. Reeves RH (2006) Down syndrome mouse models are looking up. Trends Mol Med 12 : 237–240. 16677859
19. Malinge S, Izraeli S, Crispino J (2009) Insights into the manifestations, outcomes, and mechanisms of leukemogenesis in Down syndrome. Blood 113 : 2619–2628. doi: 10.1182/blood-2008-11-163501 19139078
20. Ng A, Hyland C, Metcalf D, Carmichael C, Loughran S, et al. (2010) Trisomy of Erg is required for myeloproliferation in a mouse model of Down syndrome. Blood 115 : 3966–3969. doi: 10.1182/blood-2009-09-242107 20007548
21. Loughran S, Kruse E, Hacking D, de Graaf C, Hyland C, et al. (2008) The transcription factor Erg is essential for definitive hematopoiesis and the function of adult hematopoietic stem cells. Nat Immunol 9 : 810–819. doi: 10.1038/ni.1617 18500345
22. Ng AP, Loughran SJ, Metcalf D, Hyland CD, de Graaf CA, et al. (2011) Erg is required for self-renewal of hematopoietic stem cells during stress hematopoiesis in mice. Blood 118 : 2454–2461. doi: 10.1182/blood-2011-03-344739 21673349
23. Taoudi S, Bee T, Hilton A, Knezevic K, Scott J, et al. (2011) ERG dependence distinguishes developmental control of hematopoietic stem cell maintenance from hematopoietic specification. Genes Dev 25 : 251–262. doi: 10.1101/gad.2009211 21245161
24. Carmichael CL, Metcalf D, Henley KJ, Kruse EA, Di Rago L, et al. (2012) Hematopoietic overexpression of the transcription factor Erg induces lymphoid and erythro-megakaryocytic leukemia. Proc Natl Acad Sci U S A 109 : 15437–15442. 22936051
25. Tang JZ, Carmichael CL, Shi W, Metcalf D, Ng AP, et al. (2013) Transposon mutagenesis reveals cooperation of ETS family transcription factors with signaling pathways in erythro-megakaryocytic leukemia. Proc Natl Acad Sci U S A 110 : 6091–6096. doi: 10.1073/pnas.1304234110 23533276
26. Kong XT, Ida K, Ichikawa H, Shimizu K, Ohki M, et al. (1997) Consistent detection of TLS/FUS-ERG chimeric transcripts in acute myeloid leukemia with t(16;21)(p11;q22) and identification of a novel transcript. Blood 90 : 1192–1199. 9242552
27. Baldus C, Burmeister T, Martus P, Schwartz S, Gokbuget N, et al. (2006) High expression of the ETS transcription factor ERG predicts adverse outcome in acute T-lymphoblastic leukemia in adults. J Clin Oncol 24 : 4714–4720. 16954520
28. Baldus C, Liyanarachchi S, Mrozek K, Auer H, Tanner S, et al. (2004) Acute myeloid leukemia with complex karyotypes and abnormal chromosome 21: Amplification discloses overexpression of APP, ETS2, and ERG genes. Proc Natl Acad Sci U S A 101 : 3915–3920. 15007164
29. Marcucci G, Baldus C, Ruppert A, Radmacher M, Mrozek K, et al. (2005) Overexpression of the ETS-related gene, ERG, predicts a worse outcome in acute myeloid leukemia with normal karyotype: a Cancer and Leukemia Group B study. J Clin Oncol 23 : 9234–9242. 16275934
30. Kirsammer G, Jilani S, Liu H, Davis E, Gurbuxani S, et al. (2008) Highly penetrant myeloproliferative disease in the Ts65Dn mouse model of Down syndrome. Blood 111 : 767–775. 17901249
31. Cairney CJ, Sanguinetti G, Ranghini E, Chantry AD, Nostro MC, et al. (2009) A systems biology approach to Down syndrome: identification of Notch/Wnt dysregulation in a model of stem cells aging. Biochim Biophys Acta 1792 : 353–363. doi: 10.1016/j.bbadis.2009.01.015 19419698
32. Akashi K, Traver D, Miyamoto T, Weissman I (2000) A clonogenic common myeloid progenitor that gives rise to all myeloid lineages. Nature 404 : 193–197. 10724173
33. Ng AP, Kauppi M, Metcalf D, Di Rago L, Hyland CD, et al. (2012) Characterization of thrombopoietin (TPO)-responsive progenitor cells in adult mouse bone marrow with in vivo megakaryocyte and erythroid potential. Proc Natl Acad Sci U S A 109 : 2364–2369. doi: 10.1073/pnas.1121385109 22308484
34. Ng AP, Kauppi M, Metcalf D, Hyland CD, Josefsson EC, et al. (2014) Mpl expression on megakaryocytes and platelets is dispensable for thrombopoiesis but essential to prevent myeloproliferation. Proc Natl Acad Sci U S A 111 : 5884–5889. doi: 10.1073/pnas.1404354111 24711413
35. Pronk C, Rossi D, Mansson R, Attema J, Norddahl G, et al. (2007) Elucidation of the phenotypic, functional, and molecular topography of a myeloerythroid progenitor cell hierarchy. Cell Stem Cell 1 : 428–442. doi: 10.1016/j.stem.2007.07.005 18371379
36. Smyth GK (2004) Linear models and empirical bayes methods for assessing differential expression in microarray experiments. Stat Appl Genet Mol Biol 3: Article3. 16646809
37. Majewski I, Ritchie M, Phipson B, Corbin J, Pakusch M, et al. (2010) Opposing roles of polycomb repressive complexes in hematopoietic stem and progenitor cells. Blood 116 : 731–739. doi: 10.1182/blood-2009-12-260760 20445021
38. Ritchie ME, Phipson B, Wu D, Hu Y, Law CW, et al. (2015) limma powers differential expression analyses for RNA-sequencing and microarray studies. Nucleic Acids Res.
39. Wu D, Lim E, Vaillant F, Asselin-Labat ML, Visvader JE, et al. (2010) ROAST: rotation gene set tests for complex microarray experiments. Bioinformatics 26 : 2176–2182. doi: 10.1093/bioinformatics/btq401 20610611
40. Birger Y, Goldberg L, Chlon TM, Goldenson B, Muler I, et al. (2013) Perturbation of fetal hematopoiesis in a mouse model of Down syndrome's transient myeloproliferative disorder. Blood 122 : 988–998. doi: 10.1182/blood-2012-10-460998 23719302
41. Malinge S, Bliss-Moreau M, Kirsammer G, Diebold L, Chlon T, et al. (2012) Increased dosage of the chromosome 21 ortholog Dyrk1a promotes megakaryoblastic leukemia in a murine model of Down syndrome. J Clin Invest 122 : 948–962. doi: 10.1172/JCI60455 22354171
42. Hewitt C, Carmichael C, Wilkins E, Cannon P, Pritchard M, et al. (2007) Multiplex ligation-dependent probe amplification (MLPA) genotyping assay for mouse models of down syndrome. Front Biosci 12 : 3010–3016. 17485278
43. Shi W, Oshlack A, Smyth GK (2010) Optimizing the noise versus bias trade-off for Illumina whole genome expression BeadChips. Nucleic Acids Res 38: e204. doi: 10.1093/nar/gkq871 20929874
44. Ritchie ME, Diyagama D, Neilson J, van Laar R, Dobrovic A, et al. (2006) Empirical array quality weights in the analysis of microarray data. BMC Bioinformatics 7 : 261. 16712727
45. Smyth GK, Michaud J, Scott HS (2005) Use of within-array replicate spots for assessing differential expression in microarray experiments. Bioinformatics 21 : 2067–2075. 15657102
46. Liao Y, Smyth GK, Shi W (2013) The Subread aligner: fast, accurate and scalable read mapping by seed-and-vote. Nucleic Acids Research 41.
47. Liao Y, Smyth GK, Shi W (2014) featureCounts: an efficient general purpose program for assigning sequence reads to genomic features. Bioinformatics 30 : 923–930. doi: 10.1093/bioinformatics/btt656 24227677
48. Robinson MD, McCarthy DJ, Smyth GK (2010) edgeR: a Bioconductor package for differential expression analysis of digital gene expression data. Bioinformatics 26 : 139–140. doi: 10.1093/bioinformatics/btp616 19910308
49. Robinson MD, Oshlack A (2010) A scaling normalization method for differential expression analysis of RNA-seq data. Genome Biology 11.
50. Law CW, Chen YS, Shi W, Smyth GK (2014) voom: precision weights unlock linear model analysis tools for RNA-seq read counts. Genome Biology 15.
51. Carmichael CL, Majewski IJ, Alexander WS, Metcalf D, Hilton DJ, et al. (2009) Hematopoietic defects in the Ts1Cje mouse model of Down syndrome. Blood 113 : 1929–1937. doi: 10.1182/blood-2008-06-161422 19109561
Štítky
Genetika Reprodukční medicínaČlánek vyšel v časopise
PLOS Genetics
2015 Číslo 5
Nejčtenější v tomto čísle
- Drosophila Spaghetti and Doubletime Link the Circadian Clock and Light to Caspases, Apoptosis and Tauopathy
- Autoselection of Cytoplasmic Yeast Virus Like Elements Encoding Toxin/Antitoxin Systems Involves a Nuclear Barrier for Immunity Gene Expression
- Parp3 Negatively Regulates Immunoglobulin Class Switch Recombination
- PERK Limits Lifespan by Promoting Intestinal Stem Cell Proliferation in Response to ER Stress