
Linkage and Association Mapping of Flowering Time in Nature
Flowering time is a key life-history trait in the plant life cycle. Most studies to unravel the genetics of flowering time in Arabidopsis thaliana have been performed under greenhouse conditions. Here, we describe a study about the genetics of flowering time that differs from previous studies in two important ways: first, we measure flowering time in a more complex and ecologically realistic environment; and, second, we combine the advantages of genome-wide association (GWA) and traditional linkage (QTL) mapping. Our experiments involved phenotyping nearly 20,000 plants over 2 winters under field conditions, including 184 worldwide natural accessions genotyped for 216,509 SNPs and 4,366 RILs derived from 13 independent crosses chosen to maximize genetic and phenotypic diversity. Based on a photothermal time model, the flowering time variation scored in our field experiment was poorly correlated with the flowering time variation previously obtained under greenhouse conditions, reinforcing previous demonstrations of the importance of genotype by environment interactions in A. thaliana and the need to study adaptive variation under natural conditions. The use of 4,366 RILs provides great power for dissecting the genetic architecture of flowering time in A. thaliana under our specific field conditions. We describe more than 60 additive QTLs, all with relatively small to medium effects and organized in 5 major clusters. We show that QTL mapping increases our power to distinguish true from false associations in GWA mapping. QTL mapping also permits the identification of false negatives, that is, causative SNPs that are lost when applying GWA methods that control for population structure. Major genes underpinning flowering time in the greenhouse were not associated with flowering time in this study. Instead, we found a prevalence of genes involved in the regulation of the plant circadian clock. Furthermore, we identified new genomic regions lacking obvious candidate genes.
Published in the journal:
. PLoS Genet 6(5): e32767. doi:10.1371/journal.pgen.1000940
Category:
Research Article
doi:
https://doi.org/10.1371/journal.pgen.1000940
Summary
Flowering time is a key life-history trait in the plant life cycle. Most studies to unravel the genetics of flowering time in Arabidopsis thaliana have been performed under greenhouse conditions. Here, we describe a study about the genetics of flowering time that differs from previous studies in two important ways: first, we measure flowering time in a more complex and ecologically realistic environment; and, second, we combine the advantages of genome-wide association (GWA) and traditional linkage (QTL) mapping. Our experiments involved phenotyping nearly 20,000 plants over 2 winters under field conditions, including 184 worldwide natural accessions genotyped for 216,509 SNPs and 4,366 RILs derived from 13 independent crosses chosen to maximize genetic and phenotypic diversity. Based on a photothermal time model, the flowering time variation scored in our field experiment was poorly correlated with the flowering time variation previously obtained under greenhouse conditions, reinforcing previous demonstrations of the importance of genotype by environment interactions in A. thaliana and the need to study adaptive variation under natural conditions. The use of 4,366 RILs provides great power for dissecting the genetic architecture of flowering time in A. thaliana under our specific field conditions. We describe more than 60 additive QTLs, all with relatively small to medium effects and organized in 5 major clusters. We show that QTL mapping increases our power to distinguish true from false associations in GWA mapping. QTL mapping also permits the identification of false negatives, that is, causative SNPs that are lost when applying GWA methods that control for population structure. Major genes underpinning flowering time in the greenhouse were not associated with flowering time in this study. Instead, we found a prevalence of genes involved in the regulation of the plant circadian clock. Furthermore, we identified new genomic regions lacking obvious candidate genes.
Introduction
Flowering time is a major trait in the plant's life cycle, as it corresponds to the transition from the vegetative growth phase to the reproductive phase. At flowering, resources accumulated in storage tissues during the vegetative growth phase are reallocated to the production of seeds. Optimizing reproduction requires that the flowering date matches environmental conditions so that seeds can mature and disperse when conditions are appropriate. Natural variation in flowering time is related to latitude in many species [1]–[5], suggesting that factors such as photoperiod and temperature, that vary over large geographical scales, are likely involved in selecting for this trait. At the same time, environmental factors such as herbivory that act on a smaller spatial scale have been implicated [6]. Flowering time is, thus, a complex trait shaped by selective pressures acting on very different spatial scales.
A major goal in evolutionary biology is to identify the genetic basis of adaptive trait variation. For flowering time, many such studies have focused on the model species Arabidopsis thaliana. This species is a convenient choice because it is an annual plant with a worldwide distribution and, as such, encounters a variety of ecological conditions. Not surprisingly, diverse flowering time phenotypes have been described that likely result from different selective events across its range [3], [7]. In A. thaliana, flowering time is regulated by a complex genetic network composed of four main converging pathways [8]: the vernalization pathway, the photoperiod pathway, the autonomous pathway and the gibberellin pathway. These pathways integrate environmental and physiological factors such as photoperiod variation, ambient temperature, vernalization, and plant growth in order to trigger the transition to flowering at an appropriate time [9].
Most studies aiming to unravel the genetics of flowering time variation were performed in greenhouse conditions [10 for a complete review]. The polymorphisms revealed in such studies are likely to be, at least in part, specific to greenhouse conditions that plants do not experience in nature. For example, Weinig et al. [11] used a recombinant inbred line (RIL) family to show that a substantial number of quantitative trait loci (QTL) detected in natural conditions could not be detected under controlled conditions. In Li et al. [12], another RIL family was phenotyped in growth chambers simulating climatic conditions in Sweden or Spain and significant QTL×environment interactions were found. Ecologically realistic conditions expose plants to a great number of signals from their environment; this might lead to the identification of genes other than those responsible for flowering time variation under greenhouse conditions.
Conventional linkage mapping can be an effective tool for identifying genes underlying natural variation. However, the genes identified by this method are restricted to the ones segregating in the cross under consideration. Genome-wide association (GWA) mapping overcomes this limitation, and has recently been shown to successfully reveal common variants responsible for the variation in 107 phenotypes in a set of A. thaliana natural accessions [13]. However, GWA mapping suffers from the limitation that it generates false positives due to population structure [14]–[16]. As shown in Atwell et al. [13], the expected false positive rate varies greatly depending on the phenotype. Flowering time-related phenotypes, for example, exhibit the highest number of significant associations across a range of thresholds, and most likely include a high number of false positives due to clear geographical structure in these phenotypes. Statistical methods to control for population structure have been developed to reduce the inflation of false positives associations [13], [17], [18], but an alternative is the complementary use of traditional linkage mapping in controlled crosses and the use of near-isogenic lines [10], [18], [19]. The complementarity of GWA mapping and classical linkage mapping was particularly well demonstrated in a mouse GWA mapping study where the Lasc1 gene, suggested by GWA to be a functional element associated with susceptibility to lung tumors, could not be validated in two independent intercross mouse populations containing both Lasc1 alleles [20].
The aim of this study is to identify the polymorphisms underlying natural variation of flowering time in A. thaliana. To achieve this objective, we phenotyped nearly 20,000 plants over 2 winters under field conditions, including 197 worldwide natural accessions, 4366 RILs derived from 13 independent crosses chosen to maximize genetic and phenotypic diversity [21], and near-isogenic lines (NILs) derived from one of the 13 RIL families. The use of 4366 RILs provides unprecedented power for dissecting the genetic architecture of flowering time in A. thaliana. Additional resolution is achieved by combining GWA statistical methods that control for population structure with coarse mapping using RILs and NILs. Together, these methods enhance our ability to distinguish true from false associations finely mapped by GWA mapping. Flowering time-related pathways are some of the best-characterized genetic networks in plants; we, thus, made use of this information to validate our method by detecting candidate genes determined a priori.
More than 60 additive QTLs, all with relatively small to medium effects, were detected in the field experiment. QTLs found by linkage mapping efficiently validate GWA results. Regions of the genome validated by QTLs are clearly enriched with highly associated SNPs as compared to the rest of the genome. This allows us to propose a list of candidate genes, most of which have never or rarely been detected to be associated with natural variation in flowering time under laboratory conditions [13].
Results
Natural variation of flowering time in ecologically realistic conditions
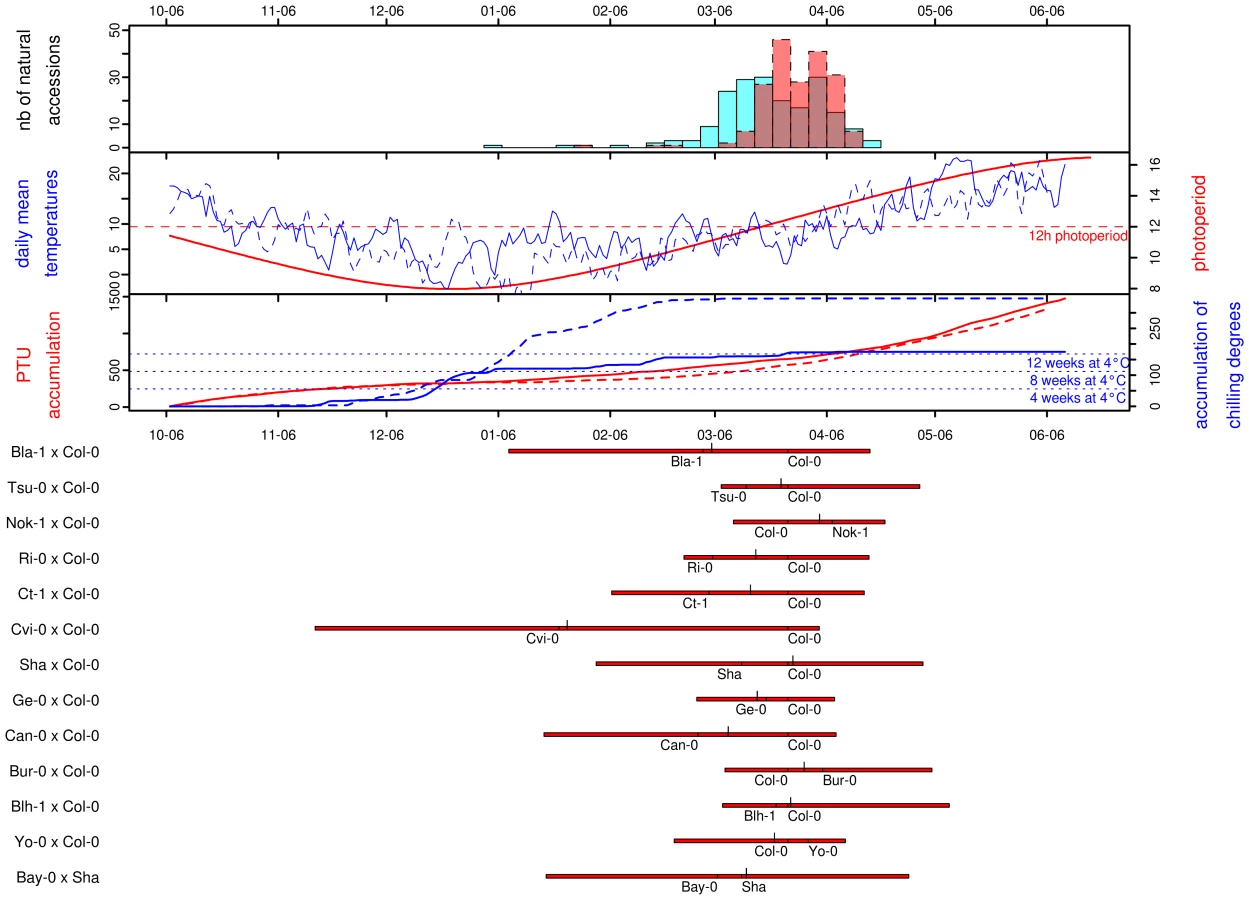
Photothermal time is a temporal measure that integrates climatic conditions. Because flowering time may result from sensing climatic cues in A. thaliana, flowering time was scaled in photothermal units (PTU) using a phenology model that integrates both photoperiod length and temperature. To test the hypothesis that photothermal time is a better predictor of flowering time than Julian days [22], we grew 192 accessions in a field experiment over 2 consecutives winters. General patterns of daily mean temperature, daily photoperiod, accumulation of PTU, and accumulation of chilling degrees are presented for both years in Figure 1. In both years, the first natural accession (Pa-1 from Sicilia) flowered when photoperiod started to increase under short day conditions (∼8h and ∼9h photoperiod in the 2007/08 and 2008/09 experiments respectively). The last accessions (i.e. originating from Scandinavian regions) flowered when photoperiod reached approximately 14h photoperiod in both years (respectively on the 2008/04/19 and 2009/04/15), with the flowering peak occurring at around 12h photoperiod. The temperature curves indicate that plants endured much colder temperatures, over a longer period during winter 2008/2009 than during the previous year. January 2009 was continuously colder (mean temperature = 1.11°C) than January 2008 (mean temperature = 6.66°C); natural accessions therefore accumulated more chilling degrees (i.e. temperatures considered to vernalize the plant efficiently), and slightly less PTU during the second year. Accessions flowered later during the 2008/2009 experiment (median = March 28th 2009) compared with the 2007/2008 experiment (median = March 21th 2008) when flowering time is expressed in Julian days, although they accumulated less PTU (Figure 1).
A regression coefficient equal to 1 is expected if there is a perfect match of flowering time between the 2 years. This year-to-year comparison indicated that photothermal time seems to be a better predictor of flowering time than the number of Julian days (Figure S1): the regression coefficient for flowering time expressed in Julian days (slope = 0.63, CI = 0.60–0.65; intercept = 70.06, P<0.001; R2 = 0.93) is significantly smaller than the regression coefficient for flowering time expressed in PTU (slope = 0.89, CI = 0.85–0.93; intercept = −72.32, P<0.001; R2 = 0.91). Expressing flowering time in PTU improves the repeatability of the experiment, as the slope is closer to 1, but we can also note that the intercept for PTU is lower than zero. This earlier flowering when expressed in PTU might result from the colder period in January during the second year (2008/2009), resulting in a higher accumulation of chilling degrees in 2008/2009 compared to the 2007/2008 (Figure 1, see Discussion). Therefore, all flowering data from the set of 2007/2008 and 2008/2009 experiments were expressed in photothermal units (PTU).
Highly significant variation was observed among the set of 197 natural accessions (Table 1), with flowering time per accession averaging 457.37 PTU and ranging from 268.05 to 583.44 PTU (Figure S2). The distribution of flowering times for these natural accessions is roughly normal, mostly due to the transformation in photothermal units. When expressed in days, the distribution is L-shaped with a tail of early-flowering accessions (Figure 1). The shape of this distribution contrasts with other observations made for 16 flowering time related traits scored in various constant greenhouse conditions for the same set of natural accessions used in our study. In particular, Atwell and colleagues [13] found that a range of conditions including both long and short days combined with and without vernalization resulted in flowering related traits with either bimodal distributions or with L-shaped distributions containing a tail of late-flowering accessions. These 16 flowering time related traits scored in constant greenhouse conditions are more correlated with one another than with flowering time scored in our study [13].

A significant positive relationship was found between flowering time and latitude (Figure S3; latitude regression coefficient ± SE = 3.19±0.40, P<0.0001). As previously noted [3], functionality at the flowering time gene FRIGIDA affected this positive relationship: accessions carrying a functional allele at FRI revealed a stronger latitudinal cline in flowering time (Table 1 in Dataset S1; latitude regression coefficient ± SE = 3.33±0.54, P<0.001) relative to accessions bearing a non-functional allele of FRI (latitude regression coefficient ± SE = 2.28±0.59, P<0.001). Indeed, the presence of this latitudinal cline in accessions carrying a non-functional allele was primarily due to Cvi-0, from the Cape Verde Islands, which is an outlier in the latitudinal distribution; if this outlier is removed, the relationship is no longer significant (latitude regression coefficient ± SE = 1.16±0.69, P = 0.097).
The parents of the RILs showed flowering times averaging 433.29 PTU and ranging from 291.83 (Cvi-0) to 517.10 PTU (Nok-3). These values span the distribution of natural accessions (Figure S2). Variation among the RIL parental lines covered 71.43% of the range observed among the 197 natural accessions. Twelve accessions are common to the parental lines and the natural accessions. Even though seeds from parental lines and natural accessions were produced in different environments, a highly significant correlation was observed for flowering time between these groups (Pearson correlation coefficient = 0.99, P<0.0001), suggesting that maternal effects do not impact flowering time in this study. The late-flowering behavior of the lab reference strain Col-0 (in our experiment 66.33% of all accessions flowered earlier than Col-0) is consistent with the results of Wilczek et al. [22], although it is generally described as an early-flowering accession when phenotyped under common laboratory conditions [13].
Highly significant variation for flowering time was observed among RILs within each RIL family (Figure S2, Table 2 in Dataset S1), with heritability of flowering time in RIL families averaging 0.82 and varying from 0.70 to 0.94 (Table 1). The range of observed flowering times among the 4366 RILs exceeds that observed among the 197 natural accessions at both sides of the distribution (Figure S2 and Figure S4). This was mainly due to significant extensive phenotypic transgression observed for each RIL family. Interestingly, only individuals from the RIL family Cvi-0×Col-0 started flowering under decreasing photoperiod. The intensity of phenotypic transgression was not related to the genetic relatedness of the corresponding parental lines (regression coefficient = −1.068, P = 0.957).
Genetic architecture of flowering time
Sixty-two additive QTLs and 16 epistatic interactions were detected among the 13 RIL families (Tables 3 and 4 in Dataset S1, Figure S5), with each RIL family contributing between 2 (Ri-0×Col-0) and 8 (Bay-0×Shahdara) additive QTLs. The percentage of genetic variation explained by additive and epistatic QTLs in these RIL families averaged 66.46% and ranged from 39.71% (Blh-1×Col-0) to 78.5% (Yo-0×Col-0) (Figure 2). Each of the 8 additive QTLs detected in the Bay-0×Shahdara RIL family could be validated by 1 to 6 independent pairs of NILs, known as Heterogeneous Inbred Families (HIFs) (Figure 3, Tables 5 and 6 in Dataset S1), suggesting that additive QTLs detected by the mixed-model composite interval mapping approach are largely true positives. When more than one HIF was available, the allelic effect of each allele was consistent, except for QTL5.11 (Figure 3). In this case, a delay in flowering was associated with the Shadhara allele in HIF397 but with the Bay-0 allele in HIF48. Because QTL5.11 has been found to be in epistasis with another additive QTL (Figure 3: QTL5.16, Table 5 in Dataset S1), this inconsistency might be a consequence of the genetic background.


Given the large population size of each RIL family and the high heritability associated with flowering time, we were able to detect QTLs that account for a small percentage of phenotypic variation within each RIL family. The percentage of phenotypic variation explained by an additive QTL averaged 9.08% and ranged from below 1% (Tsu-0×Col-0, Ct-1×Col-0 and Bay-0×Shahdara) to 45.6% (Cvi-0×Col-0) (Figure 4). In a comparison of the 12 RIL families that have Col-0 as a common parental line, we found that the additive effects of Col-0 alleles range, in absolute values, from 4.19 to 48.09 photothermal units. As expected from the transgressive segregation observed within each RIL family, the distribution of the effects of the Col-0 allele is clearly bimodal, the first mode corresponding to QTLs having negative effects (the Col-0 allele makes plant flower earlier), and the second mode corresponding to QTLs having positive effects (the Col-0 allele makes plant flower later). A less stringent significance level for QTL detection and QTL effects (P = 0.10) did not affect the bimodal distribution of the Col-0 allele effects. Among the 54 additive QTLs detected in these 12 RIL families, 19 have negative effects (∼35.2%) and 35 have positive effects (∼64.8%).

Sixteen epistatic interactions were detected in 10 out of 13 RIL families, with each RIL family contributing 1 to 3 pairs of interacting QTLs. Epistatic interactions mainly involved QTLs with single-locus effects (10/16); only 1 epistatic interaction (Nok-1×Col-0) involved 2 QTLs without single-locus effects. The amount of phenotypic variation explained by epistatic QTLs ranged from 3.42 to 13.23 PTU. The proportion of phenotypic variation explained by these interactions averaged 2.42% and ranged from 0.09% to 7.8%; this is lower than the proportion of phenotypic variation explained by additive QTLs (Figure 2).
Our results were compared to those obtained for 5 RIL families common between this study and one by Simon et al. [23] (Blh-1×Col-0, Bur-0×Col-0, Ct-1×Col-0, Cvi-0×Col-0 and Shahdara×Col-0) by reanalyzing the flowering time data. Among those 5 RIL families, Simon et al. [23] found 22 additive QTLs when phenotyping plants under long days in a greenhouse experiment after a seeds vernalization period of 3 weeks. In the present study, considering the same 5 RIL families, 26 additive QTLs were detected, of which 10 (∼39%) have support intervals that overlap with support intervals of QTLs found in Simon et al. ([23], Table 7 in Dataset S1). Although the direction of the Col-0 allelic effect is consistent for all overlapping QTLs (Table 7 in Dataset S1), large differences in the predicted genetic position were observed for overlapping QTLs (mean = 3.44 cM±5.18 cM). This last result indicates that one cannot rule out different genetic bases for overlapping QTLs (see subsection Combining GWA mapping and traditional linkage mapping).
Population structure and minor allele frequency dependence
The p-value distribution from the Wilcoxon rank-sum analyses showed an excess of low p-values, suggesting a potentially high rate of false positive associations. As expected for an excess of low p-values due to confounding by population structure, a mixed model approach that takes genetic similarity among natural accessions into account (EMMA method, ) effectively eliminated the excess of low p-values. While it might be tempting to consider p-values that remain extreme after EMMA correction as true associations, we need to keep in mind that minor allele frequency (MAF) also influences p-values [13], [24]. EMMA demonstrates enrichment in low p-values for rare alleles, whereas the Wilcoxon test showed weak power to detect associations for SNPs with low MAF (Figure S7). Comparison of the distribution of the p-values obtained by EMMA to a theoretical uniform distribution showed that the confounding remaining after the correction for population structure is likely to come from the bias due to rare alleles (Figure S6). Therefore, following Kang et al. [24], only SNPs with MAF>10% were considered further.
Combining GWA mapping and traditional linkage mapping
We initially inspected our data by identifying genomic regions in which highly significant SNPs within 20 kb of known a priori candidate genes for flowering time overlapped with QTL regions. These plots revealed several interesting features (additive QTLs: Figure 5 and Figure S8; epistatic QTLs: Figure S9). First, the 62 additive QTLs identified in the 13 RIL families are organized in 5 major clusters: cluster 1 is at the end of chromosome 1, cluster 2 is at the top of chromosome 4, cluster 3 is near the centromeric region of chromosome 4 (Figure 5), cluster 4 is at the beginning of chromosome 5, and cluster 5 is at the end of chromosome 5. In a similar field experiment, QTLs belonging to clusters 1, 3, and 5 have also been found in the Columbia×Landsberg erecta RIL family when scored for bolting time in fall in North Carolina and Rhode Island [11]. Second, allelic effects for QTLs in clusters 1, 2, and 5 were consistent among RIL families, whereas allelic effects for QTLs in clusters 3 and 4 were not. Third, p-values for SNPs within QTL regions were significantly smaller than p-values for SNPs located outside QTL confidence intervals; this was true for both the EMMA method (Kruskall-Wallis chi-squared = 23.30, P<0.001) and the Wilcoxon test (Kruskall-Wallis chi-squared = 71.64, P<0.001). Fourth, it was common for several association peaks to aggregate within a QTL region (Figure 5). Finally, as illustrated by the centromeric region of chromosome 1 (see Figure S8), some association peaks detected by the Wilcoxon test that are strongly associated with flowering time and fall within QTL regions were poorly associated when using the EMMA method; this result suggests the existence of false negatives after controlling for population structure.

Enrichment of candidate genes for highly significant associations validated by QTLs
We investigated the number of top SNPs that can be considered as true associations by looking at the enrichment ratios for progressively larger sets of top SNPs (Figure 6). The enrichment ratio for top SNPs validated by QTLs never differed from what would be expected randomly. This result underlines the fact that QTLs detected using the RILs are far too coarse to be informative by themselves. For top SNPs within 20 kb of candidate genes, the enrichment ratio dropped with the number of top SNPs, demonstrating that candidate genes are overrepresented among top-ranking SNPs. The enrichment ratio was clearly increased for SNPs close to candidate genes and overlapped by QTLs. For the 50 top SNPs, consideration of candidate genes overlapped by QTLs almost doubled the enrichment ratio relative to consideration of all candidate genes (7.4 vs 4.1). This suggests that combining QTLs with candidate genes is much more informative than using either approach separately.

Patterns are more difficult to interpret when not controlling for population structure. Indeed, enrichment in SNPs validated by both candidate genes and QTLs in the Wilcoxon analysis did not differ significantly from random, in particular for small sample sizes, indicating that a large proportion of the best associations are likely to be false positives (Table 8 in Dataset S1, Figure S10). Based on the results from EMMA, we consider the 500 top SNPs from both EMMA and Wilcoxon for plausible associations with candidate genes. This sample size corresponds to the limit of significance of enrichment ratio in EMMA (Figure 6).
Plausible associations
Forty-two candidate genes, out of a list of 282 a priori candidate genes, were detected (Table 2). Among these, only 4 were detected with both EMMA and Wilcoxon, and were confirmed by a QTL: TSF, AT4G23340, ELF5, and ETC3. Eleven genes were detected with EMMA only and were overlapped by QTLs: TOC1, ATHAP2B, YAP169, LD, FCA, PHYD, AT2G39540, KIN1, CDF3, KIN2, and COL1. Ten genes were detected with Wilcoxon only and were overlapped by QTLs: SRR1, AT5G59570, FY, GA1, MMP, ATGA2OX7, LKP2, CUL4, DDF1, and FPA, suggesting that they are potentially false negatives generated by EMMA. These 10 genes represent a large fraction (i.e. 40%) of the 25 genes overlapped by QTLs. Finally, 17 candidate genes (40%) were detected by EMMA and/or Wilcoxon but were not overlapped by QTLs, suggesting that they are potentially false positives.

Seventeen of these associated candidate genes were found for at least one of the 16 flowering time-related greenhouse phenotypes measured by 6 different teams, in different greenhouse conditions, and published in Atwell et al. (Table 9 in Dataset S1, [13]). Among these candidate genes, only 9 are supported by QTL confidence intervals.
FRI functionality did not associate significantly with the flowering time measured in the field over winter (with EMMA, −log10 p-value<2.4 in a 20 kb region on both side of FRI). To control for allelic heterogeneity [13], the GWA mapping analyses were also performed separately for accessions carrying functional FRI alleles and non-functional alleles (‘Ler’ allele or ‘Col’ allele). However, associations within a 40 kb window centered on FRI were not improved, and the maximum −log10 p-values using EMMA were 2.3 and 2.2 for the ‘Ler’ and ‘Col’ alleles, respectively. This is consistent with our failure to validate a role for FRI in RIL families for which the parents were segregating for functional and non-functional alleles (Table 1 in Dataset S1). Furthermore, the QTLs detected at the beginning of chromosome 4 in the Bay-0×Shahdara family were validated by 6 independent HIFs (Figure 3 and Table 5 in Dataset S1). Those 6 HIF lines segregate for only one common region between 0.41 and 2.58 Mb, which does not overlap with FRI. In this genomic region, only ETC3, shown to have an effect on flowering development [25], was detected among the top SNPs in EMMA (rank = 163), and could therefore be proposed as a candidate gene for natural variation of flowering time. Two major FLC haplogroups (FLCA and FLCB) have previously been found to be associated with flowering time variation in A. thaliana under field conditions [26], but only in the presence of putatively functional FRI alleles. In this study, we first excluded 40 accessions with a weak or non-functional FLC allele from the analyses (Table 1 in Dataset S1). When taking into account population structure, no significant haplogroup effect was detected when considering all accessions with an active FLC allele (−log10 p-value = 0.07) or when considering accessions with both an active FLC allele and a functional FRI allele (−log10 p-value = 0.62). A haplogroup effect was similarly not detected in an outbred population of A. thaliana that was phenotyped for flowering time in growth chambers simulating fall conditions [27], [28]. As for FRI, the absence of a haplogroup effect is consistent with our failure to validate a role of FLC in RIL families for which the parents segregate for FLCA and FLCB (Table 1 in Dataset S1). PHYC, another gene believed to be important based on greenhouse experiments [29], was not significantly associated with flowering time, and no QTL has been found in RIL families whose parental lines are polymorphic for PHYC (Figure S8, Table 1 in Dataset S1).
Flowers et al. [30] sequenced 52 candidate genes for flowering time in 24 natural accessions, all with the exception of Kas-2 were included in our 184 natural accessions used for GWA mapping analysis. Among these 52 genes, 5 are included in the set of 25 genes detected by GWA and overlapped by QTLs in our study: TSF, ELF5, LD, PHYD, and GA1. In ELF5, 3 common non-synonymous polymorphisms were detected among the 24 accessions sequenced by Flowers et al. [30]. The top SNP associated with flowering time in our study and close to ELF5 (Chromosome 5, position = 25,175,269bp) is in strong linkage disequilibrium (LD) (r2 = 0.82, Fisher's exact test: P<0.001) with the polymorphism responsible for the change of the amino-acid (AA) in position 503 (Ala→Thr). The Alanine residue in position 503 is conserved in the ELF5 orthologous gene in Arabidopsis lyrata, suggesting that the Threonine residue is the derived state (The Arabidopsis lyrata genome project, http://genome.jgi-psf.org/Araly1/Araly1.home.html). LD between the significant marker and the other two polymorphisms (AA in position 364 and 393) are not significant (respectively, r2 = 0.38, P<0.027; and r2 = 0.07, P<0.526). AA in position 393 is in complete LD with SNP markers at positions 25,167,440 and 25,168,305 on chromosome 5 that were not found to be associated with flowering time. Unfortunately, the two RIL family founders that are common with Flowers et al.'s set of accessions, i.e. Cvi-0 and Ct-1, are not polymorphic for those 3 common ELF5 non-synonymous polymorphisms. For PHYD, GA1, and LD, no significant LD was found between common non-synonymous polymorphisms detected by Flowers et al. [30] and the top SNPs detected in our study. In TSF, only 4 rare non-synonymous polymorphisms were found, making their detection by GWA mapping unlikely. Whereas QTLs detected in the RIL families Cvi-0×Col-0 and Ct-1×Col-0 did overlap with TSF, no amino-acid change was found between the founders. Recently, a causal polymorphism mediating natural variation in flowering time has been identified in the promoter of the closest homolog of TSF, FLOWERING LOCUS T [31], suggesting that the causal polymorphisms in TSF might also be located in its promoter region.
Regions overlapped by QTLs but presenting no obvious candidate were graphically checked for neat association peaks in the EMMA and the Wilcoxon outputs. Nine regions showing neat peaks were selected and checked for obvious candidate genes that might have been missed when establishing our list of 282 a priori candidate genes (Table 10 in Dataset S1, Figure 7). Among those regions, only the region of 20 kb around position 18,617,347 on chromosome 5 included two genes of potential interest: DOG1 involved in the dormancy processes and SAG12 associated with leaf senescence. No obvious candidates were found in the other 8 regions, even when those regions were expanded to 50 kb (Figure 7).

Discussion
Natural variation and genetic architecture
In our simple model, photothermal units (PTU) significantly outperformed Julian days in terms of the reproducibility of the measure of flowering time. We chose to keep our model simple, rather than applying the genetically informed model of Wilczek et al. [22] that includes information about flowering requirements, such as critical day length, temperature, and winter chilling temperatures during vernalization. While consideration of vernalization could improve our photothermal model, the vernalization requirements are difficult to address for three reasons. First, the amount of vernalization required is likely to vary among natural accessions according to both the length of period to cold exposure [32] and the vegetative stage at which plants are exposed to cold [33, personal observation, F. Roux]. Second, Shindo et al. [32] showed that levels of FLC, a floral repressor responsive to vernalization that decreases with vernalization and thus releases initiation of flowering, may return to initial expressions levels when vernalization is not saturated. In our experiment, temperatures fluctuated within years such that cold exposure was not constant (Figure 1). This succession of vernalizing and non-vernalizing temperatures is very different from what plants may experience in growth chambers, and FLC expression may be reactivated when temperatures transitionally reach non-vernalizing levels. Third, compensatory effects between the different pathways determining flowering time have been showed in A. thaliana and in other plant species [34], [35], particularly between the photoperiod and the vernalization pathway. In the iteroparous herb Beta vulgaris ssp. maritima, a linear relationship was found between the photoperiod on flowering date and the vernalization duration; i.e. extra vernalization allowed the plants to flower under a shorter photoperiod [35]. In our experiment, plants flowered with fewer PTU in 2008/2009 than in 2007/2008, although they flowered slightly later in the season. This result suggests that other mechanisms might have compensated for the lack of accumulated PTU, such as stronger vernalization in 2008/2009. In these conditions, it is very difficult to make any assumptions about the amount of vernalization required for each natural accession but this possible explanation certainly deserves further exploration.
Great variability in flowering time was observed among the 14 accessions that served as parents in the RILs. This is not surprising because parents were chosen to maximize genetic and phenotypic diversity observed under greenhouse conditions [21]. An interesting point about these 14 crosses is the amount of transgressive segregation observed in each of the RILs. Transgression, defined as the generation of extreme phenotypes relative to the parental lines, could have originated due to 3 different phenomena [36]: (i) Expression of over - or under-dominance; (ii) epistatic interactions; or (iii) the complementarity of additive alleles that are dispersed between the parental lines. The first phenomenon is unlikely due to the low residual heterozygosity expected after 5–6 generations of selfing in the RILs. While epistatic interactions have been detected in some RIL families, the epistatic genetic variance is low compared to the additive genetic variance. This suggests that the transgression detected in this study most likely originates from the recombination of alleles with opposite effects. The absence of a negative relationship between the intensity of phenotypic transgression and the genetic relatedness between pairs of founders is inconsistent with the observed phenotypic transgression resulting from the break up of population structure but rather suggests that natural accessions contain locally co-adapted gene complexes. The absence of a negative relationship between the intensity of phenotypic transgression and the genetic relatedness between pairs of founders has also been found for 3 flowering time related traits in maize (data not shown; [37]). Assessing the extent of transgression in different species, and different traits that show contrasting patterns with regard to population structure, is needed to allow generalization about the cause of transgressive segregation.
The use of 4,366 RILs divided into 13 families provides a great opportunity to almost completely dissect the genetic architecture of flowering time in A. thaliana under our field conditions. Our field study revealed many QTLs of relatively moderate effect. This environmental dependence of the distribution of QTL effects might originate from the relatively larger number of environmental signals in outdoor conditions as compared to the greenhouse. The QTLs detected in the present study are nevertheless of greater effect than the QTLs detected in field trials on 25 RIL families in maize [37], and in mice, flies, and humans [38]. Perhaps a genetic architecture of small-effect QTLs is favored in outcrossing species as a means of ensuring synchronous flowering among plants within a local population [37]. Selfing species such as A. thaliana, on the other hand, do not require synchronous flowering. A comparative assessment of FRI further suggests that selfing species can tolerate large QTL effects on flowering. While non-functional FRI alleles are associated with additive effects on flowering time of up to 19.7 days for A. thaliana in greenhouse conditions (B. Brachi and F. Roux, unpublished results; [28]) a length difference of 14 AAs between the 2 FRI variants detected in the self-incompatible species Arabidopsis lyrata only conferred an 8-day difference in flowering time when these variants were transformed into A. thaliana [39]. Additional comparative analyses of flowering time genes in species with varying reproductive systems are needed to test the generality of this pattern.
Advantages of combining association and traditional linkage mapping
The combination of linkage and association mapping clearly outperforms each method used in isolation. For example, QTL mapping increases our ability to distinguish true from false associations finely mapped by GWA mapping with a candidate gene enrichment of up to 7.4. This empirical result supports the notion that linkage and association mapping are complementary methods [20], [40]. Another advantage of a dual mapping strategy, rarely highlighted in the literature of GWA mapping, is related to the occurrence of false negatives. Controlling for population structure is necessary for reducing the false positive rate, but this approach also introduces false negatives. This may be a problem that is especially great for quantitative traits such as flowering time, the variation of which overlaps with population structure. While GWA mapping analyses on a less structured sample of natural accessions may solve this problem, it may also prevent detection of the genetic basis of natural variation occurring at the scale of the species. In contrast, our study shows that the use of QTL mapping in combination with GWA mapping on a worldwide sample of natural accessions may be an excellent alternative for detecting false negatives. In this study, 40% of the detected candidate genes overlapped by QTLs could be considered to be false negatives when analyzed by EMMA. We hypothesized that such a large fraction of false negatives could also occur for traits with a strong correlation between genetic relatedness and phenotypic similarity, for example, latitude related phenotypic traits like cold tolerance or relative growth rate [41]. A potential benefit of dual linkage and association mapping would be narrowing QTL intervals in RIL families. This might be achieved by using recently developed plant material such as advanced intercross RILs (AI RILs) [42] or multiple advanced generation inter-cross (MAGIC) lines, which would allow QTL intervals to be narrowed down to 300 kb [43]. On the other hand, the ongoing 216,509 SNP genotyping of the 14 parental lines will soon enable the nested association mapping (NAM) strategy to be undertaken [44]. Projecting the 216,509 SNP genetic information from parental lines onto the 4366 RILs included in this study will provide a powerful genetic resource for the scientific community. The joint analysis of data sets from the natural accessions and the 4366 RILs should greatly increase our power to finely map genomic regions associated with phenotypic variation.
Although flowering time is an easily scored quantitative trait, we must acknowledge that many other phenotypic traits will be challenging to score on 4,366 genetic lines. Two alternatives to phenotype a smaller number of lines while keeping enough statistical power to detect significant phenotype-genotype associations might be considered. First, we propose the use of the core-collections designed for every RIL family used in this study. Each core-collection contains 164 RILs and maximizes the genetic diversity and recombination observed within the RIL family of interest [23]. Second, the use of only 459 MAGIC lines might still provide a high enough resolution to fine map candidate genes within roughly 300kb [43].
Identifying genes associated with flowering time natural variation
A striking, but not unexpected, result is the limited overlap between the genomic regions detected in our field experiment and the genes detected under greenhouse conditions. Large QTL×environment interactions for flowering time have already been demonstrated with RILs grown either in (natural or simulated) outdoor conditions versus controlled conditions [11], [12]. Only the ETC3 and ATGA20X7 genes supported by QTL regions in this study have also been proposed as candidate genes for flowering time phenotypes in GWA mapping studies scored under greenhouse conditions [13]. It is important to note that different phenotypic traits (number of leaves, bolting date) have been used as proxies for flowering time in these other studies; although these traits are generally highly correlated, the virtual absence of overlap between genes detected among experiments might result, at least in part, from the identity of the phenotypic traits scored as flowering time. For example, both bolting date and flowering date were scored in this study for the 2008/2009 experiment. While these traits are highly correlated, GWA mapping analyses indicate specific genetic bases for the time between bolting and flowering (our unpublished results). Taken together, these results confirm a strong role of genotype by environment interactions for flowering time in A. thaliana and reinforce the idea that varying environmental signals may reveal new genetic loci associated with flowering time variation.
Many candidate genes identified in this study are related to the photoperiod pathway and, more specifically, to circadian clock-related genes (TOC1, CDF3, COL1, SRR1, AT5G59570, and LKP2). The enrichment in circadian clock-related genes is in agreement with the experimental demonstration in A. thaliana of a fitness advantage to plants with a clock period that matched the environment [45], [46]. A significant enrichment of differentially expressed circadian clock-related genes has been found between early - and late-flowering Capsella bursa-pastoris [47], a co-occurring species and close sister group of A. thaliana, hence suggesting a parallel evolution of similar regulatory differences. Compared to stable greenhouse conditions, the difference in the candidate genes identified in natural conditions might originate from the plants experiencing new and/or less predictable environmental signals in outdoor conditions, such as decreasing and increasing photoperiod length or day-to-day fluctuation in temperature or light quality. For example, TOC1, part of the central oscillator of the Arabidopsis thaliana circadian clock [48], is entrained by photoperiod and thermocycles [49] and this drives rhythmic outputs, including seasonal control of flowering. For the light input to the clock, LKP2 has been proposed as a candidate to serve as circadian photoreceptor [49], and SRR1 activity is required for normal oscillator function via phytochrome-B-mediated light signaling [50]. Recently, COL1 was found to be regulated by the circadian clock at warm temperatures [51]. Promoters of COL1 contains motifs required for cold induction and might be thus proposed as a thermoreceptor. LKP2 recognized COL1 with an LOV domain [52] suggesting that the light and temperature signaling pathways might interact with each other.
Natural polymorphisms altering flowering time have been functionally validated in greenhouse studies for several flowering time genes: CRY2, FRI, FLC, FLM, HUA2, PHYA, PHYB, PHYC, and PHYD [53]. With the exception of PHYD, none of these candidates was confirmed by GWA mapping in our field study. A polymorphism in PHYD was previously found to be associated with bolting time in both natural accessions and the MAGIC lines [10]. Flowers et al. [30] hypothesized that an excess of replacement polymorphisms in PHYD may reflect either a recent relaxation of the selective constraints on this gene or adaptation to some environments. The detection of PHYD by GWA-mapping tends to support the second hypothesis. Two explanations might explain the absence of associations of the other functionally validated genes in our genome scan. First, the causative mutation may be rare, thus decreasing the power to detect an association through GWA. This might be the case for the HUA2 loss-of-function allele, found only in a subset of lines [54], and CRY2 and FLM with accession-specific mutations [55], [56]. CRY2 is a particularly useful illustration of the ‘rare allele’ effect; a CRY2 point mutation conferring early flowering to plants grown in short photoperiods has only been detected in Cvi-0 in a worldwide survey [55], yet its importance is evident by a strong QTL in the Cvi-0×Col-0 RIL family in this study (bottom of chromosome 1). Second, the allelic effect might be sensitive to the environment, being determined by the timing of germination as demonstrated for FRI loss-of-function alleles [22]. In this example, a shift in germination date of a few days in early autumn (from mid - to late-September) cancelled the early-flowering phenotype associated with non-functional FRI alleles. Our failure to detect FRI in our study is consistent with the sowing period being performed in late September. Although this period coincides with natural germination flushes in A. thaliana populations in the North of France, it might be worth testing different germination dates.
GWA mapping has been shown to be powerful for detecting candidate genes associated with a quantitative trait [13]. On the other hand, GWA mapping should also be powerful at identifying genes that have not previously been described as candidates. In this study, 9 association peaks far from candidate genes and supported by QTL mapping and/or NILs were found to be associated with natural variation in flowering time. One of these association peaks has also been found by GWA mapping for different flowering time traits scored in the greenhouse [13]. DOG1 (DELAY OF GERMINATION 1), first described in seed dormancy processes [57], is close to this association peak and has been proposed as a new candidate gene for flowering time [13]. However, SAG12 (SENESCENCE-ASSOCIATED GENE 12), located 20 kb away from DOG1 and closer to the association peak, might be a better candidate flowering gene. Indeed, SAG12 accelerates rosette leaf senescence [58] and might induce early-flowering.
Functional validation of candidate genes found in this field experiment will certainly help complete our knowledge of the flowering time genetic network, as well as of the ecological and evolutionary significance of the genetic bases underlying flowering time natural variation. However we must keep in mind that functionally validating QTLs explaining less than 10%, as was the case for most of the QTLs detected in this study, might require appropriate genetic material like the Cre-lox transgenic lines developed for estimating a 9% fitness cost associated with the resistance gene RPM1 [59].
Materials and Methods
In this study, we combined genome-wide association (GWA) mapping based on 197 natural accessions genotyped for approximately 216,509 SNP markers (see section “Genome-Wide Association mapping”) with QTL mapping based on 13 RIL families for a total number of 4366 RILs. We also included 81 pairs of near-isogenic lines, and the parents of the RIL families. In total, 19,884 plants were phenotyped in a 2-year field experiment.
Plant material
Four different groups of plant material were used in this study:
Natural accessions
A worldwide set of 197 natural accessions were phenotyped for flowering time in order to perform GWA mapping. All the accessions are listed in Table 1 in Dataset S1 and have been described elsewhere [60]. To reduce maternal effects prior to phenotyping, natural accessions were grown for one generation during 2007 under controlled greenhouse conditions (16 h photoperiod, 20°C) at the University of Lille 1 and their seeds collected. Of these, 184 accessions were genotyped for 216,509 SNPs evenly spaced across the genome [61]. The design of the Affymetrix genotyping array and genotyping protocols have been detailed elsewhere [13].
RILs and parental lines
Thirteen RIL families, including a total of 4,366 RILs (mean per family ∼336, range: 223–456) were obtained from the Centre of Ressources Biologiques (CRB, INRA Versailles; Table 11 in Dataset S1). The creation of the 13 RIL families was based on 14 natural accessions (i.e. 14 parental lines, namely Bay-0, Bla-1, Blh-1, Bur-0, Can-0, Col-0, Ct-1, Cvi-0, Ge-0, Nok-1, Ri-0, Shahdara, Tsu-0 and Yo-0) issued from a core collection designed to maximize both the genetic and phenotypic diversity in A. thaliana [21]. All but one RIL family (Bay-0×Shahdara) share the same recurrent parent Col-0 (Table 1). RILs resulted from 2 generations of intercrosses, followed by 5–6 generations of single seed descent. RIL families were genotyped for ∼82 genetic markers (range: 69–90; Table 11 in Dataset S1). To reduce maternal effects, the seeds were produced in the same controlled environment [23]. Further details on the creation of the 13 RIL families are available at the following website, http://dbsgap.versailles.inra.fr/vnat/.
NILs
Major additive QTLs found in the Bay-0×Shahdara RIL family were confirmed in NILs, following the heterogeneous inbred families (HIFs) strategy [62]. All 81 HIFs used in this study were developed from individual F7 RILs of the Bay-0×Shahdara cross to segregate in a single and limited genomic region [63]. For each RIL, several seeds were sown and genotyped individually for markers across the segregating region (Table 5 in Dataset S1). One to three independent fixed plants for each allele (i.e. NILs; F8) were chosen and allowed to self-fertilize. Depending on the RIL, F9 seeds from one or two independent plants fixed for each allele were then phenotyped to identify the phenotypic effect of Bay-0 vs. Shahdara alleles in the segregating region. Every genomic region is covered by at least 2 independent HIFs. NIL seeds distributed by the CRB were produced in the same controlled environment as the RIL seeds.
Experimental design and growth conditions
2007–2008 field experiment
For the first year of the field experiment, a total of 18,696 plants were phenotyped for flowering time. The experiment was organized in three blocks, each block being an independent randomization of 1 replicate per RIL, 2 replicates per natural accession, 4 replicates per NIL and 7 replicates per parental line of the RIL families. Each block, thus, included 6232 plants.
Seeds were sown half a block per day between from 24–29 September 2007 on damp standard culture soil (Huminsubstrat N3, Neuhaus) in arrays of 66 individual wells (Ø4 cm, vol. ∼38 cm3) (TEKU, JP 3050/66). This period coincides with natural germination flushes in A. thaliana populations in the North of France (personal observation, F. Roux). The experiment included 95 arrays per block for a total of 285 arrays. Two control accessions, Bg-2 (early flowering) and Lov-5 (late flowering) were placed in the same positions within each array in order to correct for micro-environmental variation. Seeds were stratified for 4 days at 4°C in the dark, in order to promote germination, and 3 seeds were placed in each well. In each block, the remaining 38 wells were left empty.
After the 4-days cold treatment, plants were placed in the greenhouse to protect seeds from rainfall. The conditions mimicked the outdoor conditions (no additional light or heating). While in the greenhouse, the arrays were rotated every day in order to reduce micro-environmental variation: half a block was moved from one end of the greenhouse to the other. In this way, all the plants experienced the same set of conditions during their early development. Plants were watered daily and no fertilizer was added.
Germination was monitored daily and the number of seedlings in each well scored. Most of the germination occurred 3–5 days after the cold treatment. The germination date considered in all analyses is the date of the first germination that occurred in a well.
Seedlings were thinned to one per well (17 days after the cold treatment) when most of the seedlings had reached the 4-leaf stage. On the day they were thinned, arrays were placed outside in a common garden located at the University of Lille 1, France. The 3 blocks (each of 4×24 arrays stuck some on the others) were arranged at 2-m spacing in the common garden. The density of plants was 576 plants/m2. This density corresponds to natural densities that seeds may experience when they are dispersed far from the maternal plant [64]. Soil had been tilled so that arrays could be slightly buried. Because the bottom of the wells was pierced, roots were able to reach the soil easily. The plants were watered for a week to ease the acclimatizing to outdoor conditions. Vertebrate herbivores were excluded by two successive fences. Molluscicide (PhytorexJ, Bayer Jardin) was added around experimental blocks to prevent slug attacks. Insects (mainly Myzus persicae) were biologically controlled by planting Vicia faba and Tagetes patula seedlings among the experimental blocks.
Plants were monitored every 3 days (1 block per day) or when non-freezing temperatures allowed it. Flowering date was scored as the number of days between germination and the appearance of the first open flower. Most studies aiming at studying natural variation of flowering time in A. thaliana scored bolting date (differentiation of the inflorescence from the apical meristem) or rosette leaf number as proxies for flowering time [3], [11], [22], [65]. While bolting date indicates the initiation of the reproductive structures, flowering date clearly indicates the beginning of offspring production.
2008–2009 field experiment
Because climatic conditions vary annually at a specific geographical location, we re-grew a subset of plants in the following year to measure the reproducibility of flowering time scored in 2007–2008. For this second year of the field experiment, a total of 1188 plants were phenotyped for flowering time, including 6 replicates of 192 of the 197 accessions phenotyped in the 2007–2008 field experiment (see Table 1 in Dataset S1). The experimental design for the 2008–2009 experiment was exactly the same as for the 2007–2008 experiment. Seeds were sown on 24 September 2008, stratified for 4 days, and placed outside in the same common garden on 15 October 2008.
Data analysis
We aimed to predict flowering time using temporal measures that incorporate fluctuating climatic conditions (see Text S1). In this study, flowering time was scaled in photothermal units (PTU) using a phenology model that integrates both photoperiod length and temperature [66]:where PTT stands for “photothermal time” and is expressed in photothermal units (PTU, °C·daylight); g is the germination date; ft the flowering date; i spans the germination date to the flowering date, counting only the days with a mean temperature above 3°C; μb is the optimal base temperature (3°C) for the developmental rate of the natural accession Col-0 [67]; μi is the mean daily temperature during daylight and λi is the daily photoperiod as a proportion of 24 h.
Accumulation of chilling degrees was calculated as follows:where CHILLING stands for the accumulation of chilling degrees across the winter; μv is the threshold temperature below which vernalization occurs (i.e. 6°C, [22]); and μc is the mean daily temperature, counting only days with a mean temperature below 6°C.
Statistical analysis
Flowering time measured in units of PTT was analyzed with the general linear model (GLM) procedure in SAS9.1 (SAS Institute Inc., Cary, North Carolina, USA) according to the following model:where ‘mean’ is the constant, ‘block’ accounts for differences in micro-environment among the 3 experimental blocks, ‘genotype’ measures the effect of genetic background (i.e. “natural accession”, “RIL”, “parental line” and “NIL”), ‘block×genotype’ was only considered for parental lines and NILs, cov(Bg-2) and cov(Lov-5) are covariates that represent trait values obtained for each array for the control accessions and accounts for array effects within block, and ‘error’ is the residual term. For NILs, data obtained from each of the 2 independent fixed plants for each allele are represented by a ‘family’ factor nested within ‘genotype’. All factors were treated as fixed effects because levels of no factor were random samples from a population to which we intended to extrapolate.
Transforming data did not improve normality in the “natural accessions” data set, and did so in only a few RIL families. To be consistent across analyses of all plant groups, we chose not to transform any data sets. Least-square means were obtained for each “genotype” and were subsequently used for GWA and QTL mapping analyses. Broad sense heritabilities (H2) were estimated for the 13 RIL families from the mean square (MS) of GLM using the formula adapted from [68]. Phenotypic transgression was considered significant when the lowest or highest genetic value observed among RILs was more extreme than that observed for a parent, plus or minus twice the standard deviations [28], [69]. We estimated the intensity of phenotypic transgression for each RIL family by dividing the range of PTU values observed among RILs by the absolute difference of PTU between the corresponding parental lines. Kinship coefficients based on 189 informative SNPs [70] were used to calculate the genetic relatedness among the parental lines.
Genome-wide association mapping
GWA analyses were based on a subset of the 197 natural accessions included in the experiment (184 for the 2007–2008 experiment). Two different analyses were performed [13]. In the first analysis, a Wilcoxon rank-sum test was run to test the association between phenotypes and genotypes for each marker. The second analysis, EMMA [24], is based on a mixed model that includes a matrix of genotype similarity among the accessions to control for population structure [13]. EMMA uses the following mixed model:where Y is the vector of flowering time, X the vector of flowering time, β is the fixed phenotypic effect for the locus tested, and u∼Nn(0, K) and ε∼Nn(0, I) are random effects meant to capture the variance due to background genetics and environment, respectively.
QTL mapping
QTL mapping analyses were performed independently for each of the 13 RIL families. The large size of each RIL family allowed us to simultaneously detect additive and epistatic QTLs using the QTLNetwork-2.0 software based on a mixed-model composite interval mapping (MCIM) method [71], [72]. Epistatic QTLs with or without single-locus effects were mapped. One - and two-dimensional genome scans for QTLs were performed using a 10 cM testing window, a 0.1 cM walk speed and a 0.5 cM filtration window size. To control the experimental type I error rate, a critical F value using the Satterthwaite method was estimated by performing a permutation test with at least 1000 permutations of the original data for each RIL family. QTL effects and QTL confidence intervals were estimated with a Bayesian method via the summary of the Gibbs samplers (Gibbs sample size = 20,000).
In order to compare the genetic architecture of flowering time between 2 environments, the MCIM method using the QTLNetwork-2.0 software was also applied on flowering time data scored under greenhouse conditions for 5 RIL families common to this study [23].
Enrichment for a priori candidate genes
An a priori list of 266 candidate genes was primarily retrieved from Atwell et al. [13] (Table 12 in Dataset S1) who searched TAIR8 (The Arabidopsis Information Resource, at http://arabidopsis.org/) for genes with annotations related to flowering time. In addition, a few genes were added following our literature searches, resulting in a list of 282 candidate genes in total.
When considering GWA mapping results, we focused on the SNPs presenting the highest association (top SNPs) with flowering time for each GWA mapping analysis (EMMA and Wilcoxon, for the 2007–2008 field experiment). We checked whether those top SNPs were located within the confidence interval of a QTL and whether they were located within 20 kb of one of the 282 candidate genes. The 20 kb window is conservative given that linkage disequilibrium in A. thaliana decays per 10 kb on average [61].
As described in Atwell et al. [13], enrichment was then calculated for SNPs within QTL confidence intervals and/or within 20Kb of an a priori candidate gene.
To determine the threshold number of top SNPs above which additional top SNPs would behave like the rest of the genome, enrichment was calculated for progressively more selective sets of top SNPs (3000, 2000, 1000, 500, 400, 300, 200, 100, 50). For each set of top SNPs, a null distribution of enrichment was generated to determine a 95% confidence interval (see Text S2 for description of the algorithm).
Genotyping candidate genes
Common polymorphisms previously found to be associated with flowering time were genotyped for the 197 natural accessions and the 14 parental lines. Functionality of the FRIGIDA allele was determined according to sequencing data [60]. FLOWERING LOCUS C functionality was determined according to Caicedo et al. [26]. Weak FLC alleles were determined by genotyping either the Ler miniature inverted repeat transposable element (MITE) 1224 bp insertion or the Da (1)-12 transposable element 4009 bp insertion. Shahdara and C24 accessions have also been reported to contain a functional FRI allele and a weak or nonfunctional FLC allele [73]. The two major FLC haplogroups (FLCA and FLCB) previously suggested to be associated with flowering time variation in A. thaliana under field conditions were determined by using the PCR primers described in Caicedo et al. [26]. A promoter indel upstream of the start codon of PHYTOCHROME C was genotyped according to Balasubramanian et al. [29].
Supporting Information
Zdroje
1. DucrocqS
VeyrierasJ-B
Camus-KulandaiveluL
Kloiber-MaitzM
PresterlT
2008 Key impact of Vgt1 on flowering time adaptation in maize: evidence from association mapping and ecogeographical information. Genetics 178 2433 2437
2. JonesH
LeighFJ
MackayI
BowerMA
SmithLMJ
2008 Population-based resequencing reveals that the flowering time adaptation of cultivated barley originated east of the Fertile Crescent. Mol Biol Evol 25 2211 2219
3. StinchcombeJR
WeinigC
UngererM
OlsenKM
MaysC
2004 A latitudinal cline in flowering time in Arabidopsis thaliana modulated by the flowering time gene FRIGIDA. Proc Natl Acad Sci USA 101 4712 4717
4. UgaY
NonoueY
LiangZ
LinH
YamamotoS
2007 Accumulation of additive effects generates a strong photoperiod sensitivity in the extremely late-heading rice cultivar ‘Nona Bokra’. Theor Appl Genet 114 1457 1466
5. Van DijkH
HautekèeteN-C
2007 Long day plants and the response to global warming: rapid evolutionary change in day length sensitivity is possible in wild beet. J Evol Biol 20 349 357
6. LennartssonT
TuomiJ
NilssonP
1997 Evidence for an evolutionary history of overcompensation in the grassland biennial Gentianella campestris (Gentianaceae). Am Nat 149 1147 1155
7. ToomajianC
HuT
AranzanaMJ
ListerC
TangC
2006 A nonparametric test reveals selection for rapid flowering in the Arabidopsis genome. PLoS Biol 4 e137 doi:10.1371/journal.pbio.0040137
8. RouxF
TouzetP
CuguenJ
Le CorreV
2006 How to be early flowering: an evolutionary perspective. Trends Plant Sci 11 375 381
9. BrockMT
StinchcombeJR
WeinigC
2009 Indirect effects of FRIGIDA: floral trait (co)variances are altered by seasonally variable abiotic factors associated with flowering time. J Evol Biol 22 1826 1838
10. EhrenreichI
HanzawaY
ChouL
RoeJ
KoverPX
2009 Candidate gene association mapping of Arabidopsis flowering time. Genetics: 109.105189
11. WeinigC
UngererMC
DornLA
KaneNC
ToyonagaY
2002 Novel loci control variation in reproductive timing in Arabidopsis thaliana in natural environments. Genetics 162 1875 1884
12. LiY
RoycewiczP
SmithE
BorevitzJ
2006 Genetics of local adaptation in the laboratory: flowering time quantitative trait loci under geographic and seasonal conditions in Arabidopsis. PLoS ONE 1 e105 doi:10.1371/journal.pone.0000105
13. AtwellS
HuangY
VilhjalmssonBJ
WillemsG
HortonM
2010 Genome-wide association study of 107 phenotypes in a common set of Arabidopsis thaliana inbred lines. Nature doi:10.1038/nature08800
14. MarchiniJ
CardonLR
PhillipsMS
DonnellyP
2004 The effects of human population structure on large genetic association studies. Nat Genet 36 512 517
15. ShrinerD
VaughanLK
PadillaMA
TiwariHK
WilliamsSM
2007 Problems with genome-wide association studies. Science 316 1840 1842
16. WangWYS
BarrattBJ
ClaytonDG
ToddJA
2005 Genome-wide association studies: theoretical and practical concerns. Nat Rev Genet 6 109 118
17. YuJ
PressoirG
BriggsWH
BiIV
YamasakiM
2006 A unified mixed-model method for association mapping that accounts for multiple levels of relatedness. Nat Genet 38 203 208
18. ZhaoK
AranzanaM
KimS
ListerC
ShindoC
2007 An Arabidopsis example of association mapping in structured samples. PLoS Genet 3 e4 doi:10.1371/journal.pgen.0030004
19. NordborgM
WeigelD
2008 Next-generation genetics in plants. Nature 456 720 723
20. ManentiG
GalvanA
PettinicchioA
TrincucciG
SpadaE
2009 Mouse genome-wide association mapping needs linkage analysis to avoid false-positive loci. PLoS Genet 5 e1000331 10.1371/journal.pgen.1000331
21. McKhannHI
CamilleriC
BérardA
BataillonT
DavidJL
2004 Nested core collections maximizing genetic diversity in Arabidopsis thaliana. Plant J 38 193 202
22. WilczekAM
RoeJL
KnappMC
CooperMD
Lopez-GallegoC
2009 Effects of genetic perturbation on seasonal life history plasticity. Science 323 930 934
23. SimonM
LoudetO
DurandS
BerardA
BrunelD
2008 Quantitative trait loci mapping in five new large recombinant inbred line populations of Arabidopsis thaliana genotyped with consensus single-nucleotide polymorphism markers. Genetics 178 2253 2264
24. KangHM
ZaitlenNA
WadeCM
KirbyA
HeckermanD
2008 Efficient control of population structure in model organism association mapping. Genetics 178 1709 1723
25. TominagaR
IwataM
SanoR
InoueK
OkadaK
2008 Arabidopsis CAPRICE-LIKE MYB 3 (CPL3) controls endoreduplication and flowering development in addition to trichome and root hair formation. Development 135 1335 1345
26. CaicedoAL
StinchcombeJR
OlsenKM
SchmittJ
PuruggananMD
2004 Epistatic interaction between Arabidopsis FRI and FLC flowering time genes generates a latitudinal cline in a life history trait. Proc Natl Acad Sci USA 101 15670 15675
27. KoverPX
RowntreeJK
ScarcelliN
SavriamaY
EldridgeT
2009 Pleiotropic effects of environment-specific adaptation in Arabidopsis thaliana. New Phytol 183 816 825
28. ScarcelliN
CheverudJM
SchaalBA
KoverPX
2007 Antagonistic pleiotropic effects reduce the potential adaptive value of the FRIGIDA locus. Proc Natl Acad Sci USA 104 16986 16991
29. BalasubramanianS
SureshkumarS
AgrawalM
MichaelTP
WessingerC
2006 The PHYTOCHROME C photoreceptor gene mediates natural variation in flowering and growth responses of Arabidopsis thaliana. Nat Genet 38 711 715
30. FlowersJM
HanzanaY
HallMC
MooreRC
PuruggananMD
2009 Population genomics of Arabidopsis thaliana flowering time gene network. Mol Biol Evol 26 2475 2486
31. SchwartzC
BalasubramanianS
WarthmannN
MichaelTP
LempeJ
2009 Cis-regulatory changes at FLOWERING LOCUS T mediate natural variation in flowering response of Arabidopsis thaliana. Genetics 183 723 732
32. ShindoC
ListerC
CrevillenP
NordborgM
DeanC
2006 Variation in the epigenetic silencing of FLC contributes to natural variation in Arabidopsis vernalization response. Genes Dev 20 3079 3083
33. NordborgM
BergelsonJ
1999 The effect of seed and rosette cold treatment on germination and flowering time in some Arabidopsis thaliana (Brassicacaeae) ecotypes. Am J Bot 86 470 475
34. Mutasa-GöttgensE
HeddenP
2009 Gibberelin as a factor in floral regulatory networks. J Exp Bot 60 1979 1989
35. Van DijkH
2009 Evolutionary change in flowering phenology in the iteroparous herb Beta vulgaris ssp. maritima: a search for the underlying mechanisms. J Exp Bot 60 3143 3155
36. RiesebergLH
ArcherMA
WayneRK
1999 Transgressive segregation, adaptation and speciation. Heredity 83 363 372
37. BucklerES
HollandJB
BradburyPJ
AcharyaCB
BrownPJ
2009 The genetic architecture of maize flowering time. Science 325 714 718
38. FlintJ
MackayTFC
2009 Genetic architecture of quantitative traits in mice, flies, and humans. Genome Res 19 723 733
39. KuittinenH
NiittyvuopioA
RinneP
SavolainenO
2008 Natural variation in Arabidopsis lyrata vernalization requirement conferred by a FRIGIDA indel polymorphism. Mol Biol Evol 25 319 329
40. LiuP
VikisH
LuY
WangD
YouM
2007 Large-Scale In Silico mapping of complex quantitative traits in inbred mice. PLoS ONE 2 e651 doi:10.1371/journal.pone.0000651
41. LiB
SuzukiJ-I
HaraT
1998 Latitidinal variation in plant size and relative growth rate in Arabidopsis thaliana. Oecologia 115 293 301
42. BalasubramanianS
SchwartzC
SinghA
WarthmannN
KimMC
2009 QTL mapping in new Arabidopsis thaliana advanced intercross-recombinant inbred lines. PLoS ONE 4 e4318 10.1371/journal.pone.0004318
43. KoverPX
ValdarW
TrakaloJ
ScarcelliN
EhrenreichIM
2009 A Multiparent Advanced Generation Inter-Cross to fine-map quantitative traits in Arabidopsis thaliana. PLoS Genet 5 e1000551 doi:10.1371/journal.pgen.1000551
44. YuJ
HollandJB
McMullenMD
BucklerES
2008 Genetic design and statistical power of nested association mapping in maize. Genetics 178 539 551
45. DoddAN
SalathiaN
HallA
KéveiE
TothR
2005 Plant circadian clocks increase photosynthesis, growth, survival, and competitive advantage. Science 309 630 633
46. MichaelTP
SaloméPA
YuHJ
SpencerTR
SharpEL
2003 Enhanced fitness conferred by natural occurring variation in the circadian clock. Science 302 1049 1053
47. SlotteT
HolmK
McIntyreLM
LagercrantzU
LascouxM
2007 Differential expression of genes important for adaptation in Capsella bursa-pastoris (Brassicaceae). Plant Physiol 145 160 173
48. ImaizumiT
KaySA
2006 Photoperiodic control of flowering: not only by coincidence. Trends Plant Sci 11 550 558
49. SaloméPA
McClungCR
2005 What makes the Arabidopsis clock tick on time? A review on entrainment. Plant, Cell Environ 28 21 38
50. StaigerD
AllenbachL
SalathiaN
FiechterV
DavisSJ
2003 The Arabidopsis SRR1 gene mediates phyB signaling and is required for normal circadian clock function. Genes Dev 17 256 268
51. MikkelsenMD
ThomashowMF
2009 A role for circadian evening elements in cold-regulated gene expression in Arabidopsis. Plant J 60 328 339
52. FukumatsuY
MitsuiS
YasuharaM
TokiokaY
IharaN
2005 Identification of LOV KELCH PROTEIN (LKP2)-interacting factors that can recruit LKP2 to nuclear bodies. Plant Cell Physiol 46 1340 1349
53. Alonso-BlancoC
AartsMG
BentsinkL
KeurentjesJ
ReymondM
2009 What has natural variation taught us about plant development, physiology, and adaptation? Plant Cell 21 1877 1896
54. DoyleMR
BizzellCM
KellerMR
MichaelsSD
SongJ
2005 HUA2 is required for the expression of floral repressors in Arabidopsis thaliana. Plant J 41 376 385
55. El-Din El-AssalS
Alonso-BlancoC
PeetersAJM
RazV
KoornneefM
2001 A QTL for flowering time in Arabidopsis reveals a novel allele of CRY2. Nat Genet 29 435 440
56. WernerJD
BorevitzJO
WarthmannN
TrainerGT
EckerJR
2005 Quantitative trait locus mapping and DNA array hybridization identify an FLM deletion as a cause for natural flowering-time variation. Proc Natl Acad Sci USA 102 2460 2465
57. BentsinkL
JowettJ
HanhartCJ
KoornneefM
2006 Cloning of DOG1, a quantitative trait locus controlling seed dormancy in Arabidopsis. Proc Natl Acad Sci USA 103 17042 17047
58. NohY-S
AmasinoRM
1999 Regulation of developmental senescence is conserved between Arabidopsis and Brassica napus. Plant Mol Biol 41 195 206
59. TianD
M.B.T
ChenJQ
KreitmanM
BergelsonJ
2003 Fitness costs of R-gene-mediated resistance in Arabidopsis thaliana. Nature 423 74 77
60. ShindoC
AranzanaMJ
ListerC
BaxterC
NichollsC
2005 Role of FRIGIDA and FLOWERING LOCUS C in determining variation in flowering time of Arabidopsis. Plant Physiol 138 1163 1173
61. ClarkRM
SchweikertG
ToomajianC
OssowskiS
ZellerG
2007 Common sequence polymorphisms shaping genetic diversity in Arabidopsis thaliana. Science 317 338 342
62. TuinstraMR
EjetaG
GoldsbroughPB
1997 Heterogeneous inbred family (HIF) analysis: a method for developing near-isogenic lines that differ at quantitative trait loci. Theor Appl Genet 95 1005 1011
63. LoudetO
GaudonV
TrubuilA
Daniel-VedeleF
2005 Quantitative trait loci controlling root growth and architecture in Arabidopsis thaliana confirmed by heterogeneous inbred family. Theor Appl Genet 110 742 753
64. WenderN
PolisettyC
DonohueK
2005 Density-dependent processes influencing the evolutionary dynamics of dispersal: A functional analysis of seed dispersal in Arabidopsis thaliana (Brassicaceae). Am J Bot 92 960 971
65. KorvesTM
SchmidKJ
CaicedoAL
MaysC
StinchcombeJR
2007 Fitness effects associated with the major flowering time gene FRIGIDA in Arabidopsis thaliana in the field. Am Nat 169 E141 E157
66. MasleJ
DoussinaultG
FarquharGD
SunB
1989 Foliar stage in wheat correlates better to photothermal time than to thermal time. Plant, Cell Environ 12 235 247
67. GranierC
MassonnetC
TurcO
MullerB
ChenuK
2002 Individual leaf development in Arabidopsis thaliana: a stable thermal-time-based programme. Ann Bot 89 595 604
68. LynchM
WalshB
1998 Gentics and Analysis of Quantitative Traits Sunderland, MA Sinauer Associates, Inc 980
69. WolynDJ
BorevitzJO
LoudetO
SchwartzC
MaloofJN
2004 Light-response quantitative trait loci identified with composite interval and eXtreme array mapping in Arabidopsis thaliana. Genetics 167 907 917
70. OstrowskiM-F
DavidJ
SantoniS
McKhannH
ReboudX
2006 Evidence for a large-scale population structure among accessions of Arabidopsis thaliana: possible causes and consequences for the distribution of linkage disequilibrium. Mol Ecol 15 1507 1517
71. YangJ
HuC
HuH
YuR
XiaZ
2008 QTLNetwork: Mapping and visualizing genetic architecture of complex traits in experimental populations. Bioinformatics 24 721 723
72. ZhangK
TianJ
ZhaoL
WangS
2008 Mapping QTLs with epistatic effects and QTL×environment interactions for plant height using a doubled haploid population in cultivated wheat. JGG 35 119 127
73. MichaelsSD
HeY
ScortecciKC
AmasinoRM
2003 Attenuation of FLOWERING LOCUS C activity as a mechanism for the evolution of summer-annual flowering behavior in Arabidopsis. Proc Natl Acad Sci USA 100 10102 10107
Štítky
Genetika Reprodukční medicínaČlánek vyšel v časopise
PLOS Genetics
2010 Číslo 5
Nejčtenější v tomto čísle
- Common Genetic Variants near the Brittle Cornea Syndrome Locus Influence the Blinding Disease Risk Factor Central Corneal Thickness
- All About Mitochondrial Eve: An Interview with Rebecca Cann
- Aging and Chronic Sun Exposure Cause Distinct Epigenetic Changes in Human Skin
- The Relationship among Gene Expression, the Evolution of Gene Dosage, and the Rate of Protein Evolution