
Rare and Common Regulatory Variation in Population-Scale Sequenced Human Genomes
Population-scale genome sequencing allows the characterization of functional effects of a broad spectrum of genetic variants underlying human phenotypic variation. Here, we investigate the influence of rare and common genetic variants on gene expression patterns, using variants identified from sequencing data from the 1000 genomes project in an African and European population sample and gene expression data from lymphoblastoid cell lines. We detect comparable numbers of expression quantitative trait loci (eQTLs) when compared to genotypes obtained from HapMap 3, but as many as 80% of the top expression quantitative trait variants (eQTVs) discovered from 1000 genomes data are novel. The properties of the newly discovered variants suggest that mapping common causal regulatory variants is challenging even with full resequencing data; however, we observe significant enrichment of regulatory effects in splice-site and nonsense variants. Using RNA sequencing data, we show that 46.2% of nonsynonymous variants are differentially expressed in at least one individual in our sample, creating widespread potential for interactions between functional protein-coding and regulatory variants. We also use allele-specific expression to identify putative rare causal regulatory variants. Furthermore, we demonstrate that outlier expression values can be due to rare variant effects, and we approximate the number of such effects harboured in an individual by effect size. Our results demonstrate that integration of genomic and RNA sequencing analyses allows for the joint assessment of genome sequence and genome function.
Published in the journal:
. PLoS Genet 7(7): e32767. doi:10.1371/journal.pgen.1002144
Category:
Research Article
doi:
https://doi.org/10.1371/journal.pgen.1002144
Summary
Population-scale genome sequencing allows the characterization of functional effects of a broad spectrum of genetic variants underlying human phenotypic variation. Here, we investigate the influence of rare and common genetic variants on gene expression patterns, using variants identified from sequencing data from the 1000 genomes project in an African and European population sample and gene expression data from lymphoblastoid cell lines. We detect comparable numbers of expression quantitative trait loci (eQTLs) when compared to genotypes obtained from HapMap 3, but as many as 80% of the top expression quantitative trait variants (eQTVs) discovered from 1000 genomes data are novel. The properties of the newly discovered variants suggest that mapping common causal regulatory variants is challenging even with full resequencing data; however, we observe significant enrichment of regulatory effects in splice-site and nonsense variants. Using RNA sequencing data, we show that 46.2% of nonsynonymous variants are differentially expressed in at least one individual in our sample, creating widespread potential for interactions between functional protein-coding and regulatory variants. We also use allele-specific expression to identify putative rare causal regulatory variants. Furthermore, we demonstrate that outlier expression values can be due to rare variant effects, and we approximate the number of such effects harboured in an individual by effect size. Our results demonstrate that integration of genomic and RNA sequencing analyses allows for the joint assessment of genome sequence and genome function.
Introduction
Deeper characterization of genetic variation is becoming increasingly available with advances in DNA sequencing technology [1]–[5]. This improves our ability to pinpoint protein-coding variants which disrupt protein structure, and has already begun to provide insight into the genetic basis of disease with unknown etiology [6], [7]. In addition to protein-coding variation, access to a more complete spectrum of genetic data facilitates the discovery of regulatory variants. However, relative to protein coding variation, the information about the structure of gene regulatory architecture is incomplete and the existence of a regulatory variant is largely inferred through its association with gene expression. Such associations have previously been identified as exhibiting widespread and tissue-specific patterns [8]–[11]. They are also increasingly linked to the basis of human phenotypic diversity [11]. For instance, recent studies have implicated the role of regulatory variants in the etiology of diseases such as obesity [12], celiac disease [13] and migraine [14]. Now, the compendium of variants acquired from genome sequencing of population samples provides increased potential for uncovering new associations, many of which, given this enhanced resolution, are presumed to be causal. Furthermore, we are able to begin to analyse genome-wide signals of interactions between disruptive protein-coding variation and regulatory variation. We investigate the landscape of regulatory variation as surveyed by population-scale sequencing by using data acquired from the 1000 genomes project, together with gene expression data in 60 CEU individuals (CEU: Utah residents with ancestry from northern and western Europe) acquired using RNA sequencing (RNA-Seq) and 57 CEU and 56 YRI individuals (YRI: Yoruba in Ibadan, Nigeria) acquired using gene expression arrays [15], [16]. In this study, we demonstrate the value of almost complete information from the 1000 genomes project to reveal the fine structure of rare and common regulatory variation.
Results
eQTL discovery
We assessed the number of expression quantitative trait loci within 1 Mb of annotated genes (cis-eQTLs), and compared the power of HapMap3 (HM3) against the much higher SNP density of the 1000 genomes project (1KG) genetic variants, using gene expression data from lymphoblastoid cells for matching individuals (see Materials and Methods). For both CEU and YRI, similar numbers of eQTLs were found between the two projects independent of FDR (estimated by permutations; Figure 1 and Figure S1). This suggests that, with given power, the majority of the common regulatory effects can be captured by genome-wide SNP arrays. Using RNA sequencing data, we were also able to survey the difference between 1KG and HM3 for regulatory variation detected through allelic imbalance of heterozygous coding sites. In 1KG, twice as many heterozygous sites (36015 versus 14281) had significant allele specific expression (ASE; reviewed [17]) effect (p≤0.05), corresponding to 4971 genes versus 3175 genes. The median log effect size for this imbalance was 1.39 (Figure S2). This increase provides more power to explore within individual regulatory variation.

Given that the 1KG data provides an almost complete ascertainment of common SNPs, we sought to assess whether we are more likely to detect potentially causal regulatory variants. We observed that nearly 80% of all eQTVs discovered with the 1KG were not discovered with the HM3 (Table S1). This indicates that if these new variants are bonafide causal variants, whole genome sequencing is uncovering a large number of previously unidentified variants. Conversely, however, for the eQTVs discovered with the HM3, up 65% would not have passed the discovery threshold in the 1KG due to the extra multiple testing correction implicit through having 5–7 times as many variants (Table S2). In order to investigate if the 1KG eQTLs exhibited characteristics indicative of being a functional variant, we fine mapped HM3-discovered eQTLs into the 1KG (see Materials and Methods). We observed that for both populations, independent of the gene expression platform, the majority of these HM3 eQTLs were found in the 1KG with the same or a different variant of higher significance, and infrequently (<16%) would the association be worse, likely due to genotyping errors in the 1KG (Figure 2). Next, we compared the properties of these eQTLs in HM3 and 1KG. Since previous analyses have identified a strong enrichment of eQTLs around the transcription start site [18]–[20], we investigated if the 1KG associated SNPs were more proximal to the transcription start site of their associated gene than the HM3 associated SNPs, but no significant trend was observed (Figures S3, S4 and S5). This supports recent observations that the strongest effects on gene expression are not exclusively defined through promoter variation [15], [21]. We next asked if the newly discovered variants were on more evolutionarily conserved sites, which would suggest that they are more likely to be causal variants [22]. In this analysis we had to account for the fact that the HM3 SNPs are more conserved overall (Student's T-test p<2e-16; MW p<2e-16). Thus, we compared the within platform difference between the best association and the second best-linked association, expecting that the increase in conservation between the two could be higher within 1KG due to the best association being more often the causal variant than in HM3. However, no significant difference was observed (Figure S6), which indicates, consistent with ENCODE findings, that many regulatory elements and thus also genetic variants in these elements are unconstrained [23], [24].

eQTLs for alternative splicing
We investigated the allelic expression properties of transcript variants that have a putative impact on transcript structure. For splicing variants (MAF≥5%), we saw an enrichment in associations in RNA-Seq data for the respective donor and acceptor exon read count levels (the number of RNA sequencing reads which overlap the exon for an individual, see Materials and Methods) compared to a background derived from synonymous variants (Figure S7). This enrichment was observed independent of mapping quality filter confirming that it is not due to mapping biases (Figure S8). We also investigated gained-stop codon variants for signals of nonsense mediated decay, finding greater than 4-fold enrichment in exon read count level associations for overlapping exons when compared to synonymous and nonsynonymous variants (Figure S9). When assessing this enrichment separately through ASE signals in the RNA-Seq data, we found that 44% (66 of 150 testable heterozygotes at 32 sites) of stop gained variants where ASE can be detected are significant compared to only 18.8% of synonymous variants and 20.9% of nonsynonymous variants.
Cis-regulatory modifiers of protein-coding variants
Regulatory variation can also modify the functional impact of protein-coding variation. We had previously reported that 18.2% of nonsynonymous variants were modulated by regulatory variation [25]. We now discovered that at least 20.9% of testable heterozygotes for nonsynonymous SNPs (n = 32859) had significantly different expression levels of the two nsSNP alleles (p≤0.05; this is 23.3% for n = 38645 when both known alleles are not required to be observed). This corresponds to 46.2% of nonsynonymous variants having an ASE effect in at least one individual (n = 5686). These results suggest that regulatory variation may have a fundamental role in explaining individual differences in penetrance of disease predisposing variation. Thus, surveys of coding variation through large-scale exome resequencing studies [7], [26]–[28] would benefit from complimentary information of regulatory variation e.g. from RNA sequencing of the same samples.
Given that regulatory modifiers of protein-coding variation were prevalent, we looked for population genetic signals of interaction between protein-coding and cis regulatory variation. Such co-evolution would imply a selective advantage of some regulatory and coding variant combinations over other haplotypes in that locus potentially increasing linkage disequilibrium (LD). In order to seek for such patterns from the ASE data, we calculated the proportion of heterozygous individuals that have significant ASE as a proxy for linkage disequilibrium between the coding ASE variant and the unknown regulatory variants. Furthermore, we used both HM3 and 1KG datasets to control for putative effects of genotyping error (Figure S10). We observed an increase signal for nonsynonymous compared to synonymous variants (p = 3.5e-4; Figure S11), which is suggestive coevolution of functional nonsynonymous and regulatory variants. The result is unlikely to be caused by nonsynonymous SNPs being causal regulatory variants more often than synonymous SNPs: the two types of variants have a nearly equal enrichment of exon associations (Figure S9), and while a change in protein structure might change the overall expression level of the gene itself through an autoregulatory mechanism, this is not expected to lead to allelic imbalance. When stratifying by the derived allele's expression, in the 1KG data we observed a large and statistically significant enrichment of the ASE proportion for rare nonsynonymous variants where the derived allele has lower expression than the ancestral (Figure S12). This suggests that some low-frequency deleterious coding variants may be tolerated in the population only because they lie on a lower expressed haplotypes and thus have reduced penetrance. This may be particularly important for understanding the phenotypic effects of loss-of-function variants – it has been estimated that each person carries 250 to 300 loss-of-function variants (50 to 100 of which are previously implicated in inherited disorders) [29], but sometimes their functional impact may be diminished or strengthened by their regulatory background.
Detection of rare regulatory variants
Genome sequencing offers the ability to interrogate the functional impact of recent and rare regulatory variants in individuals [30]. We calculated whether individuals sharing an rare ASE effect are more likely to show increased haplotype sharing, measured as haplotype homozygosity, which would be a signal of the ASE effect being driven by a shared rare regulatory variant (as described in [15]). Concordant with previous results, we found an excess of haplotype sharing for rare ASE haplotypes (Figure S13). Next, we sought to identify the putative causal variants by investigating genetic variants which were perfectly concordant with this rare ASE effect (see Materials and Methods). For each such effect, we identified a median of 4 and a mean of 8.83 putative regulatory SNPs (prSNPs) within 100 kb of the TSS (compared to a median of 3 and mean of 7.64 putative regulatory SNPs under the null; Figure 3 and Figure S14). Altogether, we identified at least one putative regulatory SNP for 1711 of 2693 genes demonstrating a rare ASE effect (compared to 1517 under the null), totalling 23234 prSNPs for rare ASE effects (compared to 20393 under the null). Additionally, the prSNPs showed signs of increased functional potential compared to the null group: they were more likely to be distributed around the transcription start site and within the gene relative to control SNPs (χ2 p-value<2e-16; Figure S15). Furthermore, the prSNPs were more likely to have a lower derived allele frequency (p = 3.437e-12) and also trended to have higher evolutionary conservation, indicating that they are more likely to be functional and putatively slightly deleterious (p = 0.07 with PhyloP vertebrate conservation scores; Figure S16).

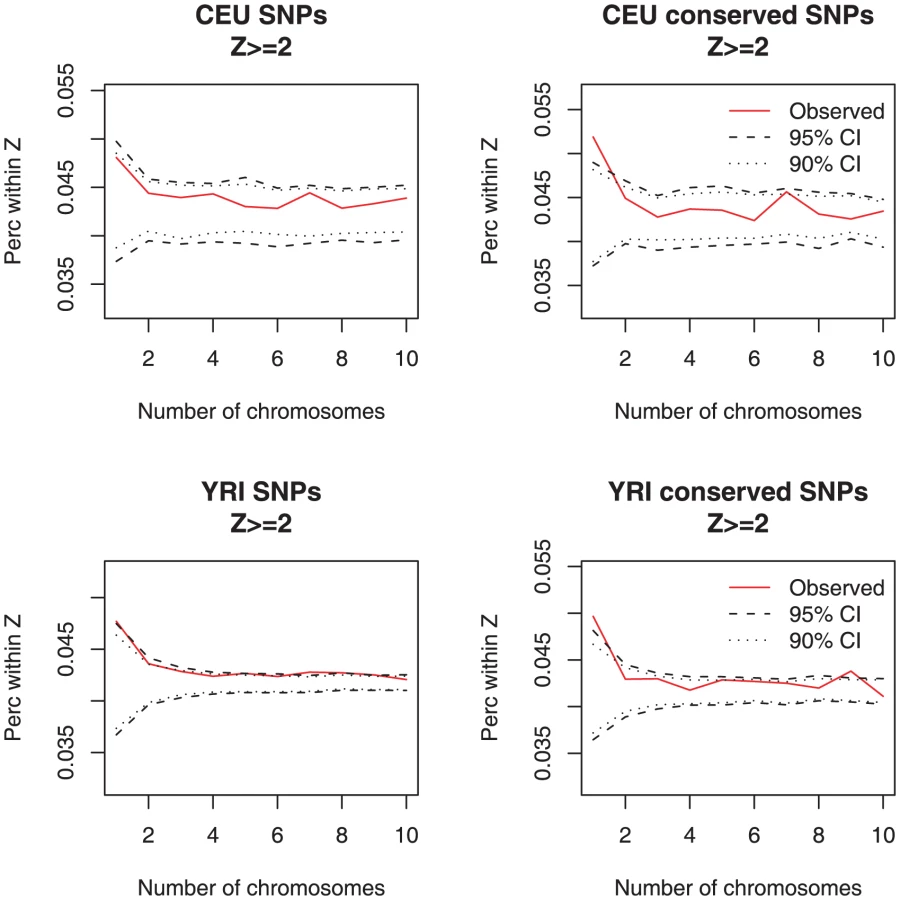
We then sought for a signal of rare regulatory variants underlying large changes in gene expression by calculating whether individuals with outlier array expression values are enriched for rare genetic variants. We found that individuals with gene expression Z-score ≥2 (a measurement of how far the observed value is from the mean of the sample – see Materials and Methods) have an excess of rare variants within 100 kb of the transcription start site, a signal that was statistically significant (outside the 95% CI) for rare variants landing in highly conserved sites derived from 17-way vertebrate alignments (Figure 4). The average log-2 difference in expression from the mean for these variants was 0.74±0.52 in CEU and 0.66±0.49 in YRI (Figure S17). Overall, there was an excess of 162 coincident singleton, conserved SNPs with expression outliers (Z≥2) in the CEU sample (one-sided p-value<0.05) and the same number, 162, in YRI (one-sided p-value<0.05). Divided by the number of studied individuals, this indicates that there are approximately 3 such effects per individual for this cell type. For other Z-score thresholds and for RNA-Seq data, we observed the same type of enrichment (Figures S18 and S19).
Discussion
In this study, we have analyzed common and rare regulatory variation in the human genome using resequencing data, highlighting the many advantages of population-scale sequencing in understanding the spectrum of functional variation in the genome. The comparison of eQTL discoveries using 1000 genomes and HapMap 3 data indicated that while many novel associations are discovered with resequencing data, most of common effects are already captured with genotyping arrays. Even though mapping common causal regulatory variants remains a challenge, we observed a clear enrichment of regulatory effects in splice-site and nonsense SNPs. Furthermore, we showed that regulatory variation can putatively modify the effects of a large proportion of nonsynonymous coding variants, and present population genetic evidence suggestive of such interactions. The possibility to study rare variants has been one of the main motivations for large-scale resequencing experiments, and we presented several novel approaches to analyse rare regulatory variation from genomic as well as RNA sequencing data. For rare regulatory effects identified from RNA sequencing data, we were able to pinpoint a median of four putative regulatory variants per rare effect, one of which is expected to be causal – a number low enough for feasible experimental validation. Additionally, individuals with outlying expression values were shown to have an enrichment of rare conserved regulatory SNPs, with each individual carrying an estimation of approximately 3 rare regulatory variants that have a large effect (Z> = 2) on gene expression in the studied cell type. Across all the tissues and developmental stages, each individual is expected to have even hundreds of such rare, large effect regulatory variants. We have also demonstrated how studies integrating genomic or exome sequencing with RNA sequencing data from different tissues will also provide information of how the functional effects of protein-coding variation are modified by regulatory variation. Altogether, these approaches will bring us closer to a joint assessment of how genome sequence affects genome function, and how this relates to phenotypic diversity.
Materials and Methods
SNP and indel genotypes
We used 1000 genomes polymorphisms from the March 2010 pilot 1 and 2 release (www.1000genomes.org; REL-1003) and HapMap 3 release 3 genotypes (www.hapmap.org). For association analysis, we used 5 404 174 common (MAF≥0.05) SNPs for 60 RNA-sequenced CEU individuals (Utah residents with ancestry from northern and western Europe) and 5 329 982 and 6 976 232 SNPs for 57 and 56 expression-arrayed CEU and Yoruban individuals (Yoruba in Ibadan, Nigeria), respectively. For two individuals which were parents in a CEU trio which had variants independently called in the 1000 genomes (pilot 2), we intersected their genotype calls with pilot 1 calls; in cases where no genotypes were reported in the trio individuals, we added the reference homozygote state. Between pilot 1 and pilot 2, 3 398 517 sites were concordant and had genotypes reported (for 950 sites the reference and alternative allele were different between the trio individuals and the 58 pilot 1 individuals and these sites were excluded from further processing). For indels, we used calls from the same release. In total, 592 081, 586 604 and 710 931 common indels were used in each population sample (60 CEU with RNA-Seq, 57 CEU with arrays and 56 YRI with arrays). For rare variant and ASE-based analyses we used only the pilot 1 1000 genomes genotype calls; this was to prevent biases due to the improved rare variant calling on the pilot 2 trio.
Gene annotation and gene expression data
RNA-sequencing and expression arrays experiments were performed and quantified on RNA extracted from lymphoblastoid cell lines as previously reported [15]. We updated our annotation for RNA-Seq quantification to use the Gencode v3b annotation [31].
Exon read level associations
For RNA-Seq data, we calculated associations per exon by quantifying the number of reads overlapping known exon annotation for each individual and then performing Spearman rank correlation with respect to corresponding genotypes as previously reported [15].
Allele-specific expression analysis
Allele-specific expression was assessed by calculating the allelic imbalance of variants over heterozygote positions. Significance is assessed using the binomial probability distribution where the probability of success is weighted by that individual's/lane's reference allele to non-reference allele mapping bias. ASE variants used in this study were not monoallelic as we required both reported alleles to be observed at least once. We also conditioned on the ASE effect being present for reads quantified above MAQ10 mapping quality and Phred score of 10 but subsequently reinforced there was no threshold effect by requiring significance when there was no mapping or base quality filter.
Fine mapping HapMap3 eQTLs into the 1000 genomes
The best association per gene (or in the case of RNA-Seq data per exon) at or below the 0.01 permutation threshold was fine-mapped from the HM3 into the 1KG data. Each of these eQTL variants from the HM3 was compared to D′ calculated by Haploview for all the 1KG variants with a Spearman association of p≤10e-3 with the same gene. The 1KG variants which were in LD (D′≥0.8) with the original HM3 variant were deemed to be underlying the same effect originally discovered in the HM3; the best association for that gene in the 1KG meeting this LD criterion was selected for comparison to the original HM3 variant. This methodology allowed us to survey new discoveries irrespective of whether they were the same variant, different variants at different frequencies or divergently-located with respect to the transcription start site.
Functional variation determination
Functional variation was determined using the EnsEMBL 54 pipeline [32]. Splicing variants were compared to the Gencode annotation and were deemed accurate for essential splicing variants if they were within 5 bp of an exon boundary and accurate for a general splicing variant if they were within 100 bp of an exon boundary. For testing exon association enrichment, we took the splicing variant associations for their respective donor (5′) and acceptor (3′) exons. To find a matching set to test for enrichment of association, we considered synonymous variants which were greater than 15 bp away from an exon boundary. We calculated enrichment by calculating the qvalue statistic1-π0 for acceptor and donor associations only when there were more than 30 associations; the log-ratio of this enrichment was reported [33]. This calculation was made across the range of mean read depths for exons from 1–1000 reads. Stop gain variants were tested against the exon they overlapped and were also compared in a similar way to synonymous and nonsynonymous mutations.
Conservation and allele-frequency analysis
The PhyloP base-wise conservation scores were based on alignments of 46 vertebrate genomes, 33 mammalian genomes, and 10 primate genomes, and were downloaded from UCSC [34]. Ancestral alleles were obtained from the 1000 genomes pilot release.
Haplotype homozygosity from RNA-Seq data
Haplotype homozygosity indicates the relative age of a haplotype by assessing the incidence (or lack thereof) of recombination or other mutation. This is achieved by comparing the extent of homozygosity between haplotypes by calculating the length of sequence from a target marker until a mismatch occurs. Phased data is required in non-haploid species to assess and compare individual haplotypes from a target marker position. Furthermore, since haplotype homozygosity is being assessed from a heterozygous target marker (required for assessing ASE), a decision needs to be made about what allele should be taken to represent the reference haplotype and in what direction haplotype homozygosity should be assessed (5′ or 3′). Here, we used phasing data as provided by the 1000 genomes project pilot release and compared all haplotypes carrying each allele for the heterozygous marker and in both directions to select the allele and direction with the average longest tract of haplotype homozygosity. Then, given this direction and reference haplotype, we take as a criterion for comparison that there must be at least 6 individuals where between 2 and 4 have ASE significant haplotypes in the same direction and at least 2 are non-significant for ASE. To compare the extent of haplotype homozygosity given the reference haplotype and the ASE status of each haplotype we compare significant ASE to significant ASE haplotypes and significant to non-significant ASE haplotypes and compute the average length of haplotype homozygosity for all pairwise individual comparisons within these categories. We then stratify the results for each ASE marker based on the number of significant ASE haplotypes were original discovered.
Causal regulatory variant detection for rare regulatory haplotypes
To identify putative regulatory SNPs on rare regulatory haplotypes using ASE calculations we looked for all variants within 100 kb of the transcription start site which satisfied ASE sharing in 1, 2 or 3 individuals when at least 6 heterozygotes individuals could be tested for ASE. To satisfy sharing, the variant must be heterozygous with the same direction of effect (assessed through phasing) when an ASE effect is present in an individual and homozygous when the ASE effect is not present. To assess how well our putative causal regulatory variants discovery was performing we assessed the distribution of discoveries around the transcription start site by comparing counts of real predictions versus control predictions in 5 kb windows using the Fisher's exact test (Bonferroni-corrected for multiple testing). Control (null) predictions were obtained by matching each ASE test by reassigning significance in the opposite direction. For instance, if there were 6 heterozygotes, 2 of which show ASE, the control reassignment would assign ASE to the two least significant heterozygote individuals. To assign direction of effect, we matched the distribution of real directions determined with the phasing data to the control set.
Z-score analysis
We compared the co-occurrence of expression outliers with rare variants by recomputing our expression files as Z-scores and binning at each allele frequency the distribution of expression measurements that were incident with the non-reference variant. To assess significance of divergence in this distribution, individual labels were permuted 200 times and 90 and 95% CI were obtained.
Supporting Information
Zdroje
1. WheelerDASrinivasanMEgholmMShenYChenL 2008 The complete genome of an individual by massively parallel DNA sequencing. Nature 452 872 876
2. LevySSuttonGNgPCFeukLHalpernAL 2007 The diploid genome sequence of an individual human. PLoS Biol 5 e254 doi:10.1371/journal.pbio.0050254
3. BentleyDRBalasubramanianSSwerdlowHPSmithGPMiltonJ 2008 Accurate whole human genome sequencing using reversible terminator chemistry. Nature 456 53 59
4. WangJWangWLiRLiYTianG 2008 The diploid genome sequence of an Asian individual. Nature 456 60 65
5. SchusterSCMillerWRatanATomshoLPGiardineB 2010 Complete Khoisan and Bantu genomes from southern Africa. Nature 463 943 947
6. RoachJCGlusmanGSmitAFHuffCDHubleyR 2010 Analysis of genetic inheritance in a family quartet by whole-genome sequencing. Science 328 636 639
7. NgSBTurnerEHRobertsonPDFlygareSDBighamAW 2009 Targeted capture and massively parallel sequencing of 12 human exomes. Nature 461 272 276
8. DermitzakisET 2008 From gene expression to disease risk. Nat Genet 40 492 493
9. CheungVGSpielmanRS 2009 Genetics of human gene expression: mapping DNA variants that influence gene expression. Nat Rev Genet 10 595 604
10. DimasASDeutschSStrangerBEMontgomerySBBorelC 2009 Common regulatory variation impacts gene expression in a cell type-dependent manner. Science 325 1246 1250
11. MontgomerySBDermitzakisET 2011 From expression QTLs to personalized transcriptomics. Nat Rev Genet
12. SpeliotesEKWillerCJBerndtSIMondaKLThorleifssonG 2010 Association analyses of 249,796 individuals reveal 18 new loci associated with body mass index. Nat Genet
13. DuboisPCTrynkaGFrankeLHuntKARomanosJ 2010 Multiple common variants for celiac disease influencing immune gene expression. Nat Genet 42 295 302
14. AnttilaVStefanssonHKallelaMTodtUTerwindtGM 2010 Genome-wide association study of migraine implicates a common susceptibility variant on 8q22.1. Nat Genet 42 869 873
15. MontgomerySBSammethMGutierrez-ArcelusMLachRPIngleC 2010 Transcriptome genetics using second generation sequencing in a Caucasian population. Nature 464 773 777
16. StrangerBEMontgomerySBDimasAS… 2010 Patterns of cis regulatory variation in diverse human populations. in preparation
17. PastinenT 2010 Genome-wide allele-specific analysis: insights into regulatory variation. Nat Rev Genet 11 533 538
18. VeyrierasJBKudaravalliSKimSYDermitzakisETGiladY 2008 High-resolution mapping of expression-QTLs yields insight into human gene regulation. PLoS Genet 4 e1000214 doi:10.1371/journal.pgen.1000214
19. StrangerBENicaACForrestMSDimasABirdCP 2007 Population genomics of human gene expression. Nat Genet 39 1217 1224
20. DixonALLiangLMoffattMFChenWHeathS 2007 A genome-wide association study of global gene expression. Nat Genet 39 1202 1207
21. PickrellJKMarioniJCPaiAADegnerJFEngelhardtBE 2010 Understanding mechanisms underlying human gene expression variation with RNA sequencing. Nature 464 768 772
22. AndersenMCEngstromPGLithwickSArenillasDErikssonP 2008 In silico detection of sequence variations modifying transcriptional regulation. PLoS Comput Biol 4 e5 doi:10.1371/journal.pcbi.0040005
23. BirneyEStamatoyannopoulosJADuttaAGuigoRGingerasTR 2007 Identification and analysis of functional elements in 1% of the human genome by the ENCODE pilot project. Nature 447 799 816
24. MontgomerySBGriffithOLSchuetzJMBrooks-WilsonAJonesSJ 2007 A survey of genomic properties for the detection of regulatory polymorphisms. PLoS Comput Biol 3 e106 doi:10.1371/journal.pcbi.0030106
25. DimasASStrangerBEBeazleyCFinnRDIngleCE 2008 Modifier effects between regulatory and protein-coding variation. PLoS Genet 4 e1000244 doi:10.1371/journal.pgen.1000244
26. NgSBBuckinghamKJLeeCBighamAWTaborHK 2010 Exome sequencing identifies the cause of a mendelian disorder. Nat Genet 42 30 35
27. ChoiMSchollUIJiWLiuTTikhonovaIR 2009 Genetic diagnosis by whole exome capture and massively parallel DNA sequencing. Proc Natl Acad Sci U S A 106 19096 19101
28. BilguvarKOzturkAKLouviAKwanKYChoiM 2010 Whole-exome sequencing identifies recessive WDR62 mutations in severe brain malformations. Nature 467 207 210
29. DurbinRMAbecasisGRAltshulerDLAutonABrooksLD 2010 A map of human genome variation from population-scale sequencing. Nature 467 1061 1073
30. NielsenR 2010 Genomics: In search of rare human variants. Nature 467 1050 1051
31. HarrowJDenoeudFFrankishAReymondAChenCK 2006 GENCODE: producing a reference annotation for ENCODE. Genome Biol 7 Suppl 1 S4 1 9
32. FlicekPAmodeMRBarrellDBealKBrentS 2010 Ensembl 2011. Nucleic Acids Res
33. StoreyJDTibshiraniR 2003 Statistical significance for genomewide studies. Proc Natl Acad Sci U S A 100 9440 9445
34. PollardKSHubiszMJRosenbloomKRSiepelA 2010 Detection of nonneutral substitution rates on mammalian phylogenies. Genome Res 20 110 121
35. NicaACMontgomerySBDimasASStrangerBEBeazleyC 2010 Candidate causal regulatory effects by integration of expression QTLs with complex trait genetic associations. PLoS Genet 6 e1000895 doi:10.1371/journal.pgen.1000895
Štítky
Genetika Reprodukční medicínaČlánek vyšel v časopise
PLOS Genetics
2011 Číslo 7
Nejčtenější v tomto čísle
- A Rice Plastidial Nucleotide Sugar Epimerase Is Involved in Galactolipid Biosynthesis and Improves Photosynthetic Efficiency
- Genome-Wide Association Study Identifies Novel Restless Legs Syndrome Susceptibility Loci on 2p14 and 16q12.1
- Loss of the BMP Antagonist, SMOC-1, Causes Ophthalmo-Acromelic (Waardenburg Anophthalmia) Syndrome in Humans and Mice
- Gene-Based Tests of Association