
Regulators of Autophagosome Formation in Muscles
Since the identification of the core autophagy genes in yeast, tissue culture cell lines have been the primary tool to evaluate the role and regulation of autophagy in higher organisms. However, since autophagy is a tissue-specific, context dependent process, stable cell lines can only give a limited view of the autophagic process. Here, we focus on the role of putative autophagy regulators in the specific context of the skeletal muscle, which has one of the most robust autophagy responses in mammals. We describe a fruitfly model of autophagy for skeletal muscles that integrates rapid genetic screening in primary cultured cells with robust in vivo validation in the larval muscle. We screened a set of genes previously linked to the autophagy pathway in humans, and identified both positive and negative regulators of autophagy. Our observation that genes involved in sugar metabolism impact muscle autophagy has important implications for both skeletal and cardiac myopathies associated with aberrant sugar storage. Surprisingly, we found that the proteasome is required to maintain autophagy in the muscle, suggesting that therapeutic treatments aiming to induce autophagy by proteasome inhibition must be carefully calibrated to ensure that the opposite phenotype does not occur.
Published in the journal:
. PLoS Genet 11(2): e32767. doi:10.1371/journal.pgen.1005006
Category:
Research Article
doi:
https://doi.org/10.1371/journal.pgen.1005006
Summary
Since the identification of the core autophagy genes in yeast, tissue culture cell lines have been the primary tool to evaluate the role and regulation of autophagy in higher organisms. However, since autophagy is a tissue-specific, context dependent process, stable cell lines can only give a limited view of the autophagic process. Here, we focus on the role of putative autophagy regulators in the specific context of the skeletal muscle, which has one of the most robust autophagy responses in mammals. We describe a fruitfly model of autophagy for skeletal muscles that integrates rapid genetic screening in primary cultured cells with robust in vivo validation in the larval muscle. We screened a set of genes previously linked to the autophagy pathway in humans, and identified both positive and negative regulators of autophagy. Our observation that genes involved in sugar metabolism impact muscle autophagy has important implications for both skeletal and cardiac myopathies associated with aberrant sugar storage. Surprisingly, we found that the proteasome is required to maintain autophagy in the muscle, suggesting that therapeutic treatments aiming to induce autophagy by proteasome inhibition must be carefully calibrated to ensure that the opposite phenotype does not occur.
Introduction
Autophagy, literally “self-eating”, is a eukaryotic evolutionarily conserved mechanism for bulk degradation of organelles and long-lived proteins[1]. Upon induction, a portion of cytoplasm is enveloped in a closed double-membrane bound vesicle called the autophagosome, which subsequently fuses with the lysosome, where its inner membrane and contents are digested. The resulting degradation products are transported out of the lysosome and recycled for protein synthesis and ATP production. Studies in yeast have identified 35 ATG (autophagy-related) genes, many of which are conserved in higher organisms [1–3]. Induction occurs via the autophagy-related gene 1 (Atg1) complex, and membrane nucleation requires a complex containing Vps34 (the class III PI3K). Two different sets of ubiquitin-like protein conjugation systems, Atg8 and Atg5–Atg12 direct the expansion of the autophagosome around its target. Subsequently, fusion with the lysosome requires the endocytic Rab proteins, HOPS complex and SNARE machinery [2,4–9].
The Tor pathway, which links cellular nutritional status to metabolism and growth, regulates autophagy in response to starvation [10]. Tor represses the formation of autophagosomes by inhibition of Atg1, a function conserved from yeast to mammals [11]. In higher eukaryotes, the insulin/class I phosphoinositide 3-kinase (PI3K) pathway, upstream of Tor, links hormonal signaling to autophagy [12]. In addition, several other kinases have been shown to regulate autophagy either directly or via Tor, including cAMP-dependent protein kinase A (PKA), AMP-activated protein kinase (AMPK), calcium/calmodulin-dependent protein kinase 2, beta (CAMKK2/CaMKKβ) [12]. Despite the implication of these pathways in autophagy, there remain important questions about how upstream signaling events connect to the molecular machinery of autophagosome formation. Even the best characterized regulator, Tor, likely has additional substrates that regulate autophagy through unknown mechanisms [12,13]. The crosstalk between autophagy-regulating pathways is also poorly understood, as is the role of phosphatases and other regulatory proteins.
In addition to non-selective autophagy, which is primarily a starvation response, cells use selective autophagy for a variety of purposes, including remodeling to adapt to changing environmental/nutritional conditions, elimination of damaged organelles, and invading pathogens [14]. It has become clear in recent years that specific cargos are targeted to autophagosomes by receptor and adaptor proteins that connect the cargo to the core autophagy machinery [14]. Autophagy receptors have been identified in some cases of selective autophagy (e.g. viruses, bacteria, mitochondria, peroxisomes, midbody remnant), but remain elusive in other cases (e.g. lipid, ribosomes, endoplasmic reticulum) [14,15]. Even less is known about the molecules on the cargo that are recognized by the receptor proteins, although it is clear that ubiquitin can serve this purpose in some cases [14,15].
As an approach to identify new autophagy proteins that regulate autophagosome and substrate specificity, Behrends et al. used mass spectrometry to generate a network of autophagy protein-protein interactions [16]. Specifically, they expressed tagged versions of a subset of human proteins that were previously linked with autophagy or vesicle trafficking in HEK293T cells, and the coimmunoprecipitated proteins were identified by mass spectrometry. The resulting 409 high-confidence candidate interaction proteins were organized into an autophagy interaction network. While some of the identified interactors have been validated in vivo, the network as a whole has not been tested beyond the original transformed HEK293T and U2OS cell lines, and remains a relatively untapped resource.
Given the diversity of autophagy targets and regulation, it is important to characterize autophagy in various cell types and conditions. Thus, we decided to make use of a primary muscle cell culture system to assay the role of putative autophagy regulators in the specific context of this tissue. Drosophila melanogaster primary myoblast cultures can be easily prepared from gastrulating embryos in which myoblast cell fate is already defined. Myoblast fusion occurs in cultured cells, resulting in the formation of multi-nucleate myotubes [17]. These myotubes further differentiate to form a well-patterned myofibril structure according to the timeline of larval development [17]. Importantly, these myotubes actively contract in live culture, indicating that they are metabolically active and fully functional cells. Furthermore, these primary cultured muscles are suitable for RNAi screening, as simple bathing of the cells in dsRNA-containing medium is sufficient for an effective and specific RNAi effect [18]. Following the RNAi screen in primary culture cells, selected hits can then be further validated in vivo, as we have previously established the D. melanogaster larval muscle as a model system to study the role and regulation of autophagy in skeletal muscle [19,20].
To use primary muscle cells in an RNAi autophagy screen, we first developed a robust autophagy assay. By treating the cultures with rapamycin (Rap) and chloroquine (CQ) we were able to induce an autophagic response, fully suppressible by knockdown of core ATG genes. Rap binds to and inhibits Tor complex 1 (TORC1) [10], thus inducing autophagy by releasing the inhibitory effect of Tor on Atg1 and autophagosome nucleation [11], while CQ blocks flux, causing accumulation of autolysosomes and autophagosomes [20–22]. Next, we used this system to screen D. melanogaster orthologs of the mammalian autophagy network of Behrends et al. This approach allowed us to identify several genes required for autophagosome formation, including orthologs of the Rab effectors Rabgap1 and Rab3Gap. The screen also highlights the critical roles of the proteasome and glycogen metabolism in regulating autophagy in muscle. In particular, we found that sustained proteasome inhibition inhibits autophagosome formation, even though autophagy normally acts to suppress ubiquitin aggregate formation in the muscle. Our data suggests that this is due to a link between muscle activity, aggregate formation, and autophagy. Finally, our analyses of glycogen metabolic genes in both the primary cultured and larval muscles indicate that glycogen storage enhances the autophagic response to starvation, an important insight given the link between glycogen storage disorders, autophagy, and muscle function.
Results
An autophagy assay in cultured primary muscles
To establish an autophagy assay in cultured primary muscles, we established cultures from Dmef2-Gal4, UAS-GFP-Atg8a embryos (Fig. 1). As previously described, these cultures contain a mixed population of cells, including neurons, fat, gut, and muscle cells [23,24]. Use of the Dmef2-Gal4 driver ensures that GFP-Atg8a fusion protein is expressed only in muscle cells, allowing us to analyze autophagy specifically in this one cell type. Cultures were also stained with Phalloidin (F-actin) to detect the striated sarcomeric structures. In untreated control cultures, GFP-Atg8a was distributed throughout the cytoplasm of muscle cells as well as nuclei (Fig. 1A, F). The presence of GFP-Atg8a in the nucleus is consistent with previous reports of nuclear localization of both GFP-tagged and endogenous LC3 in mammals [25–27]. To induce autophagy, we treated the cultures with rapamycin (Rap), a Tor inhibitor, which has been successfully used to activate autophagy in both D. melanogaster and higher organisms [10,28]. After 12 hrs of Rap treatment (200 nM), we observed the formation of GFP-Atg8a punctae in the muscles, consistent with the drug inducing autophagy (Fig. 1B, F). However, the small size of the punctae, and the poor contrast between the putative autophagosomes and the GFP-Atg8a background staining, indicated that this phenotype would not be suitable for screening. Thus, to generate a more robust phenotype, we treated the cultures with chloroquine (CQ). CQ and its closely related analog hydroxychloroquine are 4-aminoquinoline compounds widely used to treat malaria, rheumatoid arthritis and lupus erythematosus [29–31]. The drugs are highly lysosomotropic, causing an increase in lysosomal pH, blocking autophagic flux, leading to accumulation of autophagosomes and autolysosomes [21,22]. We previously showed that treatment of D. melanogaster larvae with CQ in conjunction with starvation was able to induce a robust autophagy phenotype in skeletal muscles in vivo [19,20]. In cultured cells, 12 hrs of CQ treatment (200 μM) induced the formation of large GFP-Atg8a punctae (Fig. 1C, F). The induction of autophagy by CQ treatment is consistent with the view that CQ inhibits mTORC1 activity in mammalian cells [32]. Addition of both CQ and Rap together increased GFP-Atg8a punctae area more than either drug alone (Fig. 1D, F), indicating that CQ was able to inhibit the autophagic flux induced by Rap. The resulting enlarged punctae were distributed throughout the cytoplasm, generally in between the myofibers marked by Phalloidin stain. Next, we tested whether the formation of the GFP-Atg8a punctae observed in the cultured muscles requires a functional autophagy pathway. This is especially important as both endogenous Atg8 and GFP-Atg8a fusion proteins tend to be incorporated into intracellular protein aggregates, independent of autophagy, and therefore Atg8 or GFP-Atg8a positive punctae could represent either an aggregate or a bone fide autophagosome. Consistent with the latter interpretation, knockdown of the core autophagy gene Atg1 was able to completely suppress the formation of GFP-Atg8a punctae in the cultured Rap+CQ treated muscles (Fig. 1E, F).

An RNAi screen for autophagy genes
Having established a robust autophagic response in primary cultured muscles and shown by RNAi that it requires components of the autophagy pathway, we assembled a library of dsRNAs genes targeting the D. melanogaster orthologs of a mammalian autophagy network [16]. The complete list of mammalian genes and their D. melanogaster orthologs included in our set is shown in S1 Table. For the screen-outlined in Fig. 2A, genes were targeted by multiple independent dsRNAs and at least three replicates of each 384 well plate were screened. We scored autophagy levels by calculating the GFP-Atg8a vesicle area per muscle cell area for a given well (S1 Fig.), and analyzed the strength of the phenotype using the Strictly Standardized Mean Difference (SSMD) method [33,34]. Developed for analysis of RNAi screen data sets, SSMD is the ratio between the difference of the means and the standard deviation of the difference between positive and negative controls (see Materials and Methods for details). Using this method, negative control LacZ RNAi consistently failed to score, while positive control Atg18 RNAi consistently gave a score <-1, indicating strong autophagy suppression (S2 Fig.). A plot of the SSMD scores for each amplicon shows that we identified dsRNAs that caused both suppression and enhancement of autophagosome formation (Fig. 2B). We identified 47 genes that when knocked down, suppressed autophagosome formation, and 25 genes with the opposite phenotype (Table 1, Table 2, S1 Table). It is important to note that in using CQ to boost the autophagy signal we likely masked the effect of some genes that normally promote autophagosome-lysosome fusion and subsequent flux of autolysosomes. Further, by treating with Rap we will also masked genes involved in the regulation of autophagy upstream of the Tor pathway. Nonetheless, of 17 core autophagy genes included in the set only Atg8a (which we are overexpressing in the GFP-tagged form) and Atg4 failed to score (Fig. 2D-E), indicating the suitability of our approach for identifying genes required for autophagosome formation. Overall, at least 40% of the genes included in the screen are good candidates for autophagy pathway components/regulators in the D. melanogaster muscle. Fig. 2D shows a projection of the hits that score in our assay onto the 187 human genes from the network of Behrends et al. (2010). Gene Ontology (GO) analysis identified autophagy and cellular catabolism as the two most enriched terms (Fig. 2C), which is expected considering that our starting set was derived from an autophagy protein-protein interaction network. Interestingly, glucose and polysaccharide metabolism and glycogen biosynthesis were also enriched terms, suggesting that sugar metabolism plays an important role in muscle autophagy.


Extended proteasome knockdown blocks the autophagy induction normally seen with short-term proteasome inhibition
Interestingly, among the positive regulator candidates of autophagy were the D. melanogaster orthologs of the human proteasome components PSMC2 (D.m. gene Rpt1), and PSMD2 (D.m. gene Rpn1). It has been widely reported that proteasome inhibition causes increased autophagy [35], but dsRNAs targeting these core components of the proteasome complex inhibited rather than induced the formation of GFP-Atg8a punctae in the primary cultured muscles (Table 1 and Fig. 3A-D). To determine whether this also occurred in vivo we examined the effect of proteasome knockdown in the larval skeletal musculature of Dmef2-Gal4, UAS-GFP-Atg8a animals. In fed animals, GFP-Atg8a was distributed throughout the muscle cytoplasm and nuclei (S3A Fig.). In contrast, in larvae starved on low nutrient food for 6 hrs, GFP-Atg8a localized to small punctae surrounding the nuclei and between the myofibrils (S3B Fig.). Starvation on low nutrient food + CQ for 6 hrs caused induction of much larger and more numerous punctae than those in the non-treated muscle, but were similarly distributed around the nucleus and between myofibrils (S3C Fig.). Next, we compared the effect of Rpn1 RNAi to control white RNAi. As expected, the control muscles accumulated large GFP-Atg8a punctae when starved and treated with CQ (Fig. 3E, G). Staining with an antibody that recognizes mono and poly-ubiquitinated proteins revealed that only a small proportion of the GFP-Atg8a colocalized with ubiquitin (Fig. 3E, G). In contrast, Rpn1 knockdown reduced the number of GFP-Atg8a punctae, and dramatically increased the proportion that colocalized with ubiquitin (Fig. 3F, G). To determine whether this finding was unique to Rpn1, we tested by RNAi the effect of knocking down other proteasome subunits. Consistent with the Rpn1 result, several components of both the 19 and 20S proteasome subunits gave a similar phenotype (S4 Fig.). Thus, sustained knockdown of the proteasome both in cultured primary muscles and in the larval musculature inhibits autophagy.

We next assayed the effect of proteasome inhibition in the absence of CQ on autophagosome and autolysosome formation and flux. Using Dmef2-Gal4 we drove expression of a UAS-GFP-mCherry-Atg8a transgene [36]. The double-tagged Atg8a protein fluoresces yellow in autophagosomes, while the GFP is quenched in the acidic environment of the autolysosomes, leaving these structures red. In fed animals, GFP and mCherry colocalized throughout the cytoplasm and nuclei of the muscle. (S3F Fig.). Starvation for 6hrs induced punctae labeled by both GFP and mCherry (S3G, J Fig.), indicating that acidification of vesicles had not yet occurred. The proportion of vesicles labeled only by mCherry increased after 8 hrs starvation (S3H, J Fig.), and by 10 hrs after starvation most punctae lacked GFP fluorescence (S3I, J Fig.). Using this system we compared the effect of Rpn1 RNAi to white RNAi control muscles. As expected, knockdown of white had no effect on the ratio of the mCherry and GFP signals after 6hrs of starvation (Fig. 3H, J, S3L Fig.). Rpn1 knockdown significantly reduced the number of both GFP and mCherry labeled vesicles, but did not affect their ratio (Fig. 3I, J, S3K, S3L Fig.), indicating that autophagic flux was not altered. Consistent with these results, we also found that Rpn1 knockdown reduced the number of GFP-Lamp1 labeled vesicles in both starved and starved +CQ larval muscles (S5 Fig.).
To eliminate the possibility that the above phenotypes are an artifact of overexpressed Atg8a transgenes, we next performed a Western blot on larval muscle lysate using a previously described Atg8a antibody [37] (Fig. 3K). In fed Dmef2-Gal4/UAS-white RNAi larvae, endogenous Atg8a appeared as a single band (Atg8a-I). Starvation of Dmef2-Gal4/UAS-white RNAi larvae for 6 hrs on low nutrient food induced the appearance of an additional smaller band (Atg8a-II), which represents lipidated Atg8a and indicates increased autophagy [38]. We also observed a slight change in the mobility of the Atg8a-I band in the starved muscle relative to fed muscle. No Atg8a-II band appeared in either starved Dmef2-Gal4/UAS-Atg1 RNAi larvae or starved Dmef2-Gal4/UAS-Rpn1 RNAi larvae, indicating reduced autophagy, consistent with the GFP-Atg8a immunofluorescence phenotypes in both primary cultured muscles and larval muscles.
Increased autophagy has been previously reported in other models of proteasome inhibition. Rap-induced autophagy in either cell culture or mice has been shown to protect against cell death caused by proteasome inhibition [39] and upregulation of autophagy has been shown to protect against loss of proteasome activity in D. melanogaster [40]. Thus, we hypothesized that the extended time period of proteasome inhibition might explain the difference between these previous studies and the reduced autophagy observed with proteasome knockdown. To test this hypothesis, we used a dominant temperature sensitive allele of the Pros26 gene (DTS5), the D. melanogaster ortholog of the human PSMB1 gene, encoding the proteasome b6 subunit [41,42]. Overexpression of UAS-DTS5 allowed us to modulate the time period of proteasome disruption, since the allele only inhibits the proteasome at the restrictive temperature. When shifted to the restrictive temperature for 18 hrs, UAS-DTS5; Dmef2-Gal4, UAS-GFP-Atg8a larvae, starved and treated with CQ 6hrs prior to dissection, accumulated large numbers of GFP-Atg8a punctae in their muscles similar to control Dmef2-Gal4, UAS-GFP-Atg8a larvae (Fig. 4A, B, E). Compared to the control larvae, however, we observed a significant increase in colocalization between GFP-Atg8a and ubiquitin in UAS-DTS5; Dmef2-Gal4, UAS-GFP-Atg8a larvae (Fig. 4A, B, E). When we performed the same experiment with a longer 48 hrs temperature shift, GFP-Atg8a punctae formation was dramatically reduced in DTS compared to control muscles, resembling the phenotype associated with Rpn1 knockdown (Fig. 3F, 4C-E). Surprisingly given the extended period of proteasome inhibition, the amount of ubiquitin aggregates appear reduced compared to the shorter 18 hrs temperature shift (Fig. 4B, D). We confirmed the effect of the DTS mutant on endogenous Atg8a by Western blot (Fig. 4F). Following 6 hrs of starvation lipidated Atg8a was observed in Dmef2-Gal4 control muscles at both 18 and 48 hrs PS. UAS-DTS5; Dmef2-Gal4 muscles also showed normal autophagy induction at 18 hrs PS, but at 48 hrs PS only the non-lipidated Atg8a-I form was present.

The finding that proteasome inhibition did not simply cause progressive increase of aggregates in the muscle led us to perform a time course analysis of aggregate number, GFP-Atg8a punctae number, and larval locomotion from 0 to 48 hrs after shifting UAS-DTS5; Dmef2-Gal4, UAS-GFP-Atg8a larvae to the restrictive temperature. Prior to dissection, each animal was starved for 6 hrs to heighten autophagy induction. Both the number of ubiquitin aggregates and autophagosomes peaked between 12–24 hrs post shift (PS), then decreased significantly from 24 to 48 hrs PS (Fig. 5A, B). Larval crawling time, gradually and significantly worsened from 18 to 48 hrs PS, indicating that proteasome inhibition causes a strong locomotion defect (Fig. 5C). Given these results, we hypothesized that reduced muscle activity/locomotion might influence aggregate formation and autophagy induction in response to proteasome inhibition. To test this, we fed both Dmef2-Gal4, UAS-GFP-Atg8a and UAS-DTS5;Dmef2-Gal4, UAS-GFP-Atg8a animals with the biogenic amine tyramine (Tyr), which has previously been shown to cause reduced locomotion in D. melanogaster larvae [43] (Fig. 5D-H). At the restrictive temperature this caused a significant increase in crawling time of the Dmef2-Gal4, UAS-GFP-Atg8a larvae and doubled the crawling time of the UAS-DTS5; Dmef2-Gal4, UAS-GFP-Atg8a larvae (Fig. 5H). Consistent with our hypothesis, Tyr treatment significantly reduced autophagosome number and aggregate number 18 hrs PS in the DTS mutant larvae (Fig. 5E-G). No significant change was observed for the Dmef2-Gal4, UAS-GFP-Atg8a control (Fig. 5D, F, G). We confirmed these results by Western blot of endogenous Atg8a (Fig. 5I). Tyr treatment reduced starvation-induced Atg8a-II formation in UAS-DTS5; Dmef2-Gal4 but not control Dmef2-Gal4 muscles 18 hrs PS. Taken together, these results indicate that autophagy of protein aggregates is triggered by proteasome inhibition, but reduced larval locomotion attenuates this response if inhibition is prolonged.

The D. melanogaster orthologs of RABGAP1, RAB3GAP1, and the Rab effector protein ANKFY1 are required in vivo for autophagy in the muscle
In addition to proteasome components, another well-represented category of screen hits were involved in vesicle trafficking. Many of these could be included in the core autophagy pathway, but others have been uncharacterized in the context of autophagy. This latter group includes the Rab GTPase-activating proteins CG7112 (H. sapiens RABGAP1 and RABGAP1L), CG31935 (H. sapiens RAB3GAP1), and Rab3-GAP (H. sapiens RAB3GAP2), and the Rab effector CG41099 (H. sapiens ANKFY1) (Fig. 6A-C). ANKFY1 has been previously identified as a Rab5 effector that localizes to early endosomes and stimulates their fusion activity [44]. In the primary culture screen, knockdown of CG41099 inhibited autophagosome formation (Table 1). Consistent with this data, knockdown of CG41099 in larval muscles strongly inhibited the formation of enlarged GFP-Atg8a vesicles induced by starvation and CQ treatment (Fig. 6E, N). Interestingly, this phenotype appears to be due to a change in autophagic flux, as CG41099 knockdown caused the ratio of mCherry to GFP fluorescence to significantly increase when assayed with the GFP-mCherry-Atg8a reporter (S3L Fig.). We likewise tested the in vivo function of CG7112, CG31935 and Rab3-GAP, each of which identified as a positive regulator of autophagy in the primary culture screen. Knockdown of any of these genes strongly inhibited starvation induced autophagosome formation in the larval muscle with or without CQ treatment (Fig. 6F-H, N, S3K Fig.) and had no significant effect on autophagic flux (S3L Fig.).
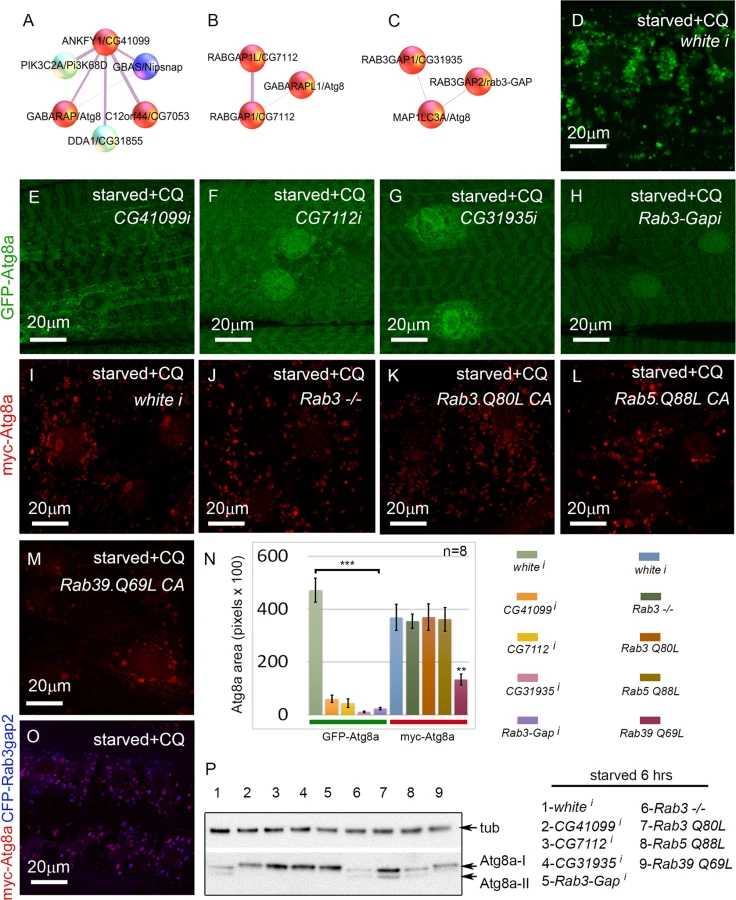
Interestingly, D. melanogaster CG31935 and Rab3-GAP do not appear to influence autophagy via regulation of Rab3 activity, as larvae expressing a constitutive active form of Rab3 showed no change in the accumulation of myc-Atg8a-labeled autophagosomes (Fig. 6I, K, N). Larvae homozygous for a null allele of Rab3 had a statistically insignificant inhibition of autophagosome formation compared to control larvae (Fig. 6J, N). We also tested the constitutive active forms of Rab5 and Rab39, as orthologs of these have been shown to interact with mammalian RAB3GAP1 in vitro [45]. Larvae expressing Rab5-CA had normal levels of autophagy in starved +CQ muscles (Fig. 6L, N). Interestingly, Rab39-CA overexpression significantly reduced autophagy similar to CG31935 and Rab3-GAP RNAi (Fig. 6M-N). We confirmed the autophagy phenotypes of the above Rab, Rab-GAP, and Rab effector genes by Atg8a Western blot (Fig. 6P). Consistent with the immunofluorescence data, knockdown of CG41099, CG7112, CG31935, Rab3-Gap and overexpression of Rab39-CA reduced Atg8a lipidation in response to 6 hrs starvation. The human protein-protein interaction data suggests that Rab3-GAP might also interact with Atg8a (Fig. 6C). Consistent with this, we found nearly perfect colocalization in the larval muscles between overexpressed myc-Atg8a and CFP-Rab3-GAP in punctae induced by starvation and CQ treatment (Fig. 6O). Taken together, these results show that Rab GTPase-activating proteins, Rab39, and a Rab effector protein are required for autophagy in vivo.
Glycogen storage enhances the autophagic response to starvation
Strikingly, several genes, Pfk (H. sapiens PFKP and PFKL), CG9485 (H. sapiens AGL), and GlyS (H. sapiens GYS1), involved in glycogen biosynthesis were hits in the screen (Fig. 2C). Glys encodes glycogen synthase, which we have recently shown is required for glycogen synthesis and autophagosome formation in the D. melanogaster musculature [20]. Consistent with this, we found that Glys knockdown reduced autophagy in the primary culture screen (Fig. 7B, E; Table 2). In contrast, knockdown of either Pfk (Fig. 7C, E), which encodes phosphofructokinase, or CG9485 (Fig. 7D, E), which encodes glycogen debranching enzyme, caused increased autophagy in the primary muscle assay (Table 1; Table 2). To further analyze the role of glycogen branching in muscle autophagy, we examined the effect of CG9485 knockdown in vivo. We first reduced the CQ feeding treatment from 2.5 to 1mg/ml, so that the enhancement of autophagy would be easier to visualize. Control white RNAi larvae starved for 6 hrs and treated with this lower CQ concentration still accumulated autophagosomes (Fig. 7F), but fewer than in larvae treated with 2.5 mg/ml CQ (S3C Fig.). Consistent with the results of the primary culture screen, knockdown of CG9485 in the larval muscle caused a significant increase in autophagic vesicle accumulation compared to the white RNAi control (Fig. 7F, G, I), indicating that this enzyme, which promotes glycogen breakdown, also suppresses autophagy. The effect of CG9485 knockdown was also examined for starved larvae without the addition of CQ, using the GFP-mCherry-Atg8a reporter, which showed significantly increased punctae formation (S3K Fig.), but no significant block of autophagic flux (S3L Fig.). Thus the increased Atg8a punctae caused by CG9485 knockdown is due to increased autophagy induction.

Next, we tested whether the D. melanogaster glycogen branching enzyme (AGBE), which carries out the opposite reaction to CG9485, and hence promotes glycogen storage, would likewise have an autophagy phenotype in vivo. AGBE RNAi larvae starved for 6 hrs and treated with 1 mg/ml CQ had dramatically reduced GFP-Atg8a accumulation in their muscles compared to both control and CG9485 RNAi larvae (Fig. 7F-I). The GFP-Atg8a punctae in the AGBE RNAi muscles are much smaller than in control larvae (Fig. 7F, H), suggesting that the effect of knockdown may be on autophagosome growth and/or maturation rather than induction. Consistent with this, we did not see a reduction in punctae number with the GFP-mCherry reporter in starved larvae (S3K Fig.), nor an effect on flux (S3L Fig.). Finally, we performed a Western blot of endogenous Atg8a from CG9485 and AGBE RNAi muscles (Fig. 7J). 6 hrs of starvation caused the appearance of the Atg8a-II form in CG9485 RNAi and control animals, but was absent in the AGBE knockdown, consistent with the immunofluorescence data. We also observed an increase in the levels of both Atg8a-I and Atg8a-II in the CG9485 larvae, but the effect was subtle. Taken together, these analyses suggest that the levels of glycogen storage modulate the autophagic response to starvation in the muscle.
Discussion
Primary muscle cells as a tool to screen for autophagy genes
Since the identification of the core autophagy genes in yeast, tissue culture cell lines have been the primary tool to evaluate the role and regulation of autophagy in higher organisms. However, since autophagy is a tissue-specific, context dependent process, stable cell lines can only give a limited view of the autophagic process. Further, as cell lines have adapted to the culture medium, sometimes changing ploidy and activating signaling pathways, they can be a misleading indicator of in vivo gene function.
To overcome some of the limitations associated with established tissue culture cell lines, we used primary muscle culture system that we previously showed are amenable to RNAi screening [18,23,24]. We established a robust autophagy assay by treatment with Rap and CQ, and were able to suppress autophagy by simply bathing the cells in dsRNA targeting core autophagy components. The primary muscle screen allows for rapid analysis of multiple dsRNA reagents targeting the same gene in a carefully controlled environment. It also allows for the analysis of genes that may have a deleterious effect on animal viability if disrupted in vivo. In comparison, one of the difficulties associated with in vivo screening for autophagy genes is that autophagosome formation in vivo must be carefully controlled as the age, nutritional state, and stress level of the animals, impact autophagy levels. Further, dissection and processing of muscle samples is time consuming and introduces additional variability.
Validation of the human autophagy protein-protein interaction network
To identify new autophagy proteins that regulate the autophagy pathway, Behrends et al. used mass spectrometry to generate a network of autophagy protein-protein interactions, representing the unstimulated basal state in tissue culture cells [16]. The resulting 409 high-confidence candidate interaction proteins were organized into an autophagy interaction network. Additional RNAi analysis of 86 genes from the network in U2OS human osteosarcoma cells revealed that many of these genes behaved as bone fide autophagy regulators. However, most components of the set have not been validated for their roles in autophagy, even in cultured cell lines. We therefore generated a set of D. melanogaster orthologs comprising 40% of the total human high confidence interacting proteins, tested whether any gave an autophagy phenotype in the specific context of muscle cells, and found that 40% of these had an autophagy phenotype in the muscle. This is much greater than the percentage of hits expected from a random set of genes. For example, in another RNAi screen in D. melanogaster primary cells, the number of genes affecting muscle morphology was only 4.3% of 1140 randomly chosen genes [18]. In addition, a full genome screen in D. melanogaster primary neurons identified only 1% of genes affecting neuronal morphology [46]. While neither of these are an ideal comparison to the primary culture autophagy screen, their much lower hit rates suggest that the screening set we used was highly enriched for autophagy regulators.
Glucose and glycogen metabolism as autophagy regulators in the muscle
Consistent with the glycolytic metabolism of larval muscles, we identified several genes involved in glucose and glycogen metabolism as autophagy regulators in the muscle. Knockdown of the enzyme phosphofructokinase (Pfk), which is essential for glycolysis, and the glycogen debranching enzyme (CG9485), caused increased autophagy in the muscle. In humans, mutations in the glycogen debranching enzyme (AGL) and the muscle isoform of PFK cause or Glycogen Storage Disease type III and Glycogen storage disease type VII, respectively [47]. Both diseases are characterized by the accumulation of excessive glycogen in muscles. Interestingly, a recent report showed that PFK deficiency inhibits the ability of rheumatoid arthritis T-cells to activate autophagy [48]. Like D. melanogaster skeletal muscles, T-cells rely primarily on glycolysis [49], suggesting that the link between glycogen metabolism and autophagy might be a general property of highly glycolytic cells. In contrast to PFK and debranching enzyme, knockdown of AGBE, the D. melanogaster glycogen branching enzyme, dramatically reduced the formation of large GFP-Atg8a vesicles. This enzyme normally promotes the formation of properly branched glycogen particles in the muscle. Thus, genes required for efficient glycogen breakdown, Pfk and CG9485, inhibit starvation-induced autophagy, and a gene responsible for producing glycogen, AGBE, promotes starvation-induced autophagy. These observations extend our previous finding that glycogen is a major cargo of autophagosomes ifn the larval muscle, and that GlyS acts as an important regulator of autophagosome formation [20]. That these other glycogen metabolism enzymes influence autophagy suggests that in addition to the specific role of GlyS, overall glycogen levels in the muscle also help determine autophagy levels. A similar correlation has been recently reported in mammalian cardiac muscle, where increased glycogen content in female hearts was also accompanied by increased autophagy [50]. Altogether, our observation that genetic manipulation of glycogen storage impacts muscle autophagy levels has important implications for both skeletal and cardiac myopathies and glycogen storage diseases that are associated with aberrant glycogen autophagy.
Proteasome subunits as autophagy regulators in our screen
Given that proteasome inhibitors have been previously shown to activate autophagy [35], it was expected that we might identify proteasome subunits as autophagy regulators in our screen. Unexpectedly however, we found that knockdown of proteasome components, Pros26.4 (H. sapiens PSMC1), Rpt1 (H. sapiens PSMC2), and Rpn1 (H. sapiens PSMD2), inhibited autophagosome formation. Knockdown of other proteasome subunits gave the opposite phenotype. The variation in the direction of proteasome phenotypes is likely due to the level of proteasome dysfunction rather than to the specific roles of the proteasome subunits, since knockdown of subunits in the larval muscle consistently inhibited autophagosome formation. Our data indicates that the sustained, high level of proteasome inhibition achieved by subunit knockdown is incompatible with autophagy. However, short-term proteasome inhibition via overexpression of temperature sensitive proteasome alleles did induce an autophagic response, consistent with previous reports for both D. melanogaster muscle and diverse mammalian tissues [39,40,51]. Surprisingly, we found that both ubiquitin aggregates and GFP-Atg8a punctae were reduced after about a day of proteasome inhibition in vivo, accompanied by progressive locomotor dysfunction. Tyramine treatment inhibited locomotion and likewise reduced the formation of aggregates and autophagosomes. We propose that proteasome inhibition induces a burst of aggregate formation and autophagy in the muscle, but diminished muscle activity subsequently suppresses both. Strenuous physical activity has been linked to the production of reactive oxygen species and mechanical damage of mitochondria in muscle [52] and to autophagy in the D. melanogaster flight muscle [53]. Our data suggests that larval muscle contraction may drive the accumulation of aggregates and increased autophagy that manifest during proteasome inhibition.
Roles of Rab GTPases and a Rab effector during autophagy
It has recently become clear that Rab GTPases play critical roles in membrane trafficking events during autophagy. This large family of small monomeric GTPases localize to different membranes in the cell, where they recruit effector proteins that carry out membrane transport functions. We identified the Rab effector CG41099 (ANKFY1) as an important regulator of autophagosome formation in the muscle system (Fig. 5E, N). ANKFY1 was previously identified as a Rab5 effector that localizes to early endosomes and stimulates their fusion activity [44]. Depletion of ANKFY1 in human cell culture experiments led to increased autophagosomal number without blocking flux [16], however, we observed that knockdown of CG41099 inhibited the formation of enlarged CQ-induced vesicles and increased the amount of autolysosomes compared to autophagosomes. This contradiction could reflect real biological differences between the two species and cell types or reflect differences in the assays. The effect of CG41099 knockdown on flux is consistent with a previous report that ANKFY1 can localize to the endosomal and lysosomal membranes [44].
Rab GTPase-activating proteins (Rab GAPs) negatively regulate the activity of Rab GTPases by catalyzing the conversion of GTP to GDP [54]. Interestingly, several Rab GAPs are recruited to autophagosomes by direct interactions with ATG8 homologs, where they regulate autophagosome maturation and fusion events [55]. For example, the Rab GAP TBC1D5 mediates autophagosome maturation and has been proposed to act as a molecular switch between endosome and autophagosome biogenesis [55]. Through our screen and in vivo follow-up, we identified the Rab GTPase-activating proteins CG7112 (H. sapiens RABGAP1 and RABGAP1L), CG31935 (H. sapiens RAB3GAP1), and Rab3-GAP (H. Sapiens RAB3GAP2) as regulators of autophagosome formation in muscles. RABGAP1 and RABGAP1L have previously been shown to act on Rab6 and Rab22A, 34, 39B, respectively [56]. RABGAP1, RABGAP1L, and RAB3GAP1 have each been shown to interact with ATG8 homologs [16,55], but to our knowledge, none have been shown to have an in vivo function in autophagy prior to this study. RAB3GAP1 and RAB3GAP2 are the catalytic and non-catalytic subunits of the Rab3GAP complex, which acts on Rab3 isoforms [57,58]. Mutations in these genes, which have heightened expression in the brain, cause Micro syndrome and Martsolf syndrome, related rare disorders characterized by microcephaly, microphthalmia, cataracts and intellectual disability [59]. D. melanogaster CG31935 and Rab3-GAP mutant neurons have a defect in neurotransmitter release that is suppressed in Rab3 mutants [60]. Our results indicate that the function of these proteins in muscle autophagy is not mediated through Rab3, since neither Rab3 mutants nor expression of a constitutively active form of Rab3 had an effect on autophagosome formation. Finally, Rab3 expression in D. melanogaster is very low outside of the central nervous system.
Further research will be needed to establish how CG7112, CG31935 and Rab3GAP influence membrane trafficking and autophagosome formation, particularly, which Rab proteins mediate their effect in muscle. Intriguingly, we found that expression of a constitutive active form of Rab39 caused an autophagy phenotype similar to CG7112, CG31935 and Rab3-GAP knockdown, suggesting that Rab39 may function downstream of one of these Rab GAPs during autophagy regulation. The suppression of autophagy that we observed by overexpression of constitutively active Rab39 is consistent with a previous report that mammalian Rab39a negatively regulates LPS-induced autophagy in macrophages[61]. Our results also highlight that the role of the human RAB3GAP genes in the etiology of Micro and Martsolf syndromes might involve defects in autophagy, in addition to other vesicle trafficking pathways.
Materials and Methods
Fly stocks
yw; Dmef2-Gal4 [62]; Dmef2-Gal4 was recombined with UAS-GFP-Atg8a [63]; UAS-GFP-mCherry-Atg8a [36]; UAS-GFP-Lamp1 [64]; UAS-DTS5 [42]; Rab3rup [65]; UAS-CFP-Rab3-GAP [60]; UAS-YFP.Rab3.Q80L [66]; UAS-YFP.Rab5.Q88L [66]; UAS-YFP.Rab39.Q69L [66]. The following UAS-RNAi lines were obtained from the DRSC/TRiP DRSC/TRiP at Harvard Medical School (http://www.flyrnai.org/TRiP-HOME.html): white (HMS0004); Rpn1 (HMS01337); Prosalpha5 (HMS00095); Prosbeta5 (HMS00119); Prosbeta7 (HMS00122); CG9588 (HM05013); Mov34 (JF01140); Rpn9 (HMS01007); Rpn12 (HMS01032); CG41099 (HMS01228); CG7112 (HMS01132); Rab3-GAP (JF01601); CG9485 (HMS01321); AGBE (HMS02027). The RNAi line targeting CG31935 (NIG31935R-1) was obtained from the NIG Japan. Unless otherwise noted, flies were reared at 25°C.
Generation of UAS-myc-Atg8a transgenic flies
Atg8a cDNA LD05816 was cloned into the Gateway entry vector according to the pENTR Directional TOPO Cloning system (Invitrogen), then cloned into pTMW = N-terminal 6xMyc tag under the control of the UASt promoter. This destination vector was created at the Drosophila Gateway Collection, and obtained from the Drosophila Genomics Resource Center. Integration into the genome was performed using standard methods.
Feeding protocol, and drug treatment
All fly crosses and larvae were maintained in vials containing ‘standard’ food composed of 16.5 g/L yeast, 9.5 g/L soy flour, 71 g/L cornmeal, 5.5 g/L agar, 5.5 g/L malt, 7.5% corn syrup, 0.4% propionic acid, and 1.3% Tegosept. For starvation induced autophagy experiments 3rd instar larvae were individually selected and no more than 20 per experiment were transferred to ‘low nutrient food’ composed of 0.3X standard food as described previously [20]. For each genotype, at least 6 larvae from at least two independent vials were analyzed. For drug treatments, chloroquine diphosphate salt (Sigma) was added to the food at 2.5 mg/ml or 1.0 mg/mg as indicated in the text, and tyramine (Sigma) was added at 50 mg/ml or 100 mg/ml 18 hrs prior to dissection.
Temperature sensitive alleles
Prior to experiments larvae were reared at 22°C. Vials were transferred to the restrictive temperature of 29°C to induce proteasome inhibition and maintained at this temperature for the duration of the experiment. Transfer to starvation food +/ - CQ was done 6hrs prior to dissection.
Larval locomotor assays
Assays were based on previously published methods [20,67]. For the crawling assay, larvae were positioned at one end of a furrow on the surface of a sylgard plate, with a yeast ball at the far end. The time to crawl 3cm was measured 3 times, with the final successful trial used as data for analysis. Trials in which the larva crawled over the edge of the lane were considered unsuccessful, and the larvae were reset at the starting point.
Larval muscle immunostaining and antibodies
For whole-mount immunostaining of fly tissues, 3rd instar larval body wall muscles were dissected according to [68] and fixed for 15 min in PBS with 4% formaldehyde. After washing in PBT (1X PBS + 0.1% Triton X-100), samples were incubated overnight with the following antibodies (in PBT): mouse anti-Poly-Ubiquitin, 1 : 300 (FK2; Enzo life sciences), Rabbit anti-myc-tag, 1 : 200 (71D10; Cell Signaling). After incubation with primary antibodies, the samples were washed in PBT and incubated with Alexa-conjugated secondary antibodies (Molecular Probes, 1 : 1000) and/or Alexa 635-conjugated phalloidin (1 : 1000) to visualize F-actin. Nuclei were visualized by DAPI staining (1μg/ml). Samples were washed in PBT and mounted in 1 : 1 glycerol/PBS and images were acquired with a Leica SP2 laser scanning confocal microscope.
Larval muscle western blots
Prior to dissection larvae were fed on standard food, then 10–12 larvae of each genotype were transferred to new vials containing either standard food or low-nutrient food for 6 hrs. Third instar larvae were dissected to obtain a carcass with only muscles remaining attached. Dissections were collected in lysis buffer (120mM NaCl, 50mM Tris-HCl, 1% Nonidet P-40, 1× protease and phosphatase inhibitor cocktail [Thermo Scientific]). After homogenization, debris was removed by centrifuging once at 1,200 × g for 5 min and once at 13,000 × g for 5 min. Western blot was performed using standard protocols. Antibodies used are: rabbit anti-dAtg8 [37] (1 : 1000, gift from Katja Köhler) and mouse anti-Tubulin (1 : 5,000 Sigma-Aldrich T6199).
Larval muscle image analysis
For quantification of autophagy area, z-stacks at 40X of single larval longitudinal muscles were obtained by confocal microscopy with consistent laser power settings. ImageJ was used to produce a maximum intensity projection of the stack [69]. Threshold of the GFP-Atg8a channel was produced with the Robust Automatic Threshold Selection (RATS) Plugin with the noise threshold = 20, lambda factor = 3, and min leaf size = 100. This allowed for the elimination of background signal not beloning to any autophagosomal structure, and the area of the remaining signal was calculated to determine the GFP-Atg8a punctae area per muscle. At lease five ventral longitudinal muscles from individual animals were analyzed for each genotype. For quantification of autophagic vesicle and ubiquitin puncta number single confocal sections were obtained at 40X at the level of the nucleus with consistent laser power. ImageJ was used to threshold the red and green channels (with RATS as above) and count the GFP-Atg8a and ubiquitin dots in single ventral longitudinal muscles of 8 or more individual animals. The Manders’ Overlap Coefficient (MOC) measurement of red and green channel colocalization was calculated using a previously described ImageJ Plugin [32]. For all image analysis mean values were plotted, with error bars indicating the standard error of the mean. p-values were calculated by Student’s t-test.
Identification of orthologs
D. melanogaster orthologs of the 409 high-confidence candidate interaction proteins previously identified by mass-spec [16] were identified by comparing the fruit fly and human genomes using the OrthoMCL algorithm [70]. Human and fly protein sequences were extracted from UniProt (r.2010_04) and FlyBase (r.5.24), respectively. The resulting protein sequence database was used to run all-against-all protein sequence comparisons with BLASTP and subsequent MCL clustering of a sequence similarity matrix, as described in [70]. Based on empirical studies, an inflation value of 1.5 was selected to control cluster tightness during MCL clustering. Also, an e-value of 1e-10 and 65% sequence similarity threshold were chosen to obtain orthologous and co-orthologous protein pairs.
Preparation of dsRNAs
Gene-specific dsRNAs were prepared as described previously [71]. Briefly, amplicons (∼200–500 bp) were amplified by PCR from genomic DNA, using synthesized oligos with an attached T7 sequence. dsRNAs from the PCR templates were transcribed with the T7 Megascript kit (Ambion), and product size was confirmed by gel electrophoresis. Following purification with Millipore Multiscreen PCR plates (#MANU03050), dsRNAs were quantified by measurement of the OD260 (Nano-drop 8000, Fisher Scientific), then stored at-20°C until use.
Primary cell culture RNAi experiments
Embryonic primary cell cultures were isolated from gastrulating Dmef2-Gal4, UAS-GFP-Atg8a embryos as described previously [18,23,46,71], and seeded in 384-well plates at 4 X 10⁴ cells (10ml volume) per well. Each well contained 5ul dsRNA in water (0.25ug dsRNA) targeting a gene from the autophagy network or control dsRNAs targeting lacZ (negative control), Atg18 (positive control) or thread (RNAi knockdown control). Following 20 hours incubation in serum-free M3 medium at 18°C, 30μl of serum-containing medium was added to each well for a final fetal calf serum concentration of 10%. Cells were then cultured for an additional 3 days at 25°C before addition of rapamycin (200 nM) and chloroquine (200uM). Cells were incubated for 12 hrs at 25°C before fixation for 2 hr in 2% formaldehyde. Cells were washed and stained overnight at 4°C with phalloidin Alexa Fluor 635 (Molecular Probes; 1 : 2000), and DAPI (Sigma, 1 : 5000), then washed again. All washes were performed in PBT, except for a final rinse in PBS prior to image analysis. This experiment was repeated to give 4 biological replicates of each amplicon.
Primary cell image analysis
Acquisition of high quality images of the primary cell culture was performed with the Evotec Opera microscope at the DRSC (www.flyrnai.org/). Using a 20X water immersion lens, 24 microscope fields were obtained per well for both GFP-Atg8a and phalloidin stains. Images were analyzed with MetaXpress High Content Image Acquisition & Analysis Software (Molecular Devices). Muscles were identified from the mixed population of cells by positive phalloidin staining as described previously [71]. Then, GFP-Atg8a vesicles were identified within these muscles using the MetaXpress granularity application module. Total GFP-Atg8a area was divided by total muscle area for each field. These values were then combined to give a measure of the total area of autophagosomes per muscle cell area per well. We used the MATLAB-based open-access software tool, GUItars, for subsequent calculation of SSMD scores of the RNAi screening data [72]. Strictly standardized mean difference (SSMD) of log-transformed data is the mean of log fold change divided by the standard deviation of log fold change between a dsRNA and a control reference [34]. The GUItars software uses the uniformly minimal variance unbiased estimate (UMVUE) of SSMD in the sample scoring [72,73]. To account for plate variability, the software first calculates the difference between the measured autophagosome area of given well and the median of a negative control (lacZ) in each plate and then calculates the SSMD. A gene was considered a regulator of autophagosome formation if two or more amplicons targeting that gene met the threshold (±0.5 SSMD). Other genes were considered for analysis if a single amplicon targeting the gene met the threshold (±1.0 SSMD) and none of the other amplicons targeting that gene met the threshold (±0.5 SSMD) in the opposite direction.
Supporting Information
Zdroje
1. Xie Z, Klionsky DJ (2007) Autophagosome formation: core machinery and adaptations. Nat Cell Biol 9 : 1102–1109. 17909521
2. Yang Z, Klionsky DJ (2011) Mammalian autophagy: core molecular machinery and signaling regulation. Curr Opin Cell Biol 22 : 124–131.
3. Nakatogawa H, Suzuki K, Kamada Y, Ohsumi Y (2009) Dynamics and diversity in autophagy mechanisms: lessons from yeast. Nat Rev Mol Cell Biol 10 : 458–467. doi: 10.1038/nrm2708 19491929
4. Rieder SE, Emr SD (1997) A novel RING finger protein complex essential for a late step in protein transport to the yeast vacuole. Mol Biol Cell 8 : 2307–2327. 9362071
5. Itakura E, Kishi-Itakura C, Mizushima N (2012) The hairpin-type tail-anchored SNARE syntaxin 17 targets to autophagosomes for fusion with endosomes/lysosomes. Cell 151 : 1256–1269. doi: 10.1016/j.cell.2012.11.001 23217709
6. Takats S, Pircs K, Nagy P, Varga A, Karpati M, et al. (2014) Interaction of the HOPS complex with Syntaxin 17 mediates autophagosome clearance in Drosophila. Mol Biol Cell 25 : 1338–1354. doi: 10.1091/mbc.E13-08-0449 24554766
7. Liang C, Lee JS, Inn KS, Gack MU, Li Q, et al. (2008) Beclin1-binding UVRAG targets the class C Vps complex to coordinate autophagosome maturation and endocytic trafficking. Nat Cell Biol 10 : 776–787. doi: 10.1038/ncb1740 18552835
8. Jiang P, Nishimura T, Sakamaki Y, Itakura E, Hatta T, et al. (2014) The HOPS complex mediates autophagosome-lysosome fusion through interaction with syntaxin 17. Mol Biol Cell 25 : 1327–1337. doi: 10.1091/mbc.E13-08-0447 24554770
9. Ishihara N, Hamasaki M, Yokota S, Suzuki K, Kamada Y, et al. (2001) Autophagosome requires specific early Sec proteins for its formation and NSF/SNARE for vacuolar fusion. Mol Biol Cell 12 : 3690–3702. 11694599
10. Laplante M, Sabatini DM (2012) mTOR signaling in growth control and disease. Cell 149 : 274–293. doi: 10.1016/j.cell.2012.03.017 22500797
11. Hosokawa N, Hara T, Kaizuka T, Kishi C, Takamura A, et al. (2009) Nutrient-dependent mTORC1 association with the ULK1-Atg13-FIP200 complex required for autophagy. Mol Biol Cell 20 : 1981–1991. doi: 10.1091/mbc.E08-12-1248 19211835
12. Chen Y, Klionsky DJ (2011) The regulation of autophagy—unanswered questions. J Cell Sci 124 : 161–170. doi: 10.1242/jcs.064576 21187343
13. Koren I, Reem E, Kimchi A (2010) DAP1, a novel substrate of mTOR, negatively regulates autophagy. Curr Biol 20 : 1093–1098. doi: 10.1016/j.cub.2010.04.041 20537536
14. Johansen T, Lamark T (2011) Selective autophagy mediated by autophagic adapter proteins. Autophagy 7 : 279–296. 21189453
15. Reggiori F, Komatsu M, Finley K, Simonsen A (2012) Autophagy: more than a nonselective pathway. Int J Cell Biol 2012 : 219625. doi: 10.1155/2012/219625 22666256
16. Behrends C, Sowa ME, Gygi SP, Harper JW (2010) Network organization of the human autophagy system. Nature 466 : 68–76. doi: 10.1038/nature09204 20562859
17. Bernstein SI, Fyrberg EA, Donady JJ (1978) Isolation and partial characterization of Drosophila myoblasts from primary cultures of embryonic cells. J Cell Biol 78 : 856–865. 100502
18. Bai J, Binari R, Ni JQ, Vijayakanthan M, Li HS, et al. (2008) RNA interference screening in Drosophila primary cells for genes involved in muscle assembly and maintenance. Development 135 : 1439–1449. doi: 10.1242/dev.012849 18359903
19. Vinayagam A, Zirin J, Roesel C, Hu Y, Yilmazel B, et al. (2013) Integrating protein-protein interaction networks with phenotypes reveals signs of interactions. Nat Methods In Press.
20. Zirin J, Nieuwenhuis J, Perrimon N (2013) Role of autophagy in glycogen breakdown and its relevance to chloroquine myopathy. PloS Biol 11.
21. Stauber WT, Hedge AM, Trout JJ, Schottelius BA (1981) Inhibition of lysosomal function in red and white skeletal muscles by chloroquine. Exp Neurol 71 : 295–306. 7004885
22. Yoon YH, Cho KS, Hwang JJ, Lee SJ, Choi JA, et al. (2010) Induction of lysosomal dilatation, arrested autophagy, and cell death by chloroquine in cultured ARPE-19 cells. Invest Ophthalmol Vis Sci 51 : 6030–6037. doi: 10.1167/iovs.10-5278 20574031
23. Bai J, Sepp KJ, Perrimon N (2009) Culture of Drosophila primary cells dissociated from gastrula embryos and their use in RNAi screening. Nat Protoc 4 : 1502–1512. doi: 10.1038/nprot.2009.147 19798083
24. Perrimon N, Zirin J, Bai J (2011) Primary cell cultures from Drosophila gastrula embryos. J Vis Exp.
25. Karim MR, Kanazawa T, Daigaku Y, Fujimura S, Miotto G, et al. (2007) Cytosolic LC3 ratio as a sensitive index of macroautophagy in isolated rat hepatocytes and H4-II-E cells. Autophagy 3 : 553–560. 17617739
26. Bampton ET, Goemans CG, Niranjan D, Mizushima N, Tolkovsky AM (2005) The dynamics of autophagy visualized in live cells: from autophagosome formation to fusion with endo/lysosomes. Autophagy 1 : 23–36. 16874023
27. Drake KR, Kang M, Kenworthy AK (2010) Nucleocytoplasmic distribution and dynamics of the autophagosome marker EGFP-LC3. PLoS One 5: e9806. doi: 10.1371/journal.pone.0009806 20352102
28. Zirin J, Perrimon N (2010) Drosophila as a model system to study autophagy. Semin Immunopathol 32 : 363–372. doi: 10.1007/s00281-010-0223-y 20798940
29. Breckenridge AM, Winstanley PA (1997) Clinical pharmacology and malaria. Ann Trop Med Parasitol 91 : 727–733. 9625927
30. Meinao IM, Sato EI, Andrade LE, Ferraz MB, Atra E (1996) Controlled trial with chloroquine diphosphate in systemic lupus erythematosus. Lupus 5 : 237–241. 8803897
31. Katz SJ, Russell AS (2011) Re-evaluation of antimalarials in treating rheumatic diseases: re-appreciation and insights into new mechanisms of action. Curr Opin Rheumatol 23 : 278–281. doi: 10.1097/BOR.0b013e32834456bf 21448012
32. Settembre C, Zoncu R, Medina DL, Vetrini F, Erdin S, et al. (2012) A lysosome-to-nucleus signalling mechanism senses and regulates the lysosome via mTOR and TFEB. EMBO J 31 : 1095–1108. doi: 10.1038/emboj.2012.32 22343943
33. Zhang XD, Ferrer M, Espeseth AS, Marine SD, Stec EM, et al. (2007) The use of strictly standardized mean difference for hit selection in primary RNA interference high-throughput screening experiments. J Biomol Screen 12 : 497–509. 17435171
34. Birmingham A, Selfors LM, Forster T, Wrobel D, Kennedy CJ, et al. (2009) Statistical methods for analysis of high-throughput RNA interference screens. Nat Methods 6 : 569–575. doi: 10.1038/nmeth.1351 19644458
35. Korolchuk VI, Menzies FM, Rubinsztein DC (2010) Mechanisms of cross-talk between the ubiquitin-proteasome and autophagy-lysosome systems. FEBS Lett 584 : 1393–1398. doi: 10.1016/j.febslet.2009.12.047 20040365
36. Nezis IP, Shravage BV, Sagona AP, Lamark T, Bjorkoy G, et al. (2010) Autophagic degradation of dBruce controls DNA fragmentation in nurse cells during late Drosophila melanogaster oogenesis. J Cell Biol 190 : 523–531. doi: 10.1083/jcb.201002035 20713604
37. Kramer H, Phistry M (1999) Genetic analysis of hook, a gene required for endocytic trafficking in drosophila. Genetics 151 : 675–684. 9927460
38. Kabeya Y, Mizushima N, Ueno T, Yamamoto A, Kirisako T, et al. (2000) LC3, a mammalian homologue of yeast Apg8p, is localized in autophagosome membranes after processing. EMBO J 19 : 5720–5728. 11060023
39. Pan T, Kondo S, Zhu W, Xie W, Jankovic J, et al. (2008) Neuroprotection of rapamycin in lactacystin-induced neurodegeneration via autophagy enhancement. Neurobiol Dis 32 : 16–25. doi: 10.1016/j.nbd.2008.06.003 18640276
40. Pandey UB, Nie Z, Batlevi Y, McCray BA, Ritson GP, et al. (2007) HDAC6 rescues neurodegeneration and provides an essential link between autophagy and the UPS. Nature 447 : 859–863. 17568747
41. Saville KJ, Belote JM (1993) Identification of an essential gene, l(3)73Ai, with a dominant temperature-sensitive lethal allele, encoding a Drosophila proteasome subunit. Proc Natl Acad Sci U S A 90 : 8842–8846. 8415617
42. Schweisguth F (1999) Dominant-negative mutation in the beta2 and beta6 proteasome subunit genes affect alternative cell fate decisions in the Drosophila sense organ lineage. Proc Natl Acad Sci U S A 96 : 11382–11386. 10500185
43. Saraswati S, Fox LE, Soll DR, Wu CF (2004) Tyramine and octopamine have opposite effects on the locomotion of Drosophila larvae. J Neurobiol 58 : 425–441. 14978721
44. Schnatwinkel C, Christoforidis S, Lindsay MR, Uttenweiler-Joseph S, Wilm M, et al. (2004) The Rab5 effector Rabankyrin-5 regulates and coordinates different endocytic mechanisms. PLoS Biol 2: E261. 15328530
45. Itoh T, Satoh M, Kanno E, Fukuda M (2006) Screening for target Rabs of TBC (Tre-2/Bub2/Cdc16) domain-containing proteins based on their Rab-binding activity. Genes Cells 11 : 1023–1037. 16923123
46. Sepp KJ, Hong P, Lizarraga SB, Liu JS, Mejia LA, et al. (2008) Identification of neural outgrowth genes using genome-wide RNAi. PLoS Genet 4: e1000111. doi: 10.1371/journal.pgen.1000111 18604272
47. DiMauro S, Spiegel R (2011) Progress and problems in muscle glycogenoses. Acta Myol 30 : 96–102. 22106711
48. Yang Z, Fujii H, Mohan SV, Goronzy JJ, Weyand CM (2013) Phosphofructokinase deficiency impairs ATP generation, autophagy, and redox balance in rheumatoid arthritis T cells. J Exp Med 210 : 2119–2134. doi: 10.1084/jem.20130252 24043759
49. MacIver NJ, Michalek RD, Rathmell JC (2013) Metabolic regulation of T lymphocytes. Annu Rev Immunol 31 : 259–283. doi: 10.1146/annurev-immunol-032712-095956 23298210
50. Reichelt ME, Mellor KM, Curl CL, Stapleton D, Delbridge LM (2013) Myocardial glycophagy—A specific glycogen handling response to metabolic stress is accentuated in the female heart. J Mol Cell Cardiol 65C: 67–75.
51. Haas KF, Woodruff E 3rd, Broadie K (2007) Proteasome function is required to maintain muscle cellular architecture. Biol Cell 99 : 615–626. 17523916
52. Grumati P, Bonaldo P (2012) Autophagy in skeletal muscle homeostasis and in muscular dystrophies. Cells 1 : 325–345. doi: 10.3390/cells1030325 24710479
53. Arndt V, Dick N, Tawo R, Dreiseidler M, Wenzel D, et al. (2010) Chaperone-assisted selective autophagy is essential for muscle maintenance. Curr Biol 20 : 143–148. doi: 10.1016/j.cub.2009.11.022 20060297
54. Barr F, Lambright DG (2010) Rab GEFs and GAPs. Curr Opin Cell Biol 22 : 461–470. doi: 10.1016/j.ceb.2010.04.007 20466531
55. Popovic D, Akutsu M, Novak I, Harper JW, Behrends C, et al. (2012) Rab GTPase-activating proteins in autophagy: regulation of endocytic and autophagy pathways by direct binding to human ATG8 modifiers. Mol Cell Biol 32 : 1733–1744. doi: 10.1128/MCB.06717-11 22354992
56. Frasa MA, Koessmeier KT, Ahmadian MR, Braga VM (2012) Illuminating the functional and structural repertoire of human TBC/RABGAPs. Nat Rev Mol Cell Biol 13 : 67–73. doi: 10.1038/nrm3267 22251903
57. Fukui K, Sasaki T, Imazumi K, Matsuura Y, Nakanishi H, et al. (1997) Isolation and characterization of a GTPase activating protein specific for the Rab3 subfamily of small G proteins. J Biol Chem 272 : 4655–4658. 9030515
58. Nagano F, Sasaki T, Fukui K, Asakura T, Imazumi K, et al. (1998) Molecular cloning and characterization of the noncatalytic subunit of the Rab3 subfamily-specific GTPase-activating protein. J Biol Chem 273 : 24781–24785. 9733780
59. Handley MT, Aligianis IA (2012) RAB3GAP1, RAB3GAP2 and RAB18: disease genes in Micro and Martsolf syndromes. Biochem Soc Trans 40 : 1394–1397. doi: 10.1042/BST20120169 23176487
60. Muller M, Pym EC, Tong A, Davis GW (2011) Rab3-GAP controls the progression of synaptic homeostasis at a late stage of vesicle release. Neuron 69 : 749–762. doi: 10.1016/j.neuron.2011.01.025 21338884
61. Seto S, Sugaya K, Tsujimura K, Nagata T, Horii T, et al. (2013) Rab39a interacts with phosphatidylinositol 3-kinase and negatively regulates autophagy induced by lipopolysaccharide stimulation in macrophages. PLoS One 8: e83324. doi: 10.1371/journal.pone.0083324 24349490
62. Ranganayakulu G, Schulz RA, Olson EN (1996) Wingless signaling induces nautilus expression in the ventral mesoderm of the Drosophila embryo. Dev Biol 176 : 143–148. 8654890
63. Juhasz G, Hill JH, Yan Y, Sass M, Baehrecke EH, et al. (2008) The class III PI(3)K Vps34 promotes autophagy and endocytosis but not TOR signaling in Drosophila. J Cell Biol 181 : 655–666. doi: 10.1083/jcb.200712051 18474623
64. Pulipparacharuvil S, Akbar MA, Ray S, Sevrioukov EA, Haberman AS, et al. (2005) Drosophila Vps16A is required for trafficking to lysosomes and biogenesis of pigment granules. J Cell Sci 118 : 3663–3673. 16046475
65. Graf ER, Daniels RW, Burgess RW, Schwarz TL, DiAntonio A (2009) Rab3 dynamically controls protein composition at active zones. Neuron 64 : 663–677. doi: 10.1016/j.neuron.2009.11.002 20005823
66. Zhang J, Schulze KL, Hiesinger PR, Suyama K, Wang S, et al. (2007) Thirty-one flavors of Drosophila rab proteins. Genetics 176 : 1307–1322. 17409086
67. Sinadinos C, Cowan CM, Wyttenbach A, Mudher A Increased throughput assays of locomotor dysfunction in Drosophila larvae. J Neurosci Methods 203 : 325–334. doi: 10.1016/j.jneumeth.2011.08.037 21925540
68. Budnik V, Gorczyca M, Prokop A (2006) Selected methods for the anatomical study of Drosophila embryonic and larval neuromuscular junctions. Int Rev Neurobiol 75 : 323–365. 17137935
69. Schneider CA, Rasband WS, Eliceiri KW (2012) NIH Image to ImageJ: 25 years of image analysis. Nat Methods 9 : 671–675. 22930834
70. Li L, Stoeckert CJ Jr., Roos DS (2003) OrthoMCL: identification of ortholog groups for eukaryotic genomes. Genome Res 13 : 2178–2189. 12952885
71. Vinayagam A, Zirin J, Roesel C, Hu Y, Yilmazel B, et al. (2014) Integrating protein-protein interaction networks with phenotypes reveals signs of interactions. Nat Methods 11 : 94–99. doi: 10.1038/nmeth.2733 24240319
72. Goktug AN, Ong SS, Chen T (2012) GUItars: a GUI tool for analysis of high-throughput RNA interference screening data. PLoS One 7: e49386. doi: 10.1371/journal.pone.0049386 23185323
73. Zhang XD (2011) Illustration of SSMD, z score, SSMD*, z* score, and t statistic for hit selection in RNAi high-throughput screens. J Biomol Screen 16 : 775–785. doi: 10.1177/1087057111405851 21515799
Štítky
Genetika Reprodukční medicínaČlánek vyšel v časopise
PLOS Genetics
2015 Číslo 2
Nejčtenější v tomto čísle
- Genomic Selection and Association Mapping in Rice (): Effect of Trait Genetic Architecture, Training Population Composition, Marker Number and Statistical Model on Accuracy of Rice Genomic Selection in Elite, Tropical Rice Breeding Lines
- Discovery of Transcription Factors and Regulatory Regions Driving Tumor Development by ATAC-seq and FAIRE-seq Open Chromatin Profiling
- Evolutionary Signatures amongst Disease Genes Permit Novel Methods for Gene Prioritization and Construction of Informative Gene-Based Networks
- Proteotoxic Stress Induces Phosphorylation of p62/SQSTM1 by ULK1 to Regulate Selective Autophagic Clearance of Protein Aggregates