
Estimating the Risk of Chronic Pain: Development and Validation of a Prognostic Model (PICKUP) for Patients with Acute Low Back Pain
Adrian Traeger and colleagues report the development and validation of a prognostiv model (PICKUP) for estimating risk of developing chronic low back pain.
Published in the journal:
. PLoS Med 13(5): e32767. doi:10.1371/journal.pmed.1002019
Category:
Research Article
doi:
https://doi.org/10.1371/journal.pmed.1002019
Summary
Adrian Traeger and colleagues report the development and validation of a prognostiv model (PICKUP) for estimating risk of developing chronic low back pain.
Introduction
Low back pain (LBP) is a major global health problem that, compared to all other diseases and health conditions, is responsible for the most years lived with disability, an estimated 80 million years lived with disability in 2010 [1]. The costs of care, investigations, and lost productivity associated with LBP are a significant economic burden for industrialized nations [2]. For example, estimates for treatments alone are US$50 billion per annum in the United States [3] and US$4 billion in the United Kingdom [4]. The impact of LBP can be profound; in Australia, LBP is the leading cause of early retirement [5] and of income poverty in older adults [6].
Although most people with a new episode, or acute, LBP recover in a few weeks or months, around one-quarter of patients who present to primary care develop chronic LBP (pain lasting for longer than 3 mo) [7]. Chronic LBP is the most problematic type of LBP; its prognosis is poor [8], and it accounts for the majority of costs [4,9]. Between 1992 and 2006, the prevalence of chronic LBP in the United States more than doubled [10]. Managing patients with chronic LBP is difficult, and the effects of contemporary interventions are modest at best [11]. An alternative to costly and ineffective management of these patients is secondary prevention, where the goal is to prevent the onset of chronic LBP [12].
An important first step in secondary prevention is to estimate an individual patient’s risk of developing chronic LBP. The Prognosis Research Strategy (PROGRESS) group recently provided a framework for this step, which involves developing and validating prognostic models to determine risk profiles. For these models to be considered clinically useful, they must be easy to use, be able predict outcome with acceptable accuracy, and be validated in external samples. Risk estimates should be well matched to actual outcomes (calibration), higher for individuals who have a poor outcome than for those who do not (discrimination), and informative enough to justify screening compared to “treat all” or “treat none” approaches (net benefit). Estimates from validated models can add valuable information to the clinical decision-making process [13].
Early, accurate prognostic information also provides the opportunity for practitioners to counsel their patients on the necessity of further treatment [14]. Offering tests and treatments to all patients with acute LBP (“treat all” approach) is expensive and risks exposing high numbers of low-risk patients to unnecessary intervention [15]. Overtreatment of conditions such as LBP overburdens healthcare systems and diverts scarce resources away from where they are most needed [16]. Undertreatment of high-risk patients with acute LBP may also be harmful. A “treat none” approach to acute LBP guarantees that a significant proportion will develop chronic LBP and its long-term consequences [7], and wastes an opportunity to intervene early in primary care.
Targeting early intervention according to risk profile has been shown to be effective in breast cancer [17] and cardiovascular disease [18] and has been identified as a research priority for managing LBP [19]. There is preliminary evidence that a stratified approach improves disability in samples with predominantly chronic LBP [20], but it remains unknown whether such a prognostic approach can prevent the onset of chronic LBP. The absence of a valid prognostic model to inform risk-stratified management of acute LBP is therefore an important area of uncertainty [21]. Not having a validated prognostic model for acute LBP is also problematic for secondary prevention trials that are designed to target pain [22,23]; treat all approaches are unlikely to be efficient if the majority of included participants are at low risk of chronic LBP [24,25].
None of the commonly used screening tools in LBP are suited to this purpose. Tools such as the Start Back Tool (SBT) and the Orebro Musculoskeletal Pain Questionnaire (OMPQ) were either developed in samples that included patients with chronic LBP [26] or used to predict disability [26,27] or return to work [28] outcomes. When these tools were subsequently tested in acute LBP samples, they predicted chronic LBP with modest accuracy at best [27,29–31].
The primary aim of this study was to develop and validate a prognostic model to identify risk of chronic LBP in patients with acute LBP. Specifically, we aimed to develop a model that can provide an estimate for an individual patient’s risk of chronic LBP with acceptable levels of accuracy (calibration, discrimination, and net benefit). A secondary aim was to determine whether prognostic models varied by how chronic LBP was defined. Specifically, we aimed to develop two additional prognostic models using outcomes of high pain and chronic disability.
Methods
The protocol for this study has been published [32].
Patients
We used patient data from a prospective cohort study to develop the model (development sample) and patient data from a randomized trial to externally validate the model (external validation sample). Full details of these two studies have been published [23,33], and their key differences are summarized in Table 1. Both studies were conducted in Sydney, Australia. In short, the cohort study recruited consecutive patients with acute LBP presenting to their primary care provider (general practitioner, physiotherapist, chiropractor) between 5 November 2003 and 15 July 2005. The randomized trial recruited consecutive patients with acute LBP presenting to their primary care practitioner between 10 November 2009 and 5 February 2013 to test the effect of paracetamol on recovery. There was no difference in treatment effects between groups. Both studies followed a published protocol [34,35], and the trial was prospectively registered.

Predictors and Model Outcomes
Baseline data were available on 20 predictors in six broad groups of putative prognostic factors that have been identified in previous studies [36–38]: sociodemographic factors, general health, work factors, current LBP characteristics, past LBP history, and psychological factors. Primary care clinicians collected these data at the first consultation. A full list of individual candidate predictors is provided in Table 2.

To develop the primary model, PICKUP (Predicting the Inception of Chronic Pain), we defined the main outcome as whether or not patients had chronic LBP, that is, ongoing LBP 3 mo after the initial consultation. In the development study, pain intensity was measured with a six-point Likert scale [39]. We classified patients as having “chronic LBP” if they reported greater than “mild” (2 on the Likert scale) pain intensity at 3-mo follow-up and had no periods of recovery [40].
To develop two secondary prognostic models (Models 2a and 2b), we used additional criteria to define chronic LBP. These secondary models allowed comparison of model performance to published models and to our primary prognostic model. Patients were classified as having “chronic LBP high pain” if they reported greater than “moderate” (3 on the Likert scale) pain intensity [39] at 3-mo follow-up (Model 2a). Patients were classified as having “chronic LBP disability” if they reported a score of 2 or more on a five-point Likert scale for disability [39] at 3-mo follow-up (Model 2b). Thresholds to define outcomes for all three models were determined a priori [32].
In the external validation sample, pain and disability scores were converted from an 11-point scale used to measure pain intensity and a 24-item scale used to measure disability to the six-point and five-point scales, respectively, used in the development sample. Both of the original studies assessed 3-mo outcomes over the phone, an approach that yields comparable results to in person assessment on pain-related outcomes [41].
Statistical Analysis
The statistical analysis plan for this study was informed by recommendations from the PROGRESS group [13]. All preplanned analyses are outlined in our protocol published a priori [32].
Missing data
We planned a complete case analysis if less than 5% of predictor values were missing. If more than 5% of predictor values were missing, we planned to impute the missing values. Because PROGRESS does not recommend a complete case analysis, we performed a post hoc sensitivity analysis using the Expectation Maximization algorithm in SPSS to impute missing values and to test the robustness of our approach. We did not impute missing outcome values [42].
Model specification
To identify predictors in the development sample, we performed a forward stepwise logistic regression analysis. We set the significance level for variable selection at p < 0.10. To specify the model, age, sex, and duration of the pain episode were forced into the first block, and the remaining candidate predictors (Table 2) were selected using an automated stepwise procedure in the second block. Only those predictors identified in the second block using the stepwise procedure were included in the final models for external validation. We examined the linearity of continuous predictor variables using scatter plots and Box–Tidwell transformations [43].
Performance measures
We assessed the predictive performance of the regression model by examining measures of discrimination, calibration, and overall performance. Discrimination refers to how likely the model is to allocate higher predicted risks to patients who develop chronic LBP during the study period and lower predicted risks to those who do not. We assessed discrimination by calculating the area under the receiver operating characteristic curve (AUC) [44]. With this statistic, a value of 0.5 indicates that the model discriminates no better than chance and a value of 1 indicates that the model discriminates perfectly [45]. We further assessed discrimination by calculating the discrimination slope (the absolute difference in mean predicted risk in those who developed chronic LBP and those who did not) [46] and risk-stratified likelihood ratios.
Calibration refers to the agreement of predicted risks and actual outcomes. In both samples, we constructed calibration graphs that plotted predicted risks produced from the prognostic model versus observed proportions of chronic LBP in ten groups separated by decile of risk. We fitted a smoothed line to the calibration graph to calculate the calibration slope and intercept; values around 1 for the slope and 0 for the intercept represent correct calibration [46].
Overall performance and model fit indices combine aspects of discrimination and calibration. We tested overall performance using the Nagelkerke R2 statistic and the Brier score. Nagelkerke R2 measures the additional variation in chronic LBP that is explained by the model compared to an intercept-only logistic model. A large difference in Nagelkerke R2 between the development and external validation samples indicates overfitting and poor generalizability [46]. The Brier score quantifies the average prediction error and ranges from 0 to 0.25; values close to 0 represent informative models, while values close to 0.25 represent non-informative models [47].
Internal validation (development sample)
Prediction models tend to perform optimistically (i.e., overestimate performance) in the sample in which they are developed. To provide a robust estimate of model performance in the development sample, we bootstrapped all of the performance estimates according to Harrell et al. [48]. Bootstrapping is the most efficient method of internally validating performance estimates in a development sample [49]. In brief, this procedure creates bootstrap samples by drawing random samples with replacement from the development sample (200 replications) and then tests model performance in the newly created sample. This allows performance estimates in the development sample to be adjusted for optimism. Although we planned to use SPSS to perform the bootstrap procedure [32], we found it to be easier to perform using R software with the syntax provided by Steyerberg [42].
External validation (external validation sample)
To externally validate the model, we tested model predictions in the external validation sample and calculated the performance statistics described above. To update the model, we examined whether including a recently identified prognostic factor—sleep quality [50,51]—added significantly (p < 0.10) to the model. All models were recalibrated according to the method of Steyerberg [42], which involved updating the logistic equation using the calibration slope and intercept obtained in the external validation procedure.
Clinical usefulness
We assessed the potential clinical utility of the model by selecting cutoffs based on quartiles of predicted risk in the development sample. Predicted risk, or predicted probability, is calculated using the regression equation and produces a number between 0 and 1. For example, a predicted probability of 0.2 signifies a 20% (absolute) predicted risk of developing chronic LBP. Those in the highest quartile of predicted risk were classified as high risk, those in the middle two quartiles as medium risk, and those in the lowest quartile as low risk. Using these cutoffs, we calculated posterior probabilities and likelihood ratios with 95% confidence intervals.
To further explore clinical utility, we performed a decision curve analysis. This analysis allowed us to assess whether using a prognostic model to screen patients could be a superior decision-making approach to simply intervening with all patients (treat all approach) or intervening with none (treat none approach). The decision curve analysis calculates the net benefit of a particular decision-making approach across a range of risk thresholds where patients and their physicians might opt for further intervention. For example, a physician may decide to recommend further intervention (e.g., a course of physiotherapy) for cases with a greater than 30% risk of chronic LBP. A decision curve analysis estimates whether this approach would provide a net increase in the proportion of patients treated appropriately (i.e., patients with a poor prognosis are recommended further intervention, those with a good prognosis are not). Specifically, the net benefit is the difference in proportions of true positives and false positives when false positives are weighted by the odds of the selected cutoff (net benefit = TP–wFP/N, where TP is the number of true positive decisions, wFP is the number of false positive decisions × the odds of a given cutoff, and N is the total number of patients).
We also calculated the net number of unnecessary interventions avoided using the equation suggested by Vickers and Elkin [52]:

This equation estimates the net number of unnecessary interventions that would be avoided if clinicians were to base their decision to recommend further intervention on predicted risks. For example, compared to treat all, what is the net number of unnecessary interventions that would be avoided if only those with 30% or higher risk of chronic LBP were recommended further intervention? We calculated, across a range of potential cutoff scores, the net reduction in the number of patients with good outcomes who would receive unnecessary interventions using a treat all strategy.
Statistical analyses were carried out in SPSS Statistics for Windows version 22.0 (IBM Corp) and R version 3.1.2 [53].
Both of the original studies were approved by the Human Research Ethics Committee of the University of Sydney (ref 11-2002/3/3144 and ref 11638). All participants provided written informed consent. Because we analyzed an existing non-identifiable dataset, the Human Research Ethics Committee did not require a separate ethics application for the current study. A non-identifiable dataset is provided in S1 and S2 Data.
Results
Flow of patients in the development and external validation samples is shown in Fig 1. Eighteen patients (1.4%) in the cohort study (development sample) and 46 patients (2.7%) in the randomized trial (external validation sample) were un-contactable at 3-mo follow-up. Some patients were excluded from the external validation sample because they were not assessed for pain intensity (65 patients; 3.9%) or disability (87 patients; 5.2%) at 3-mo follow-up.

There were five missing predictor values in the development sample and 44 missing predictor values in the external validation sample. We found evidence against the hypothesis that predictor values were not missing completely at random (Little’s test, p > 0.05), and, because the number of missing values was small (<1%), we removed these cases from the primary analysis as per our protocol [32]. Imputing missing predictor values in the sensitivity analysis did not affect the results (S1 and S2 Tables).
Data were therefore available from 1,230 cases to develop the prognostic models. To externally validate the models, data were available from 1,528 complete cases to test PICKUP, 1,525 complete cases to test Model 2a, and 1,504 complete cases to test Model 2b.
Table 3 shows the characteristics of patients in the development and external validation samples. Patients were similar at baseline except for the proportion receiving disability compensation, which was higher in the development sample (18%) than in the external validation sample (7%).

Model Development and Internal Validation
At 3 mo, 30% of the patients in the development sample were classified as having chronic LBP. Table 4 shows predictors and regression coefficients for the primary model (PICKUP) and the two secondary models that were fitted in this sample. PICKUP contained five predictors. We did not detect significant non-linearity in any continuous predictor variables. Estimates for the predictive performance of each prognostic model in the development sample can be found in S2 Table. Recruitment setting (general practice, physiotherapy, chiropractic) did not affect performance estimates (S3 Table).

External Validation
Table 5 summarizes the predictive performance of the prognostic models in the external sample. At 3 mo, 19% of the patients in the external validation sample were classified as having chronic LBP. The Nagelkerke R2 value was 7.7%, compared to 10.9% in the development sample, and the Brier score was 0.15, indicating a similar overall model fit. S2 Table shows the full results of performance testing for each prognostic model in the development and external validation samples. Discrimination performance for PICKUP fell within our prespecified acceptable range: the AUC was 0.66 (95% CI 0.63 to 0.69), the likelihood ratio in the high-risk group was 2.99 (95% CI 2.81 to 3.18), and the 95% confidence intervals did not overlap with between risk groups (S4 Table).

All models showed some miscalibration in the external validation sample (Fig 2). PICKUP demonstrated the best calibration and fell within our prespecified acceptable range in the lower seven of the ten risk groups, that is, predictions were within 5% of actual proportions of chronic LBP. In all three models, calibration was better for the low-risk patients than it was for the high-risk patients. After recalibration, slope and intercept estimates for each model were close to 1 and 0, respectively, which indicates near perfect calibration (S1–S3 Figs). Updating PICKUP with an additional prognostic factor (sleep quality) did not add significantly to the model (p > 0.10).

Clinical Usefulness
Fig 3 shows the results of the decision curve analysis. Treat all strategies assume that if all patients are treated, none will develop an unfavorable outcome. This may or may not be a reasonable assumption in LBP. Although there are effective treatments for acute LBP [54], evidence-based interventions to prevent the onset of chronic LBP are not yet available. The assumed outcome from treating all patients with acute LBP is that all high-risk patients are offered further intervention that could reduce their risk of chronic LBP. The assumed outcome from treating no patients with acute LBP is that all high-risk patients will develop an unfavorable outcome. In our external validation cohort, for example, if no high-risk patients were offered further intervention, one in five would develop chronic LBP.
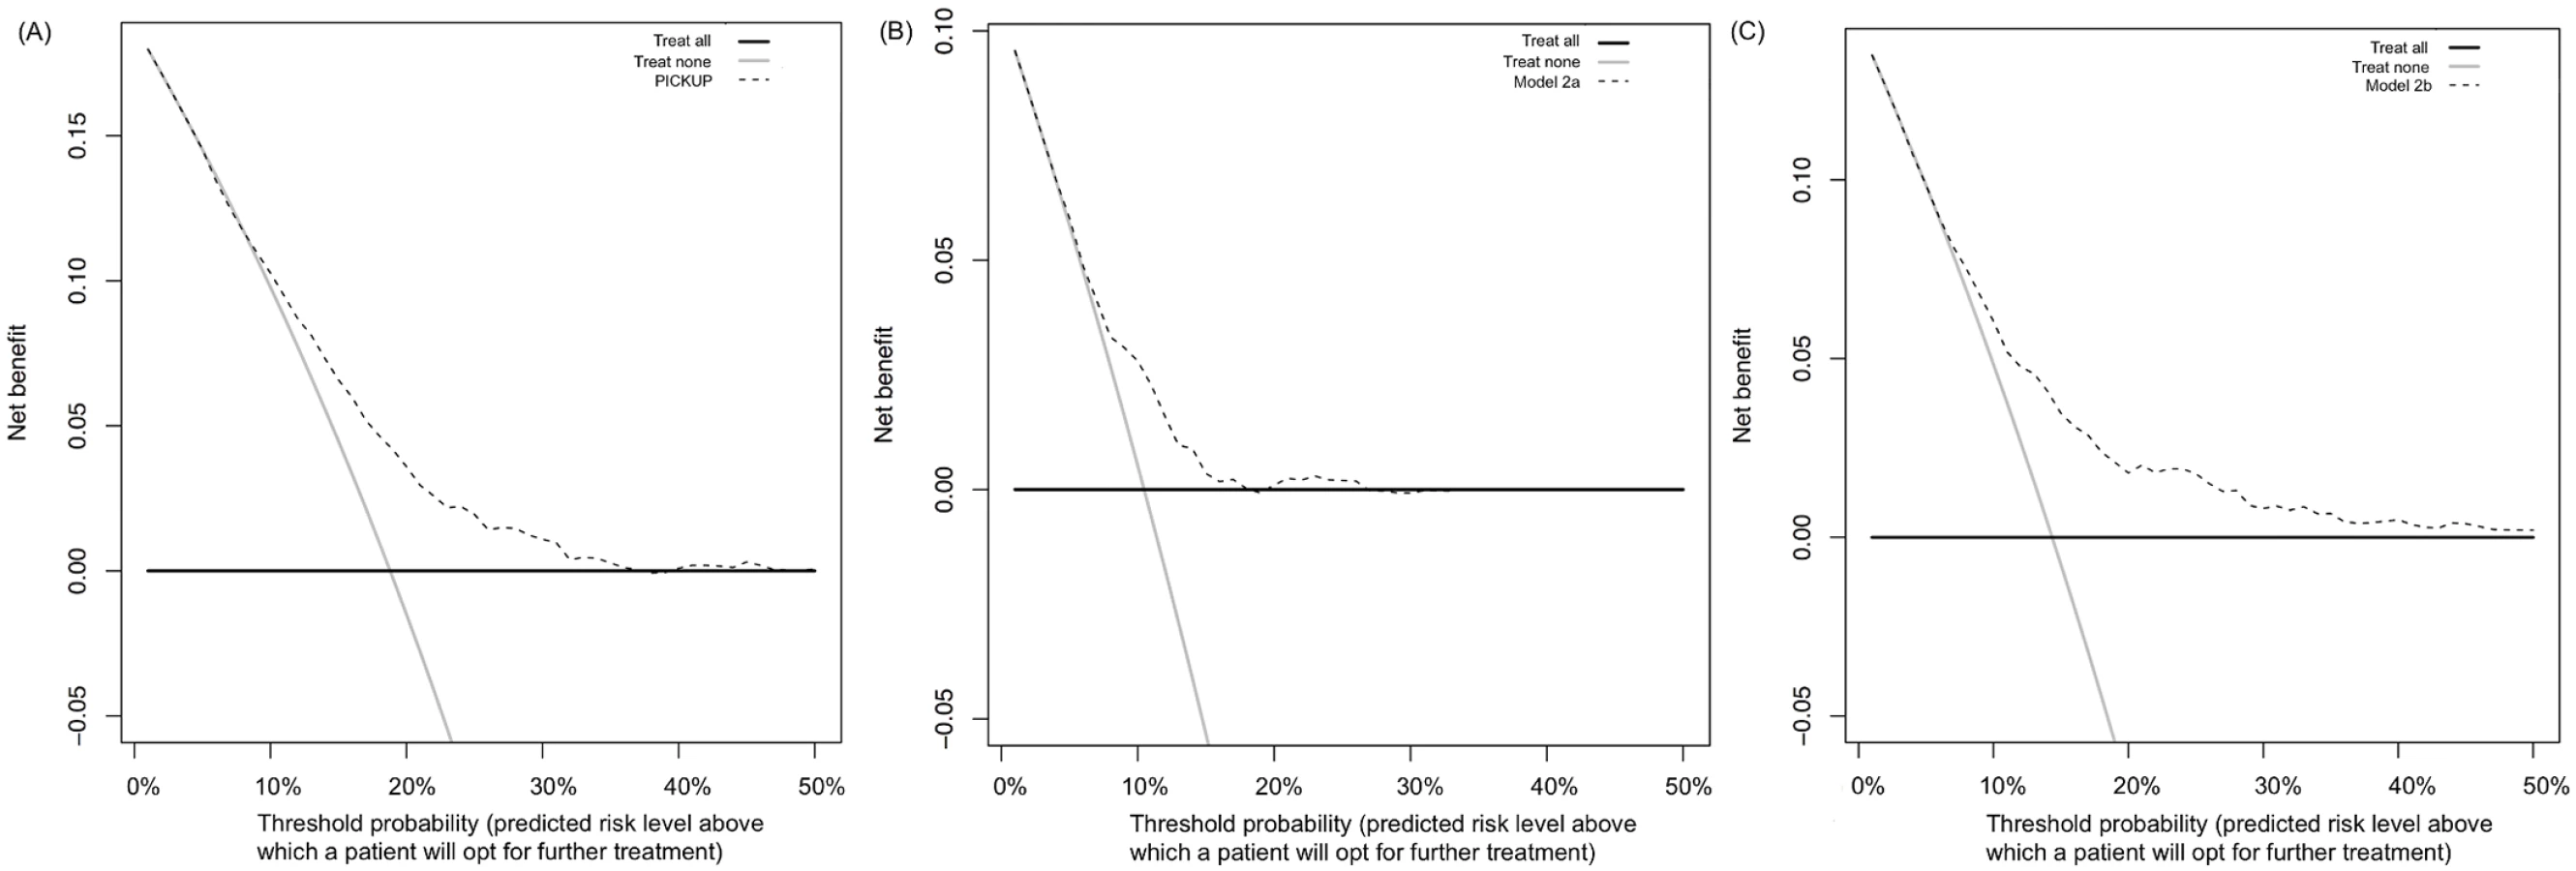
Treat all strategies demonstrated the highest net benefit at threshold probabilities between 0% and 10%. At thresholds above the population risk (incidence rates were 19% for chronic LBP, 10% for chronic LBP with high pain, and 14% for chronic LBP with disability), the net benefit of treating all became negative (Fig 3). The net benefit of treating none was always assumed to be zero.
All prognostic models showed equal or higher net benefit than the treat all and treat none strategies. Using PICKUP and a cutoff set at 19% (i.e., only patients with a predicted risk higher than the population risk of 19% are recommended further intervention), the net number of cases of chronic LBP that would be detected through screening, without any increase in the number of patients unnecessarily recommended further intervention, would be four in every 100 patients.
Fig 4 shows the estimated net number of unnecessary interventions avoided through screening. Using PICKUP and a cutoff set at 30% (i.e., only patients with a predicted risk of 30% or higher are recommended further intervention) would lead to a net reduction of around 40 unnecessary interventions per 100 patients.

Calculation of an Individual Predicted Risk
An individual score (ScoreCLBP) can be derived using the recalibrated logistic regression equation from PICKUP:

The predicted risk of developing chronic LBP (ProbCLBP) can then be calculated using the score and the following equation:

Discussion
We have developed and tested the external validity of a prognostic model to identify the risk of chronic LBP in individuals with acute LBP. Values for discrimination and calibration fell within a prespecified [32] range of what we subjectively determined to be informative. Although the AUC values are modest (between 0.66 and 0.69), they suggest better predictive accuracy for pain outcomes than recently published values based on either clinician judgment alone (between 0.50 and 0.60) [29] or popular tools such as the SBT and OMPQ [29–31]. The results of our decision curve analysis indicate that, compared to treat all and treat none strategies, our model has the potential to substantially reduce harms associated with undertreating high-risk patients and overtreating low-risk patients with acute LBP.
The major strengths of this study are its preplanned methods, the use of large, high-quality datasets, and transparent reporting. To our knowledge, this is the largest “Type 3” study in LBP to have—in line with the PROGRESS initiative [13]—published a statistical analysis plan and reported results using the TRIPOD statement (see S1 TRIPOD Checklist). Type 3 studies build on foundational prognostic factor research (Type 1 and 2 studies) [55] by constructing prognostic models. Constructing accurate prognostic models is an essential step towards improving patient outcomes through stratified care (Type 4 studies) [56]. We used large samples of patients with acute LBP to develop and externally validate the models. The samples had a number of differences (Table 1), not least of which was the overall risk of developing chronic LBP (30% in the development sample versus 19% in the external validation sample). Despite these differences, the models made informative predictions in the external sample, which indicates favorable generalizability and suggests that further testing in additional samples is warranted. We have reported different aspects of model performance that can be interpreted for clinical and research applications.
This study has some limitations. First, we were restricted to the use of predictor variables measured in the original studies. We were therefore not able to directly compare our model or update existing models in this study, as is recommended by the PROGRESS framework (Recommendation 21) [13]. Moreover, we may not have included important prognostic variables in our models because they were not measured in the original studies. We attempted to overcome this limitation by updating the model at the external validation stage. Interestingly, when we updated the model with a recently identified prognostic factor, sleep quality [50,51], there was no improvement in any of our indices of predictive performance. Second, we used an automated stepwise approach to specify the models, principally because it is objective and generally results in smaller, clinically applicable models [57], but stepwise methods have well-known limitations such as unstable variable selection [58] and biased coefficient estimation [57]. It is therefore conceivable that our choice to use stepwise selection may have reduced the predictive performance of the models. Third, the overall model fit statistics indicate that the variance explained by our prediction models is modest. Perhaps some factors that are yet to be tested thoroughly in LBP, for example, structural pathology shown on imaging [59], explain additional variance in chronic LBP. However, tests involving imaging are onerous, costly, and potentially harmful for patients with acute nonspecific LBP [60]. Fourth, by prespecifying in our protocol that we would impute missing predictor values only if they were missing in more than 5% of the sample, we did not strictly adhere to the PROGRESS recommendation to impute values where reasonable (Recommendation 20). The complete case approach that we used in our primary analysis can be inefficient and is known to produce bias in prediction research [61]. However, the number of missing predictor values was small (<2%), and our post hoc sensitivity analysis showed no major differences in results when a post hoc imputation procedure was performed (S1 and S2 Tables). This suggests that our a priori decision to remove cases with missing predictor values did not bias the results. Finally, because our prognostic model is in the form of a logistic regression equation, this limits its ease of use. To address this limitation, we developed a calculator (based on the recalibrated PICKUP) that is freely available online at http://pickuptool.neura.edu.au/.
Deciding whether a model is useful or not depends both on its performance and its purpose. In the research setting, discrimination is an important consideration. When such a large number of patients recover with minimal or no intervention, treat all approaches to preventing chronic LBP are inevitably going to be inefficient. Some treatments for LBP, if applied to low-risk patients, may even be harmful. Our models can help discriminate between patients who experience poor outcomes and patients who experience good outcomes, with acceptable performance (AUC > 0.6, likelihood ratios not overlapping). In the external validation sample, patients allocated to the high-risk group (i.e., in the highest quartile of predicted risk) were three times more likely to develop chronic LBP than their medium - or low-risk counterparts (in the middle two and lowest quartiles of predicted risk, respectively). Including only patients with a predicted risk above a 30% in a secondary prevention trial would lead to a net reduction of 40 unnecessary episodes of care (for patients with good outcomes) per 100 patients (Fig 4).
In the clinical setting, calibration is important for providing accurate risk estimates to patients. Our primary prognostic model (PICKUP) demonstrated acceptable calibration (<5% difference between predicted risks and observed proportions of chronic LBP) in seven out of ten risk strata. However, we did observe some miscalibration in the higher risk strata—as predicted risk increased, accuracy decreased and the model overestimated risk (Fig 2). This, along with our negative predictive values above 90% (S4 Table), means that people with lower risk estimates are very unlikely to develop chronic pain, but those with higher risk estimates may still recover quickly. That is, the models are better at ruling out future chronic LBP than ruling it in. However, after recalibration the estimates were almost perfectly calibrated (S1–S3 Figs). With further testing and recalibration, these models have potential to be useful in other clinical settings.
Our decision curve analysis suggested that the primary model is likely to be useful for patients whose decision to pursue further intervention is based on a predicted risk between 12% and 35%. The question that remains is whether these thresholds are clinically relevant. For a range of thresholds under 50% to be considered clinically relevant, the assumption is that patients place more value on detecting an imminent problem (true positive rate) than undergoing unnecessary treatment (false positive rate) [62]. We would suggest that most patients with acute LBP would fall into this category: the consequences of undergoing, for example, an unnecessary course of physiotherapy, are outweighed by the prospect of missing a chance at preventing a long-term problem. However, this assumption rests on the nature of the treatment proposed. If the patient and their physician are considering invasive treatments such as spinal surgery, the patient might weigh the false positive rate more heavily, due to the higher risk of adverse events. In this case, a screening tool would need to yield a net benefit across a range of predicted risk cutoffs higher than 50%, and our model would not be considered useful [62]. We therefore speculate that our models are likely to be useful only for informing the choice between a wait-and-see approach and a course of conservative intervention.
Although several models have been developed in LBP, few have been externally validated [21], and none have been designed to predict the onset of chronic LBP. Pain is arguably the most important outcome to predict in LBP; it is clearly the most important issue for patients [63], and it is the slowest to recover [33]. The three available tools that have been tested in external samples of patients with acute LBP appear to predict pain outcomes at 3 and 6 mo with modest accuracy at best. Grotle et al. [31] tested the OMPQ in an acute LBP sample and reported an AUC for predicting pain at 6 mo of 0.62 (95% CI 0.51 to 0.73). Recent evaluations of SBT score in predicting ongoing pain at 6 mo in acute LBP samples reported AUC values of 0.50 [29] and 0.54 [30]. Williams et al. [64] reported an AUC of 0.60 (95% CI 0.56 to 0.64) for predicting recovery from pain (0 or 1/10 pain sustained for 7 d) at 3 mo. PICKUP appears to discriminate medium-term pain outcomes in patients with acute LBP more accurately than other validated models, and may be particularly useful for secondary prevention trials that target pain reduction. Because calibration performance has not been widely reported, we were unable to compare our model to others in these terms. Williams et al. [64] reported acceptable calibration for their model predicting outcomes in the first 2 wk but relatively poor calibration (more than 10% difference between predicted risks and observed proportions) for predicting pain outcomes at 3 mo. As suggested by PROGRESS, a formal comparison of our tool with other validated tools, for example, using a decision curve analysis, is a logical next step.
Conclusions
Based on its performance in these cohorts, this five-item prognostic model for patients with acute LBP may be a useful tool for estimating risk of chronic LBP. Further validation is required to determine whether screening with this model leads to a net reduction in unnecessary interventions provided to low-risk patients.
Supporting Information
Zdroje
1. Global Burden of Disease Study 2013 Collaborators. Global, regional, and national incidence, prevalence, and years lived with disability for 301 acute and chronic diseases and injuries in 188 countries, 1990–2013: a systematic analysis for the Global Burden of Disease Study 2013. Lancet. 2015;386 : 743–800. doi: 10.1016/s0140-6736(15)60692-4 26063472
2. Martin BI, Turner JA, Mirza SK, Lee MJ, Comstock BA, Deyo RA. Trends in health care expenditures, utilization, and health status among US adults with spine problems, 1997–2006. Spine (Phila Pa 1976). 2009;34 : 2077–2084. doi: 10.1097/BRS.0b013e3181b1fad1
3. Deyo RA, Weinstein JN. Low back pain. N Engl J Med. 2001;344 : 363–370. doi: 10.1056/NEJM200102013440508 11172169
4. Hong J, Reed C, Novick D, Happich M. Costs associated with treatment of chronic low back pain: an analysis of the UK General Practice Research Database. Spine (Phila Pa 1976). 2013;38 : 75–82. doi: 10.1097/BRS.0b013e318276450f
5. Schofield DJ, Shrestha RN, Passey ME, Earnest A, Fletcher SL. Chronic disease and labour force participation among older Australians. Med J Aust. 2008;189 : 447. 18928439
6. Schofield DJ, Callander EJ, Shrestha RN, Percival R, Kelly SJ, Passey ME. Labor force participation and the influence of having back problems on income poverty in Australia. Spine (Phila Pa 1976). 2012;37 : 1156–1163. doi: 10.1097/BRS.0b013e31824481ee
7. Chou R, Shekelle P. Will this patient develop persistent disabling low back pain? JAMA. 2010;303 : 1295–1302. doi: 10.1001/jama.2010.344 20371789
8. Menezes Costa LC, Maher CG, Hancock MJ, McAuley JH, Herbert RD, Costa LO. The prognosis of acute and persistent low-back pain: a meta-analysis. CMAJ. 2012;184:E613–E624. doi: 10.1503/cmaj.111271 22586331
9. Gore M, Sadosky A, Stacey BR, Tai KS, Leslie D. The burden of chronic low back pain: clinical comorbidities, treatment patterns, and health care costs in usual care settings. Spine (Phila Pa 1976). 2012;37:E668–E677. doi: 10.1097/BRS.0b013e318241e5de
10. Freburger JK, Holmes GM, Agans RP, Jackman AM, Darter JD, Wallace AS, et al. The rising prevalence of chronic low back pain. Arch Intern Med. 2009;169 : 251–258. doi: 10.1001/archinternmed.2008.543 19204216
11. Kamper SJ, Apeldoorn A, Chiarotto A, Smeets R, Ostelo R, Guzman J, et al. Multidisciplinary biopsychosocial rehabilitation for chronic low back pain: Cochrane systematic review and meta-analysis. BMJ. 2015;350:h444. doi: 10.1136/bmj.h444 25694111
12. Linton SJ. Early identification and intervention in the prevention of musculoskeletal pain. Am J Ind Med. 2002;41 : 433–442. 12071495
13. Steyerberg EW, Moons KGM, van der Windt DA, Hayden JA, Perel P, Schroter S, et al. Prognosis Research Strategy (PROGRESS) 3: prognostic model research. PLoS Med. 2013;10:e1001381. doi: 10.1371/journal.pmed.1001381 23393430
14. McCaffery KJ, Jansen J, Scherer LD, Thornton H, Hersch J, Carter SM, et al. Walking the tightrope: communicating overdiagnosis in modern healthcare. BMJ. 2016;352:i348. doi: 10.1136/bmj.i348 26850726
15. Glasziou P, Moynihan R, Richards T, Godlee F. Too much medicine; too little care. BMJ. 2013;347:f4247. doi: 10.1136/bmj.f4247 23820022
16. Berwick DM, Hackbarth AD. Eliminating waste in US health care. JAMA. 2012;307 : 1513–1516. doi: 10.1001/jama.2012.362 22419800
17. Hudis CA. Trastuzumab—mechanism of action and use in clinical practice. N Engl J Med. 2007;357 : 39–51. doi: 10.1056/NEJMra043186 17611206
18. Hingorani AD, Hemingway H. How should we balance individual and population benefits of statins for preventing cardiovascular disease? BMJ. 2011;342:c6244. doi: 10.1136/bmj.c6244
19. Koes BW, van Tulder MW, Thomas S. Diagnosis and treatment of low back pain. BMJ. 2006;332 : 1430–1434. doi: 10.1136/bmj.332.7555.1430 16777886
20. Hill JC, Whitehurst DG, Lewis M, Bryan S, Dunn KM, Foster NE, et al. Comparison of stratified primary care management for low back pain with current best practice (STarT Back): a randomised controlled trial. Lancet. 2011;378 : 1560–1571. doi: 10.1016/s0140-6736(11)60937-9 21963002
21. Haskins R, Osmotherly PG, Rivett DA. Validation and impact analysis of prognostic clinical prediction rules for low back pain is needed: a systematic review. J Clin Epidemiol. 2015;68 : 821–832. doi: 10.1016/j.jclinepi.2015.02.003 25804336
22. Traeger AC, Moseley GL, Hubscher M, Lee H, Skinner IW, Nicholas MK, et al. Pain education to prevent chronic low back pain: a study protocol for a randomised controlled trial. BMJ Open. 2014;4:e005505. doi: 10.1136/bmjopen-2014-005505 24889854
23. Williams CM, Maher CG, Latimer J, McLachlan AJ, Hancock MJ, Day RO, et al. Efficacy of paracetamol for acute low-back pain: a double-blind, randomised controlled trial. Lancet. 2014;384 : 1586–1596. doi: 10.1016/s0140-6736(14)60805-9 25064594
24. Vickers AJ, Kramer BS, Baker SG. Selecting patients for randomized trials: a systematic approach based on risk group. Trials. 2006;7 : 30. doi: 10.1186/1745-6215-7-30 17022818
25. Trusheim MR, Berndt ER, Douglas FL. Stratified medicine: strategic and economic implications of combining drugs and clinical biomarkers. Nat Rev Drug Discov. 2007;6 : 287–293. doi: 10.1038/nrd2251 17380152
26. Hill JC, Dunn KM, Lewis M, Mullis R, Main CJ, Foster NE, et al. A primary care back pain screening tool: identifying patient subgroups for initial treatment. Arthritis Rheum. 2008;59 : 632–641. doi: 10.1002/art.23563 18438893
27. Beneciuk JM, Bishop MD, Fritz JM, Robinson ME, Asal NR, Nisenzon AN, et al. The STarT back screening tool and individual psychological measures: evaluation of prognostic capabilities for low back pain clinical outcomes in outpatient physical therapy settings. Phys Ther. 2013;93 : 321–333. doi: 10.2522/ptj.20120207 23125279
28. Hockings RL, McAuley JH, Maher CG. A systematic review of the predictive ability of the Orebro Musculoskeletal Pain Questionnaire. Spine (Phila Pa 1976). 2008;33:E494–E500. doi: 10.1097/BRS.0b013e31817ba3bb
29. Kongsted A, Andersen CH, Hansen MM, Hestbaek L. Prediction of outcome in patients with low back pain—a prospective cohort study comparing clinicians’ predictions with those of the Start Back Tool. Man Ther. 2016;21 : 120–127. doi: 10.1016/j.math.2015.06.008 26144686
30. Mehling WE, Avins AL, Acree MC, Carey TS, Hecht FM. Can a back pain screening tool help classify patients with acute pain into risk levels for chronic pain? Eur J Pain. 2015;19 : 439–446. doi: 10.1002/ejp.615 25381748
31. Grotle M, Vollestad NK, Brox JI. Screening for yellow flags in first-time acute low back pain: reliability and validity of a Norwegian version of the Acute Low Back Pain Screening Questionnaire. Clin J Pain. 2006;22 : 458–467. doi: 10.1097/01.ajp.0000208243.33498.cb 16772801
32. Traeger A, Henschke N, Hubscher M, Williams CM, Kamper SJ, Maher CG, et al. Development and validation of a screening tool to predict the risk of chronic low back pain in patients presenting with acute low back pain: a study protocol. BMJ open. 2015;5:e007916. doi: 10.1136/bmjopen-2015-007916 26179647
33. Henschke N, Maher CG, Refshauge KM, Herbert RD, Cumming RG, Bleasel J, et al. Prognosis in patients with recent onset low back pain in Australian primary care: inception cohort study. BMJ. 2008;337:a171. doi: 10.1136/bmj.a171 18614473
34. Williams CM, Maher CG, Latimer J, McLachlan AJ, Hancock MJ, Day RO, et al. PACE—the first placebo controlled trial of paracetamol for acute low back pain: statistical analysis plan. Trials. 2013;14 : 248. doi: 10.1186/1745-6215-14-248 23937999
35. Henschke N, Maher CG, Refshauge KM, Herbert RD, Cumming RG, Bleasel J, et al. Prognosis of acute low back pain: design of a prospective inception cohort study. BMC Musculoskelet Disord. 2006;7 : 54. 16790069
36. Steenstra I, Verbeek J, Heymans M, Bongers P. Prognostic factors for duration of sick leave in patients sick listed with acute low back pain: a systematic review of the literature. Occup Environ Med. 2005;62 : 851–860. 16299094
37. Bekkering GE, Hendriks HJ, van Tulder MW, Knol DL, Simmonds MJ, Oostendorp RA, et al. Prognostic factors for low back pain in patients referred for physiotherapy: comparing outcomes and varying modeling techniques. Spine (Phila Pa 1976). 2005;30 : 1881–1886.
38. Pincus T, Burton AK, Vogel S, Field AP. A systematic review of psychological factors as predictors of chronicity/disability in prospective cohorts of low back pain. Spine (Phila Pa 1976). 2002;27:E109–E120.
39. Ware JE Jr, Sherbourne CD. The MOS 36-item short-form health survey (SF-36). I. Conceptual framework and item selection. Med Care. 1992;30 : 473–483. 1593914
40. de Vet HC, Heymans MW, Dunn KM, Pope DP, van der Beek AJ, Macfarlane GJ, et al. Episodes of low back pain: a proposal for uniform definitions to be used in research. Spine (Phila Pa 1976). 2002;27 : 2409–2416. doi: 10.1097/01.brs.0000030307.34002.be
41. Moseley GL, Herbert RD, Parsons T, Lucas S, Van Hilten JJ, Marinus J. Intense pain soon after wrist fracture strongly predicts who will develop complex regional pain syndrome: prospective cohort study. J Pain. 2014;15 : 16–23. doi: 10.1016/j.jpain.2013.08.009 24268113
42. Steyerberg EW. Clinical prediction models: a practical approach to development, validation, and updating. New York: Springer Science & Business Media; 2008.
43. Box GE, Tidwell PW. Transformation of the independent variables. Technometrics. 1962;4 : 531–550.
44. Becker A, Held H, Redaelli M, Strauch K, Chenot JF, Leonhardt C, et al. Low back pain in primary care: costs of care and prediction of future health care utilization. Spine (Phila Pa 1976). 2010;35 : 1714–1720.
45. Harrell FE Jr, Califf RM, Pryor DB, Lee KL, Rosati RA. Evaluating the yield of medical tests. JAMA. 1982;247 : 2543–2546. 7069920
46. Steyerberg EW, Vickers AJ, Cook NR, Gerds T, Gonen M, Obuchowski N, et al. Assessing the performance of prediction models: a framework for some traditional and novel measures. Epidemiology. 2010;21 : 128–138. doi: 10.1097/EDE.0b013e3181c30fb2 20010215
47. Gerds TA, Cai T, Schumacher M. The performance of risk prediction models. Biom J. 2008;50 : 457–479. doi: 10.1002/bimj.200810443 18663757
48. Harrell F, Lee KL, Mark DB. Tutorial in biostatistics multivariable prognostic models: issues in developing models, evaluating assumptions and adequacy, and measuring and reducing errors. Stat Med. 1996;15 : 361–387. 8668867
49. Steyerberg EW, Harrell FE, Borsboom GJ, Eijkemans M, Vergouwe Y, Habbema JDF. Internal validation of predictive models: efficiency of some procedures for logistic regression analysis. J Clin Epidemiol. 2001;54 : 774–781. 11470385
50. Alsaadi SM, McAuley JH, Hush JM, Lo S, Lin CWC, Williams CM, et al. Poor sleep quality is strongly associated with subsequent pain intensity in patients with acute low back pain. Arthritis Rheum. 2014;66 : 1388–1394.
51. Aili K, Nyman T, Hillert L, Svartengren M. Sleep disturbances predict future sickness absence among individuals with lower back or neck-shoulder pain: a 5-year prospective study. Scand J Public Health. 2015;43 : 315–323. doi: 10.1177/1403494814567755 25724467
52. Vickers AJ, Elkin EB. Decision curve analysis: a novel method for evaluating prediction models. Med Decis Making. 2006;26 : 565–574. doi: 10.1177/0272989x06295361 17099194
53. Team RC. R: a language and environment for statistical computing. Vienna: R Foundation for Statistical Computing; 2014.
54. Koes BW, van Tulder M, Lin CW, Macedo LG, McAuley J, Maher C. An updated overview of clinical guidelines for the management of non-specific low back pain in primary care. Eur Spine J. 2010;19 : 2075–2094. doi: 10.1007/s00586-010-1502-y 20602122
55. Riley RD, Hayden JA, Steyerberg EW, Moons KGM, Abrams K, Kyzas PA, et al. Prognosis Research Strategy (PROGRESS) 2: prognostic factor research. PLoS Med. 2013;10:e1001380. doi: 10.1371/journal.pmed.1001380 23393429
56. Hingorani AD, Windt DA, Riley RD, Abrams K, Moons KG, Steyerberg EW, et al. Prognosis research strategy (PROGRESS) 4: stratified medicine research. BMJ. 2013;346:e5793. doi: 10.1136/bmj.e5793 23386361
57. Steyerberg EW, Ewout WS. Clinical prediction models: a practical approach to development, validation, and updating. Dordrecht: Springer; 2008.
58. Austin PC, Tu JV. Automated variable selection methods for logistic regression produced unstable models for predicting acute myocardial infarction mortality. J Clin Epidemiol. 2004;57 : 1138–1146. 15567629
59. Hancock M, Maher C, Petocz P, Lin CC, Steffens D, Luque-Suarez A, et al. Risk factors for a recurrence of low back pain. Spine J. 2015;15 : 2360–2368. doi: 10.1016/j.spinee.2015.07.007 26169027
60. Chou R, Fu R, Carrino JA, Deyo RA. Imaging strategies for low-back pain: systematic review and meta-analysis. Lancet. 2009;373 : 463–472. doi: 10.1016/s0140-6736(09)60172-0 19200918
61. Janssen KJ, Donders ART, Harrell FE, Vergouwe Y, Chen Q, Grobbee DE, et al. Missing covariate data in medical research: to impute is better than to ignore. J Clin Epidemiol. 2010;63 : 721–727. doi: 10.1016/j.jclinepi.2009.12.008 20338724
62. Steyerberg EW, Vickers AJ. Decision curve analysis: a discussion. Med Decis Making. 2008;28 : 146. doi: 10.1177/0272989X07312725 18263565
63. Hush JM, Refshauge K, Sullivan G, De Souza L, Maher CG, McAuley JH. Recovery: what does this mean to patients with low back pain? Arthritis Rheum. 2009;61 : 124–131. doi: 10.1002/art.24162 19116958
64. Williams CM, Hancock MJ, Maher CG, McAuley JH, Lin CWC, Latimer J. Predicting rapid recovery from acute low back pain based on the intensity, duration and history of pain: a validation study. Eur J Pain. 2014;18 : 1182–1189. doi: 10.1002/j.1532-2149.2014.00467.x 24648103
Štítky
Interní lékařstvíČlánek vyšel v časopise
PLOS Medicine
2016 Číslo 5
- Alternativní léčebné možnosti u hypercholesterolemie při intoleranci statinů
- Vliv kombinace nutraceutik na remodelaci levé komory srdeční u osob s metabolickým syndromem
- Nutraceutika a jejich ovlivnění mírného kardiometabolického rizika
- Princip účinku medu v léčbě chronických i infikovaných ran
- Superoxidovaný roztok a jeho využití v léčbě ran
Nejčtenější v tomto čísle
- Estimating the Risk of Chronic Pain: Development and Validation of a Prognostic Model (PICKUP) for Patients with Acute Low Back Pain
- Prioritizing Surgical Care on National Health Agendas: A Qualitative Case Study of Papua New Guinea, Uganda, and Sierra Leone
- A Revolution in Treatment for Hepatitis C Infection: Mitigating the Budgetary Impact
- Toward a Common Secure Future: Four Global Commissions in the Wake of Ebola