
Prevalence of Epistasis in the Evolution of Influenza A Surface Proteins
The surface proteins of human influenza A viruses experience positive selection to escape both human immunity and, more recently, antiviral drug treatments. In bacteria and viruses, immune-escape and drug-resistant phenotypes often appear through a combination of several mutations that have epistatic effects on pathogen fitness. However, the extent and structure of epistasis in influenza viral proteins have not been systematically investigated. Here, we develop a novel statistical method to detect positive epistasis between pairs of sites in a protein, based on the observed temporal patterns of sequence evolution. The method rests on the simple idea that a substitution at one site should rapidly follow a substitution at another site if the sites are positively epistatic. We apply this method to the surface proteins hemagglutinin and neuraminidase of influenza A virus subtypes H3N2 and H1N1. Compared to a non-epistatic null distribution, we detect substantial amounts of epistasis and determine the identities of putatively epistatic pairs of sites. In particular, using sequence data alone, our method identifies epistatic interactions between specific sites in neuraminidase that have recently been demonstrated, in vitro, to confer resistance to the drug oseltamivir; these epistatic interactions are responsible for widespread drug resistance among H1N1 viruses circulating today. This experimental validation demonstrates the predictive power of our method to identify epistatic sites of importance for viral adaptation and public health. We conclude that epistasis plays a large role in shaping the molecular evolution of influenza viruses. In particular, sites with , which would normally not be identified as positively selected, can facilitate viral adaptation through epistatic interactions with their partner sites. The knowledge of specific interactions among sites in influenza proteins may help us to predict the course of antigenic evolution and, consequently, to select more appropriate vaccines and drugs.
Published in the journal:
. PLoS Genet 7(2): e32767. doi:10.1371/journal.pgen.1001301
Category:
Research Article
doi:
https://doi.org/10.1371/journal.pgen.1001301
Summary
The surface proteins of human influenza A viruses experience positive selection to escape both human immunity and, more recently, antiviral drug treatments. In bacteria and viruses, immune-escape and drug-resistant phenotypes often appear through a combination of several mutations that have epistatic effects on pathogen fitness. However, the extent and structure of epistasis in influenza viral proteins have not been systematically investigated. Here, we develop a novel statistical method to detect positive epistasis between pairs of sites in a protein, based on the observed temporal patterns of sequence evolution. The method rests on the simple idea that a substitution at one site should rapidly follow a substitution at another site if the sites are positively epistatic. We apply this method to the surface proteins hemagglutinin and neuraminidase of influenza A virus subtypes H3N2 and H1N1. Compared to a non-epistatic null distribution, we detect substantial amounts of epistasis and determine the identities of putatively epistatic pairs of sites. In particular, using sequence data alone, our method identifies epistatic interactions between specific sites in neuraminidase that have recently been demonstrated, in vitro, to confer resistance to the drug oseltamivir; these epistatic interactions are responsible for widespread drug resistance among H1N1 viruses circulating today. This experimental validation demonstrates the predictive power of our method to identify epistatic sites of importance for viral adaptation and public health. We conclude that epistasis plays a large role in shaping the molecular evolution of influenza viruses. In particular, sites with , which would normally not be identified as positively selected, can facilitate viral adaptation through epistatic interactions with their partner sites. The knowledge of specific interactions among sites in influenza proteins may help us to predict the course of antigenic evolution and, consequently, to select more appropriate vaccines and drugs.
Introduction
Influenza A is among the most extensively studied viruses, owing to its importance as a human pathogen [1]–[6]. With a large, public database of genetic sequences, influenza viruses also offer a model system for studying molecular evolution in general. The evolution of influenza viruses is characterized by frequent reassortment events within subtypes [3], [7] as well as high rates of amino-acid substitutions in the viral surface proteins hemagglutinin (HA) and neuraminidase (NA) [8]–[10]. Such high evolutionary rates reflect both the poor fidelity of the viral polymerase [10], and the strong selection pressures to evade the human immunity [8], [9], [11]–[13] and, more recently, to develop drug resistance [14]–[16].
Numerous experimental studies and statistical analyses of genetic and antigenic data have identified sets of residues in HA and NA proteins, the so called epitopes, that are bound by human antibodies [17]–[20]. As a consequence, the epitopic sites tend to evolve especially quickly, in order to evade immunity [8], [21], [22]. Moreover, several recent studies have suggested lists of amino acids at specific residues in HA that evolved under positive selection over the past 40 years [23]–[25].
In addition to escaping human antibodies, several other selective forces act on hemagglutinin. As with any functional protein, HA must maintain its stability and its function – namely, to bind the sialic acid receptor of host cells and subsequently mediate membrane fusion [17], [18], [20], [26]. Thus, antibody escape mutations must not compromise these properties. Yet, numerous studies of protein evolution in vitro [27]–[29] as well as studies in bacteria [30] and viruses [20], [31], [32] have shown that beneficial mutations are often pleiotropic: in addition to their original beneficial effect, they cause some, usually negative, side effects on other protein properties, such as stability [28], [33]. These negative effects can typically be alleviated or compensated by other mutations, making certain combinations of mutations substantially more beneficial than single mutations alone [34], [35]. This phenomenon is known as positive epistasis between mutations [36]. Epistasis can also be negative, if a combination of mutations confers a smaller fitness gain than would be expected under additive effects of the individual mutations [36].
Epistasis is commonplace in eukaryotes [37]–[39], bacteria [30], [40], [41], and viruses [31], [34], [35], [42], and it plays an important role in the evolution of immune escape and drug resistance in various pathogens [35], [43]–[46] including influenza [16], [32]. Surprisingly, the extent of epistatic interactions in influenza proteins has not been systematically quantified or utilized. Yet, the knowledge of such interactions might provide a powerful tool for predicting future antigenically important substitutions and, consequently, for selecting better vaccine strains.
Numerous methods have been developed for detecting epistasis between mutations, based on sampled genetic sequences [47]. Early methods were based on the idea that co-evolving pairs of sites in a protein should leave a typical signature in a sequence alignment, which can be detected using quantities such as mutual information [48]–[50]. However, such methods ignore the phylogenetic relationships among sequences and so are justified only if the divergence times between samples are very large [51]. Various corrections for the phylogenetic non-independence have been proposed [52]–[54], and their performance has been shown to be satisfactory in some cases [55]–[57]. Nevertheless, methods that explicitly take account of the phylogeny are preferable [58]. Several such methods have been proposed recently [42], [59]–[66]. Most of them attempt to detect unusually frequent co-occurrences of substitutions at pairs of sites on individual branches of the phylogeny. This approach is conservative since it detects only those positively epistatic pairs of sites for which a mutation at one site increases the beneficial effect of a mutation at the second site so dramatically that one mutation could not fix without the other one [42]. Such strong epistasis can occur, for example, when one mutation confers a strongly deleterious effect that is compensated by a second mutation. However, a mutation at one site in a protein may lead to only a moderate increase in the beneficial effect of a mutation at another site, so that the latter substitution occurs at an accelerated rate, but it does not necessarily appear exclusively on the same branch of the phylogeny [59], [62], [64], [65]. In other words, substitutions at positively epistatic pairs of sites are likely to be temporally clustered [67]. In this paper, we exploit this idea to design an “epistasis statistic” that allows us to detect a broad class of epistatically interacting pairs of sites.
In essence, for each ordered pair of sites in a protein we measure the amount of phylogenetic time that typically elapses between a substitution at the first site and a subsequent substitution at its partner site. The epistasis statistic is defined as a decreasing function of this time interval. Thus, pairs in which the substitution rate at the second site tends to be increased after a substitution at the first site will have a larger value of the statistic. We obtain the null distribution of this statistic for all pairs simultaneously, by randomly shuffling the identities of substitutions on the phylogeny. We show that the number of site pairs in the surface proteins of the human influenza A/H3N2 virus with large values of the epistasis statistic significantly exceeds the null expectation—thus, influenza surface proteins evolve under substantial positive epistasis. We characterize the epistatically interacting sites we have inferred in terms of their overall patterns of evolution, protein locations, and functional significance. For type-1 neuraminidase, we compare the identities of the epistatic sites we have inferred with those that have been experimentally verified. We discuss the implications of our results both for practical issues surrounding influenza's antigenic drift and drug resistance, and for broader issues surrounding protein evolution in general.
Results
Identifying epistatic pairs of sites
We reconstructed the phylogenetic trees for HA and NA proteins (subtypes H3N2 and H1N1) and inferred the nucleotide sequences at internal nodes by maximum likelihood as described in “Materials and Methods”. In order to detect pairs of codon sites in a protein that have evolved under positive epistasis we used the “epistasis statistic” described in “Materials and Methods”.
Briefly, the epistasis statistic considers an ordered pair of sites, the first of which is called the “leading site” and the second is called the “trailing site”. The epistasis statistic tends to be large for pairs of sites in which a non-synonymous substitution at site tends to quickly follow a non-synonymous substitution at site , and for which substitutions at the trailing site occur in multiple lineages (see schematic in Figure 1). We measure time between a pair of non-synonymous substitutions as the number of synonymous substitutions that occur between them. Since we are interested in positive epistasis and would like to detect only those pairs of substitutions in which the second substitution is beneficial, we excluded all substitutions at terminal branches, because many such substitutions are likely to be deleterious. We also discarded all sites that experienced fewer than two substitutions at the internal branches (Table 1).


The epistasis statistic depends on the parameter that sets the timescale over which substitutions contribute information. Pairs of substitutions that are separated by times much shorter than contribute significantly to the epistasis statistic, whereas pairs of substitutions that are separated by times much longer than do not. We set to be equal to the average time , measured in the number of synonymous substitutions, that elapses between two non-synonymous substitutions randomly sampled from a phylogeny (see Text S1 and Table 1). For each phylogeny (H1, N1, H3, and N2) and its corresponding value of , we computed the epistasis statistic for all qualifying ordered pairs of sites and, for each such pair, we computed the distribution of the epistasis statistic under the non-epistatic null hypothesis (see “Materials and Methods” for details). We then selected all pairs of sites whose nominal was smaller or equal to 0.01. In H3, we identified 333 site pairs with a nominally significant epistasis statistic; we identified 225 such pairs in H1, 205 such pairs in N1, and 188 such pairs in N2 (see Table 1, and Table S1). Examples of epistatic site pairs in HA and NA are shown in Figure 2 and Figure 3.

We computed the false discovery rate (FDR) as well as the overall for the observed number of significant pairs (see “Materials and Methods”). Although the FDR in all proteins was high, around 60%, the observed number of nominally significant pairs was much larger than would be expected by chance (, see Table 1). Reducing the nominal cutoff somewhat reduced the FDR but also disproportionately reduced the number of inferred positives (see Figure S1).
We tested the sensitivity of our method with respect to the choice of the timescale parameter, in the range from to , as well as to uncertainty in phylogeny and internal node reconstruction. The results remained qualitatively similar to those reported here (see Text S1, Figure S2, and Table S4). As a negative control, we performed 100 simulations in which sites evolved independently (i.e. without epistasis) along a given phylogenetic tree (see “Materials and Methods”). In 52 out of 100 simulations, the number of significant pairs at the cutoff 0.01 was smaller than expected, in 47 cases this number was larger that expected, but not significantly so. In only one simulation out of 100 was this number larger than expected and significant (). We are therefore confident that our method indeed detects epistatic pairs of sites, and it does not systematically report more false positives than our FDR computation indicates.
Characterizing epistatic pairs of sites
Having obtained a list of pairs of sites with putative epistatic interactions (Table S1, Figure 2 and Figure 3), we inspected the properties of these pairs, compared to an appropriate null set. In particular, we compared the true, epistatic pairs to the pairs that had appeared as nominally significant in the 400 “fake data sets” produced by permutation (see “Materials and Methods”). Thus, we asked whether the pairs that we detected as epistatic differed systematically from the false positive pairs. We investigated three types of properties: the average dN/dS value at epistatically interacting sites, their location in the protein with respect to known epitopes (for H3N2 only), and the distances between interacting sites. For comparison of physical and linear distances we also excluded sites that were not present in the resolved crystal structure (see “Materials and Methods”). The results are summarized in Table 2 and Table 3, and discussed below.

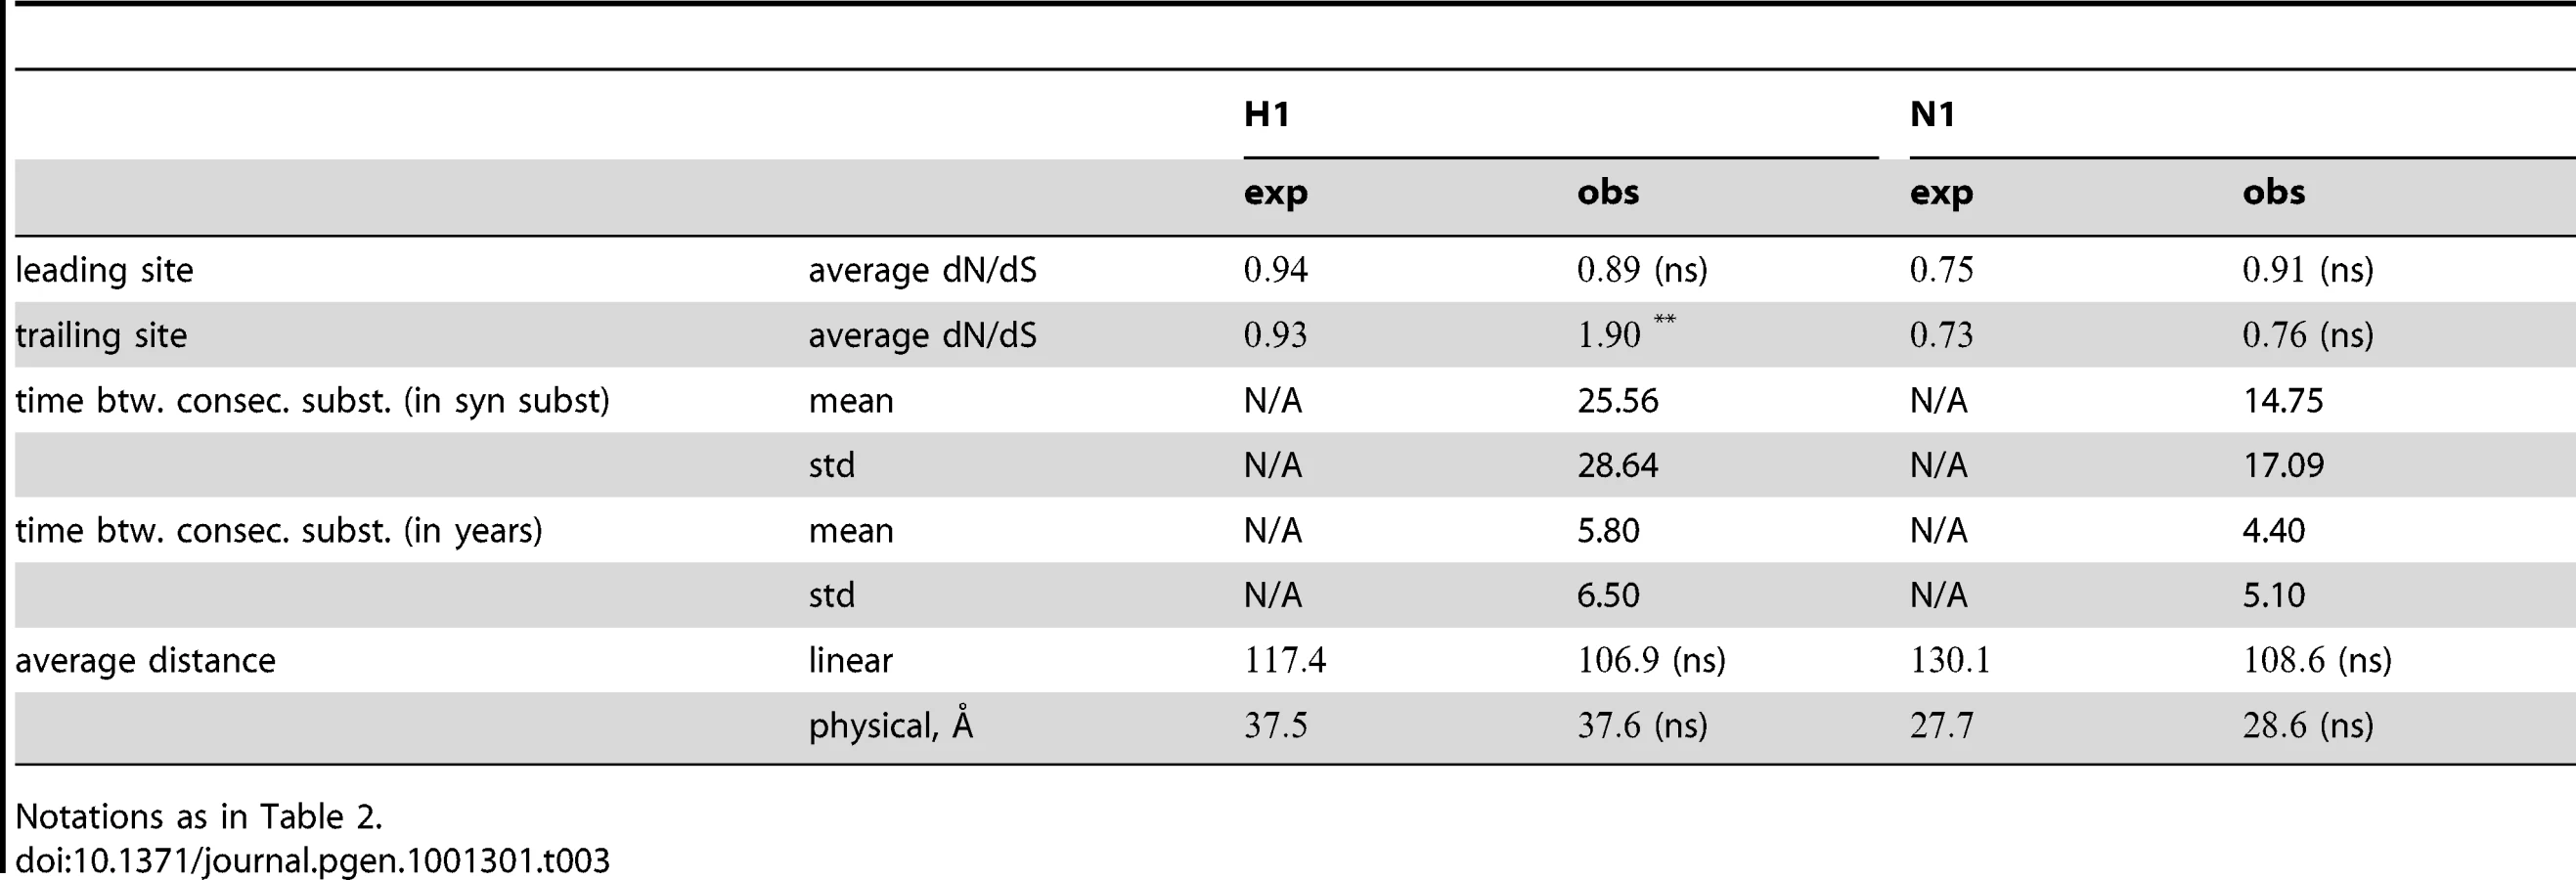
The dN/dS values at the leading sites among the putative epistatic pairs were not significantly larger, on average, than at the leading sites among pairs identified under permutation. However, the average dN/dS value at the leading sites was less than one, which is usually interpreted as evidence of purifying selection. Therefore, without an analysis of epistasis, many of the leading sites would not have been identified as experiencing positive selection, even though they may play a critical role in facilitating adaptation in co-ordination with substitutions at their partner sites.
By contrast to the leading sites, the dN/dS values at the trailing sites were significantly larger than the null expectation, and they exceeded one on average (with the exception of N1). Thus, the trailing sites exhibit the characteristic signature of positive selection [68], even though the positive selection they experience was likely made possible (or, at least, more likely) by preceding substitutions at their corresponding leading sites. In other words, many of the positively selected substitutions that have occurred in HA and NA may have been facilitated by previous substitutions at epistatically interacting sites. In previous work, we have identified 25 sites in H3 at which certain specific amino acids evolved under directional positive selection [25]. Interestingly, 22 of these sites appear to be involved in epistatic interactions: 10 sites appear as leading sites, 7 sites appear as trailing, and 5 sites appear as both.
We also studied the location of epistatic sites with respect to the known antigenic regions of the influenza surface proteins, for H3 and N2. In both proteins, the leading site in an epistatic pair was more likely to fall within an antigenic epitope than under the null expectation (and significantly so in H3). The trailing site was slightly more likely to fall outside of known epitopes, despite the fact that the dN/dS ratio was typically greater than 1 at such sites. Thus, pairs of sites in which the leading site was in an epitope and the trailing site was not in an epitope, were typically overrepresented (although not significantly so). This suggests that the leading sites may often be directly involved in antigenic escape and the trailing sites may subsequently compensate for deleterious (e.g. destabilizing) side effects of the initial mutation. In some cases, however, both the leading and trailing sites of an epistatic pair fall within epitopes (47% of pairs in H3, 9% of pairs in N2). In such cases, for H3, the leading and trailing sites were significantly more likely to fall in different epitopes from each other, than expected – suggesting that substitutions across multiple epitopes may be particularly important for antigenic escape, at least in hemagglutinin of the H3 subtype. This observation reflects the widely held belief that antigenic change in hemagglutinin typically requires multiple substitutions spread across multiple epitopes [21], [26].
How far apart are the leading and trailing sites of epistatic pairs? Surprisingly, neither the average linear (sequence) distance nor the physical distance between the leading and the trailing sites in an epistatically interacting pair was significantly smaller than would be expected among false positive pairs.
Finally, we investigated the timing of consecutive substitutions at the leading and trailing sites in epistatic pairs. On average, both across pairs and across consecutive substitutions, a substitution at a leading site in H3 was followed by a consecutive substitution at its corresponding trailing site 3.7 years later (see Text S1 for details). Similarly, in H1 the mean time between consecutive substitutions was 5.8 years; 4.4 years in N1; and 4.2 years in N2. In all cases, the mean time between consecutive substitutions exceeds two years – which suggests that the observation of a substitution at the leading site of a known epistatic pair may provide useful predictive value for anticipating a subsequent substitution at its corresponding trailing site, within the time-frame required for selecting a seasonal vaccine strain [69].
Epistasis and the evolution of oseltamivir resistance
Our analyses of substitution patterns suggest that positive epistasis is prevalent among sites in HA and NA. However, it is important to verify experimentally that the identified pairs of sites indeed show non-additive fitness effects. Fortunately, such verification has recently been performed for two specific pairs of sites in type-1 neuraminidase.
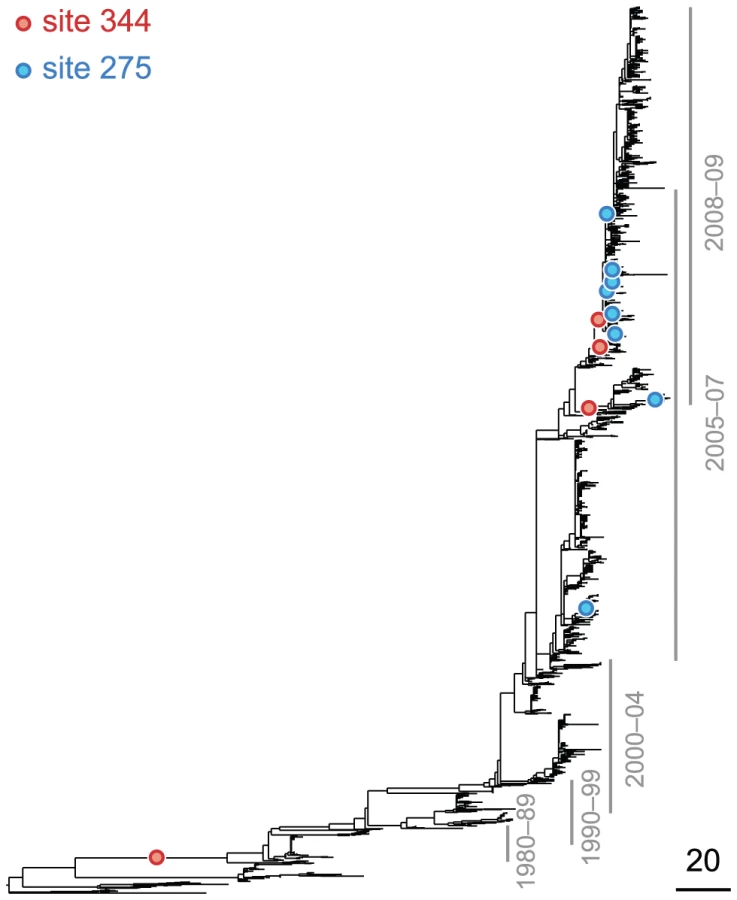
Currently circulating variants of the seasonal H1N1 subtype are resistant to the drug oseltamivir, which inhibits neuraminidase [15]. Resistance to this drug is conferred by the mutation at site 275, which is referred to as the “H274Y” mutation in the literature [15]. However, this mutation is known to be strongly deleterious in the absence of the drug [70]. Recently, Bloom et al. demonstrated that mutations R222Q and V234M restore the drug-resistant mutant's fitness in vitro [16], for seasonal H1N1. They also observed that mutations R222Q and V234M were fixed in the seasonal H1N1 population prior to the emergence of the H275Y mutation, and thus they likely acted as epistatic “permissive mutations” for the emergence of drug resistance in competent viruses.
Our statistical analysis of epistasis in N1, based on patterns of sequence evolution alone, is remarkably concordant with the experimental findings of Bloom et al. In particular, our analysis indicates that sites 222 and 234 interact strongly with site 275 (see Table S1). Moreover, among the top 10 most significantly epistatic pairs in N1 there are 6 other pairs that involve the drug-resistance site 275 as the trailing site; the leading sites in these pairs are 214, 287, 329, 354, 382, and 344. In all cases the subsequent mutation at site 275 is . Therefore, aside from sites 222 and 234, our analysis predicts that these six additional sites may be permissive mutations that, in combination with H275Y, produce competent, drug-resistant viruses. Although no epistasis between two of these sites (214 and 382) and site 275 was found experimentally [16], one of the mutations (D344N) has subsequently been shown to help counteract the decrease in total surface-expressed activity associated with the mutant neuraminidase ([71] and Jesse Bloom, personal communication), and it, along with 224 and 234, may have played a role in the emergence of oseltamivir resistance in seasonal H1N1 viruses before 2009.
Although further experimental validation is required, the remarkable concordance between our statistical inferences and experimentally verified epistatic interactions [16] suggests that patterns of sequence evolution contain extremely useful information about a protein's fitness landscape. In the case of oseltamivir resistance, this information is highly specific and of significant import to public health.
The oseltamivir resistance mutation, H275Y, was known in advance of the drug's widespread introduction. Moreover, this prior knowledge was used by Bloom et al. [16] to focus their experimental search for an epistatic partner to site 275. Nonetheless, our method of identifying epistatic pairs from sequence data implicates site 275 – without any prior knowledge of its role in drug resistance – as extremely important in the adaptive evolution of N1, especially in combination with sites 222, 234, and six other leading sites (Table S1). This demonstrates the practical, predictive power of our method for inferring the specific, epistatic interactions that shape viral adaptation. Thus, our method may, in the future, help us identify sites important for drug resistance or antigenic drift, even when no prior experimental data are available.
Finally, we note that our analysis implicates sites 222 and 234, which have been verified as important epistatic partners of the oseltamivir resistance site 275, as significant epistatic leading sites even when we restrict our data set to those viral isolates prior to the introduction of oseltamivir. In particular, based on sequence data prior to 2001, our method identifies sites 222 and 234 as participating in epistatic interactions with sites other than 275 (see Table S1). Thus, sites 222 and 234 may be structurally important and experience epistatic interactions even in the absence of selection for oseltamivir resistance.
Discussion
We have developed a statistical method to detect positive epistasis between pairs of sites in a protein, based on patterns of thoroughly-sampled sequence variation. The essential idea underlying this method is simple: a substitution at one site should rapidly follow a substitution at another site if the sites interact epistatically. We applied this method to identify putative epistatic pairs in the influenza surface proteins hemagglutinin and neuraminidase, and we found a highly significant number of interacting pairs. We characterized the properties of the leading and trailing sites identified as epistatic. Finally, we validated our approach by comparison to experimentally verified epistatic interactions in neuraminidase, with significant implications for public health.
This study sheds some light on methodological and empirical questions in molecular evolution generally, as well as practical questions about influenza viral evolution in particular. Methodologically, it is instructive to compare our approach to identifying epistasis with other techniques in the literature. Over very long timescales, interacting sites in a protein have been identified by inspecting multiple sequence alignments, ignoring the phylogenetic relationship among the sequences being compared. Such an approach is justifiable over timescales so long that each site may be treated independently, and indeed it has proven successful at identifying epistasis in proteins conserved across all domains of life [51]. However, such techniques are not justified for shorter timescales, because correlations between sites may arise simply as the result of linkage and shared ancestry [58]. Although techniques exist to control for phylogeny in such tests [52]–[54], it is preferable to leverage the phylogeny in the design of a more powerful statistic for epistasis – which is the approach we have taken here.
Even among the techniques that account for phylogeny, methods differ in their power to detect epistasis. Some methods will be more powerful in some contexts, and others in other contexts – depending upon the structure of epistasis among sites, the selection coefficients involved, and the density of sampling. Most existing methods that utilize phylogenetic information assume that epistatic substitutions will co-occur along the same branch of the phylogeny [42], [60], [63], [64]. This assumption will not always be met, however, if the selective advantage conferred by a substitution at the trailing site is only moderate; in such cases, substitutions at trailing sites will occur at an accelerated rate but they may likely fall on subsequent branches in the phylogeny. To demonstrate this point, we applied the method of Poon et al [64], implemented in the HyPhy package [72], to the same data set of influenza sequences. That method detected 4 to 10 times fewer epistatically interacting pairs of sites than our method did, at the same false discovery rate (see Text S1 and Tables S2 and S3). Importantly, the method by Poon et al. failed to detect epistatic interactions between sites 222 and 234 and the drug-resistance site 275 in neuraminidase subtype N1, even though those pairs were highly ranked by our method and those epistatic interactions were confirmed experimentally. Although a thorough comparison between various existing methods is beyond the scope of this paper, we believe that the additional power of our method to detect epistasis in the influenza data arises because we allow for time lags between substitutions at interacting sites.
The epistasis statistic developed here is admittedly ad-hoc, compared to systematic, likelihood-based methods for jointly inferring phylogeny and epistasis under Markov substitution models [73]–[75]. At the same time, the vast dimensionality associated with substitution models incorporating pairwise epistasis, of order for a sequence of length , is daunting; whereas the frequentist statistic defined here seems to perform quite well. The strong performance of our approach likely arises from our ability to infer ancestral states reliably, due to the high-resolution sampling of influenza sequences.
Our method has several important shortcomings. One drawback is that it requires a large number of substitutions per site in order to discriminate between truly interacting site pairs and pairs that sustain substitutions in close succession just by chance. Moreover, even if the protein evolves rapidly, as influenza surface proteins do, the false discovery rate is still very high. Our method will likely perform much worse for proteins that evolve slowly or have been sampled sparsely.
Two other concerns are problematic for our approach, as well as most other methods of detecting epistasis from phylogenetic data. Such approaches generally suffer from the inability to weed out spuriously epistatic pairs, which leads to high false discovery rates. There are at least two sources of spuriously significant pairs: hitchhiking and coordinated temporal variation in selection pressures across sites. Imagine, for example, that sites and interact epistatically and that multiple substitutions at site in independent lineages rapidly follow a single substitution at site . Then site pair would be detected by our method. However, if the variant that carries the leading mutation at site also, by chance, happens to carry a mutation at site (which is not epistatic with ), then mutation hitchhikes to fixation together with mutation and so the site pair may also be detected as epistatic. In fact, mutation at site may be advantageous while mutation at site may be a neutral or slightly deleterious mutation that hitchhikes to fixation together with , but then “permits” the beneficial mutation at site . It may be possible to reduce the false discovery rate by designing statistics that consider only those site pairs for which consecutive substitutions involve multiple independent substitutions at the leading site as well as the trailing site.
Coordinated temporal variation in selection pressures across sites is another source of potential false positives under this and other tests of epistasis. Consider, for example, sites 391 and 73 in H3 illustrated in Figure 2. Substitutions at site 73 appear to quickly follow substitutions at site 391 in the early 1990's. Apart from epistasis, the clustering of substitutions at these two sites could be explained if both sites independently experienced positive selection during this time period, and otherwise negative selection. However, if this explanation were the dominant one for the observed clustering of substitutions, then, for each nominally significant ordered pair of sites, we would expect its inverse pair also to be nominally significant, on average. Yet, we do not find a single nominally significant pair whose inverse pair is also nominally significant, even though consecutive substitutions do occur in the direct and reverse order (see for example, Figure 2 and Table S1). It is unlikely that this observation is caused by insufficient sampling. Indeed, in H3, there are typically more than 6 substitutions (at internal branches) at either a leading or trailing site in an identified epistatic pair, and similarly for the other proteins. Moreover, many sites appear in our lists as both leading and trailing. Thus, leading and trailing sites exhibit similar number and pattern of substitutions, and there is plenty of power to detect a significant epistasis statistic in both directions. This suggests that the excess of significant pairs we observe is likely caused by epistasis, rather than coordinated temporal variation in selection pressures.
Another shortcoming of our method is that it aims to detect epistasis only between pairs of sites, whereas interactions among residues in a protein are certainly more complex. This may be a cause of our large false discovery rate. Imagine, for example, three sites, , , and , such that pairs and interact epistatically, but the pair does not. If substitutions at site quickly follow substitutions at site and if substitutions at site quickly follow substitutions at site , our method may detect the pair as epistatic, even though there is no direct epistatic interaction between these sites. Indeed, in our list of putatively epistatic pairs, we find 133 of such “circular” triplets in H3, 41 triplets in N2, 81 triplets in H1, and 71 triplets in N1. In order to discriminate truly epistatically interacting site pairs from spurious pairs, it may be possible to modify the Bayesian graphical models recently used for detecting epistasis in HIV [64], [66] to incorporate a time lag between consecutive substitutions.
Finally, although our method detects epistatic interactions between pairs of sites, it does not determine which specific mutations at those sites were epistatic. Extending our permutation technique to incorporate the information about specific mutations may prove difficult, but in many cases it is unnecessary. Often we can a posteriori identify the specific mutations that led to a significant value of the epistasis statistic for a pair of sites. For example, the drug-resistance site 275 is identified as trailing with many leading sites in N1 (see Table S1), but the specific substitutions at site 275 are all in fact identical: H275Y.
Methodological issues aside, our results on epistasis in HA and NA have several important practical implications for our understanding of influenza evolution. We have demonstrated that our method reliably infers a critically important oseltamivir resistance site, as well as the associated leading sites at which initial mutations are required for the production of a viable, drug-resistant virus. Remarkably, we can identify some of the leading sites (222 and 234) even when restricted to sequence data prior to the introduction of the drug. This degree of specificity and accuracy may prove helpful in preparing for resistance to other drugs that may be developed, or in predicting the emergence of oseltamivir resistance in the recent type-1 swine neuraminidase responsible for the 2009-10 influenza pandemic.
In addition to NA, we have also detected substantial amounts of epistasis in HA, including in the known epitopes, likely associated with antigenic drift. Knowledge of specific pairs of sites that interact epistatically in HA may improve our ability to predict future antigenic variants, and thus to calibrate vaccine strain choices accordingly. Previous studies of HA antigenic evolution have focused almost exclusively on those sites with the strongest signatures of positive selection, e.g. elevated dN/dS ratios [8], [21], [22]. However, our results suggest that this approach will inevitably miss many sites of genuine importance to adaptation, and will implicate others that are not directly involved in antigenic escape. In particular, we have seen that the leading site of an epistatic pair often falls within an epitope, but it also often exhibits . In contrast, the trailing site typically falls outside of an epitope and it exhibits significantly elevated . This observation appears counter to our expectation that epitopic sites have elevated dN/dS values and non-epitopic sites have depressed dN/dS values. However, not all epitopic sites experience elevated dN/dS values at all times because different epitopes may be immunodominant at different times [76], [77]. Thus, an average dN/dS value at a site may be well below 1 even if this site occasionally evolves under strong immune selection [78].
The patterns of epistatic interactions we have detected suggest the the following speculative model for the evolution of influenza surface proteins. If an epitope is immunodominant at a certain period of time, the pressure for antigenic escape is so strong that the leading site, of antigenic importance, substitutes despite a negative side-effect (e.g. diminished protein stability or function). This side-effect is subsequently compensated by a substitution at another, relatively unconstrained, site, in an epitope or not. It is possible that such unconstrained sites may act as “global suppressors”, i.e., compensate the destabilizing effects of many mutations [79], [80]. If there is a constant need for compensation (caused by antigenically important mutations), such compensating sites will continually evolve under positive selection and will exhibit . Under this scenario, the roles of the two sites would both be misinterpreted by an analysis based on dN/dS alone that neglects epistasis. In particular, our observations imply that mutations at sites with may sometimes be extremely important for antigenic adaptation, even though they have been largely ignored in compilations of antigenically relevant sites [8], [11], [21]. Conversely, some mutations at sites with may be unimportant for antigenicity per se, but are positively selected simply to compensate for prior antigenic escape mutations with deleterious side effects. Another potential mechanism of epistasis in influenza surface proteins could be the dynamic balance between mutations that simultaneously influence receptor binding avidity and antigenicity, as suggested recently by Hensley et al. [81].
Some of the epistatic pairs that we detect consist of an apparently neutral but “permissive” mutation at the leading site followed by a highly advantageous mutation at the trailing site, such as the pair of mutations V234M and H274Y in N1 previously identified by Bloom et al [16] and also detected by our method (Table S1). This observation is consistent with the idea that neutral or nearly neutral substitutions can facilitate adaptation at partner sites that might not otherwise have been available—a concept that has received much attention in theoretical studies of adaptation [82], [83] and of influenza evolution in particular [84].
Finally, we have observed that epistatic residues do not tend to be significantly closer to each other in the folded protein structure than would be expected by chance – a result that we expect to hold generally, and which suggests that structural influences on epistasis are probably not as straightforward as simple proximity of residues. In the future, it will be important to investigate, by computation or experiment, whether epistatic partner sites are compensating for protein stability even if they are distant from each other in a folded protein structure.
Materials and Methods
Data
We downloaded all HA and NA coding region sequences of human influenza A virus subtypes H1N1 and H3N2 that were available in the NCBI's Influenza Virus Resource [85] in June 2010. The amino acid sequences were aligned using Clustal W ver. 1.83 [86] and the alignments were reverse translated using PAL2NAL [87]. Occasional gaps in the alignments were filled if more than 70 percent of sequences agreed on the nucleotide at the gap position; otherwise the sequence with a gap was excluded from further analysis. To test some aspects of our method, we used a smaller HA data set (subtype H3N2) which was downloaded in April 2009. To investigate whether our method detected any of the known epistatic site pairs in type-1 NA prior to the introduction of oseltamivir, we also used a truncated data set of N1 sequences with all sequences isolated subsequent to 2001 removed. All used alignments are available upon request.
In computing the epistasis statistic we excluded all substitutions at terminal branches, and we discarded all sites that experienced fewer than 2 substitutions at the internal branches.
We also downloaded the HA and NA crystal structures from the RCSB Protein Data Bank. In computing the linear (sequence) and physical distances between residues we excluded all residues that were not resolved in the crystal structures. We used the distance between the alpha-carbon atoms as a proxy for the physical distance between residues.
Phylogeny reconstruction and substitution mapping
We reconstructed the maximum likelihood phylogenetic trees for HA and NA using PHYML [88] under the GTR substitution model with the four-category discrete approximation of the gamma distribution for the substitution rates. We reconstructed the nucleotide sequences at the internal nodes of the phylogeny using maximum likelihood algorithm in PAUP* 4.0b10 [89]. For each codon site, we identified whether it experienced at least one synonymous and/or non-synonymous substitution on each branch of the reconstructed phylogeny. In those rare cases in which a codon experienced more than one substitution of the same kind (synonymous or non-synonymous) on a branch, we did not record the number of substitutions, in order to simplify computations.
The epistasis test statistic
Consider an ordered pair of sites in the protein of interest. In order to detect a positive epistatic interaction for this pair, we designed a statistic that detects the acceleration of non-synonymous substitutions at site , which we call the trailing site, after the occurrence of a non-synonymous substitution at site , which we call the leading site.
First, we obtained a strict temporal order in which non-synonymous substitutions at sites and occurred on the phylogenetic tree. Such an order is not actually known if the phylogeny contains one or more branches on which both sites have experienced a non-synonymous substitution. We say that such branches are temporally unresolved with respect to the pair . Since we do not know in which order the sites in the pair have experienced substitutions on a temporally unresolved branch, we assume that both orders are equiprobable. If there are branches on the phylogenetic tree that are temporally unresolved with respect to the pair , there are a total of equally likely distinct strict temporal orders of substitutions on the tree with respect to this pair.
Next, for each strict temporal order of substitutions , , at sites and , we find all pairs of substitutions that are consecutive along the tree. Substitution at the trailing site (in this case ) and substitution at the leading site (in this case ) form a consecutive pair if has occurred in the lineage ancestral to and no other substitution at either site has occurred in the lineage between them. This notion is illustrated in Figure 1. If is a consecutive pair, we also say that substitution is consecutive to substitution . For each consecutive pair , substitution is called initial and substitution is called subsequent.
Before defining the epistasis statistic we introduce some notation. We denote the fact that branch is ancestral to branch by (“ precedes ”) or by (“ follows ”); if and denote the same branch, we naturally write . We denote the number of synonymous substitutions that occurred on branch by . We measure time between the initial substitution and the subsequent substitution of a consecutive pair as the expected number of synonymous substitutions that occurred between them. More precisely, if substitutions and occurred on branches and respectively, then(1)
The sum in this expression is taken over all branches on the lineage connecting branches and . Note that can be zero if no synonymous substitutions occurred between substitutions and .
Let denote the set of all consecutive substitution pairs at site pair found on the phylogenetic tree with the order of substitutions . We define the epistasis statistic as(2)where is a time-scale parameter that we specify in the “Results” section. The choice of an exponential function of is arbitrary. We expect that any monotonic decreasing function of would yield similar results. Note that if , i.e. if sites and never experience a non-synonymous substitution on the same branch, the strict temporal order of substitutions with respect to the ordered pair is unique. In this simple case, the epistasis statistic is equivalent to
If we take the time-scale parameter to be infinite, the statistic simply equals the number of consecutive substitutions for the ordered pair . We also define if all sets are empty for the pair . In other words, the epistasis statistic is zero for pairs of sites that never experience consecutive substitutions.
The value of the epistasis statistic is large if substitutions at the trailing site often follow substitutions at the leading site and if the time-lag between initial substitutions at the leading site and subsequent substitutions at the trailing site is typically small (compared to ). We therefore expect that pairs of sites that evolve under positive epistasis will have a larger value of the epistasis statistic.
The non-epistatic null hypothesis
If there were no epistatic interactions between sites and no temporal variation in selection pressures then we would expect the non-synonymous substitutions at each site to be distributed randomly on the phylogenetic tree. In order to obtain the distributions of the epistasis statistic under this null hypothesis for all ordered pairs of sites, we utilize the following straightforward permutation procedure. We shuffle all non-synonymous substitutions on the phylogenetic tree while keeping two sets of marginal quantities preserved: (a) for each branch of the phylogeny, we preserve the number of non-synonymous substitutions that occurred on that branch and (b) for each site, we preserve the total number of non-synonymous substitutions that occurred at that site on the tree. Condition (a) ensures that any possible temporal biases in the sampling of viral isolates, which would apply equally to all sites, are preserved in the null distribution. Condition (b) ensures that the overall selective constraint on each site is preserved. Synonymous substitutions are unaffected by this shuffling procedure.
Although this permutation procedure is conceptually simple, its computational implementation is challenging. A priori, it is unclear how to efficiently sample the space of possible substitution configurations while preserving the aforementioned marginals. This problem can be rephrased as follows. We can represent the phylogenetic tree with non-synonymous substitutions as an matrix, where is the number of branches on the phylogeny and is the number of sites, so that each cell in the matrix is either 1 or 0 depending on whether or not the given site experienced a non-synonymous substitution on the given branch. Thus, we would like to randomly permute the entries of this matrix while preserving the row and column sums. This problem is equivalent to the problem of obtaining the null distribution for the matrix of associations between individuals across a set of observations, which has been extensively studied in the ecology literature [90]–[92]. The method typically employed in ecology to sample the space of matrices that satisfy the constraint on the marginals is called the “swap method” and is based on the idea of swapping the entries of certain specific submatrices in a way that does not violate the constraints. This method, although computationally efficient, generates matrices that are not independent [91]. An alternative “fill method” permutes the matrix entries and simply discards those resulting matrices that do not satisfy the constraints [92]. This method can be prohibitively computationally expensive if many matrices are discarded, but it guarantees independent sampling.
We employed the “fill method” and found that only about between 0.05% and 5% of matrices are accepted, yet this did not present a serious computational limitation. We generated valid permutations per protein, which required about 10 minutes on a desktop computer.
Computing the false discovery rate
We compute the value of the epistasis statistic and its associated nominal for many thousands of site pairs. We therefore need to quantify the fraction of false positives among the observed nominally significant pairs [93]. Because the values of the epistasis statistic for different site pairs are not independent, we estimate the distribution of the number of false positives in the data through bootstrap by designating 400 out of permutations generated by the procedure described above as “fake data sets”. For each such fake data set, which represents one draw from the null hypothesis, we computed the number of nominally significant site pairs. This allowed us to estimate the full distribution of the number of false positives in the data. In particular, we recorded the expected number of false positives in our data, which is typically referred to as “false discovery rate” (FDR), and overall for the total number of positives actually observed.
Simulations without epistasis
To ensure that our method does not detect epistatic interactions when there are none, we have performed detailed simulations of sequence evolution along a phylogenetic tree, with independent sites, as described in [25]. Briefly, the simulation algorithm takes as input a phylogenetic tree with branch lengths equal to the number of nucleotide substitutions and the nucleotide sequence at the root of the tree; it outputs the nucleotide sequences at all internal and terminal nodes. The sequence at a node is generated recursively, given that the sequence at the parental node is already known, using the following stochastic procedure. If the branch length connecting the focal node to the parental node is , then mutations are randomly distributed along the parental sequence proportionally to the entries in the nucleotide mutation matrix and the codon-specific dN/dS values. We used the HA phylogenetic tree to perform this simulation as well as to infer the nucleotide mutation matrix and the codon-specific dN/dS values [25]. Using this simulation algorithm, we generated 100 independent sequence data sets. On each of them, we performed the analysis described above with permutations, 100 of which were considered “fake data sets”.
Supporting Information
Zdroje
1. EarnDJD
DushoffJ
LevinSA
2002 Ecology and evolution of the flu. Trends Ecol Evol 17 334 340
2. BaigentSJ
McCauleyJW
2003 Influenza type A in humans, mammals and birds: Determinants of virus virulence, host-range and interspecies transmission. BioEssays 25 657 671
3. NelsonMI
HolmesEC
2007 The evolution of epidemic influenza. Nat Rev Genet 8 196 205
4. TaubenbergerJK
MorensDM
2008 The pathology of influenza virus infections. Annu Rev Pathol: Mech Dis 3 499 522
5. AriasCF
Escalera-ZamudioM
Soto-Del RíoMD
Cobián-GüemesAG
IsaP
2009 Molecular anatomy of 2009 influenza virus A (H1N1). Arch Med Res 40 643 654
6. DasK
AraminiJM
MaLC
KrugRM
ArnoldE
2010 Structures of influenza A proteins and insights into antiviral drug targets. Nat Struct Mol Biol 17 530 538
7. HolmesEC
GhedinE
MillerN
TaylorJ
BaoY
2005 Whole-genome analysis of human influenza A virus reveals multiple persistent lineages and reassortment among recent H3N2 viruses. PLoS Biol 3 e300 doi:10.1371/journal.pbio.0030300
8. SuzukiY
2006 Natural selection on the influenza virus genome. Mol Biol Evol 23 1902 1911
9. CarratF
FlahaultA
2007 Influenza vaccine: the challenge of antigenic drift. Vaccine 25 6852 6862
10. DuffyS
ShackeltonLA
HolmesEC
2008 Rates of evolutionary change in viruses: patterns and determinants. Nat Rev Genet 9 267 276
11. YangZ
2000 Maximum likelihood estimation on large phylogenies and analysis of adaptive evolution in human influenza virus A. J Mol Evol 51 423 432
12. BushRM
FitchWM
BenderCA
CoxNJ
1999 Positive selection on the H3 hemagglutinin gene of human influenza virus A. Mol Biol Evol 16 1457 1465
13. SmithDJ
LapedesAS
de JongJC
BestebroerTM
RimmelzwaanGF
2004 Mapping the antigenic and genetic evolution of influenza virus. Science 305 371 376
14. SimonsenL
ViboudC
GrenfellBT
DushoffJ
JenningsL
2007 The genesis and spread of reassortment human influenza A/H3N2 viruses conferring adamantane resistance. Mol Biol Evol 24 1811 1820
15. MosconaA
2009 Global transmission of oseltamivir-resistant influenza. New Engl J Med 360 953 956
16. BloomJD
GongLI
BaltimoreD
2010 Permissive secondary mutations enable the evolution of influenza oseltamivir resistance. Science 328 1272 1275
17. WileyDC
WilsonIA
SkehelJJ
1981 Structural identification of the antibody-binding sites of Hong Kong influenza haemagglutinin and their involvement in antigenic variation. Nature 289 373 378
18. LaverWG
AirGM
WebsterRG
MarkoffLJ
1982 Amino acid sequence changes in antigenic variants of type A influenza virus N2 neuraminidase. Virology 122 450 460
19. AirGM
ElsMC
BrownLE
LaverWG
WebsterRG
1985 Location of antigenic sites on the three-dimensional structure of the influenza N2 virus neuraminidase. Virology 145 237 248
20. GulatiU
HwangCC
VenkatramaniL
GulatiS
StraySJ
2002 Antibody epitopes on the neuraminidase of a recent H3N2 influenza virus (A/Memphis/31/98). J Virol 76 12274 12280
21. BushRM
BenderCA
SubbaraoK
CoxNJ
FitchWM
1999 Predicting the evolution of human influenza A. Science 286 1921 1925
22. WolfYI
ViboudC
HolmesEC
KooninEV
LipmanDJ
2006 Long intervals of stasis punctuated by bursts of positive selection in the seasonal evolution of influenza A virus. Biol Direct 1 34
23. BlackburneBP
HayAJ
GoldsteinRA
2008 Changing selective pressure during antigenic changes in human influenza H3. PLoS Pathog 4 e1000058 doi:10.1371/journal.ppat.1000058
24. Kosakovsky PondSL
PoonAF
BrownAJL
FrostSDW
2008 A maximum likelihood method for detecting directional evolution in protein sequences and its application to influenza A virus. Mol Biol Evol 25 1809 1824
25. KryazhimskiyS
BazykinGA
PlotkinJB
DushoffJ
2008 Directionality in the evolution of influenza A haemagglutinin. Proc R Soc B 275 2455 2464
26. WilsonIA
CoxNJ
1990 Structural basis of immune recognition of influenza virus hemagglutinin. Annu Rev Immunol 8 737 771
27. GuoHH
ChoeJ
LoebLA
2004 Protein tolerance to random amino acid change. Proc Natl Acad Sci USA 101 9205 9210
28. BloomJD
ArnoldFH
2009 In the light of directed evolution: Pathways of adaptive protein evolution. Proc Natl Acad Sci USA 106 9995 10000
29. RomeroPA
ArnoldFH
2009 Exploring protein fitness landscapes by directed evolution. Nat Rev Mol Cell Biol 10 866 876
30. RemoldSK
LenskiRE
2004 Pervasive joint influence of epistasis and plasticity on mutational effects in Escherichia coli. Nat Genet 36 423 426
31. SanjuánR
MoyaA
ElenaSF
2004 The contribution of epistasis to the architecture of fitness in an RNA virus. Proc Natl Acad Sci USA 101 15376 15379
32. RimmelzwaanGF
BerkhoffEGM
NieuwkoopNJ
SmithDJ
FouchierRAM
2005 Full restoration of viral fitness by multiple compensatory co-mutations in the nucleoprotein of influenza A virus cytotoxic T-lymphocyte escape mutants. J Gen Virol 86 1801 1805
33. DePristoMA
WeinreichDM
HartlDL
2005 Missense meanderings in sequence space: a biophysical view of protein evolution. Nat Rev Genet 6 678 687
34. SanjuánR
CuevasJM
MoyaA
ElenaSF
2005 Epistasis and the adaptability of an RNA virus. Genetics 170 1001 1008
35. MateoR
MateuMG
2007 Deterministic, compensatory mutational events in the capsid of foot-and-mouth disease virus in response to the introduction of mutations found in viruses from persistent infections. J Virol 81 1879 1887
36. de VisserJAGM
ElenaSF
2007 The evolution of sex: empirical insights into the roles of epistasis and drift. Nat Rev Genet 8 139 149
37. TongAHY
LesageG
BaderGD
DingH
XuH
2004 Global mapping of the yeast genetic interaction network. Science 303 808 813
38. de VisserJAGM
ParkSC
KrugJ
2009 Exploring the effect of sex on empirical fitness landscapes. Am Nat 174 S15 S30
39. MeerMV
KondrashovAS
Artzy-RandrupY
KondrashovFA
2010 Compensatory evolution in mitochondrial tRNAs navigates valleys of low fitness. Nature 464 279 282
40. BlountZD
BorlandCZ
LenskiRE
2008 Historical contingency and the evolution of a key innovation in an experimental population of Escherichia coli. Proc Natl Acad Sci USA 105 7899 7906
41. KryazhimskiyS
TkačikG
PlotkinJB
2009 The dynamics of adaptation on correlated fitness landscapes. Proc Natl Acad Sci 106 18638 18643
42. ShapiroB
RambautA
PybusOG
HolmesEC
2006 A phylogenetic method for detecting positive epistasis in gene sequences and its application to RNA virus evolution. Mol Biol Evol 23 1724 1730
43. WeinreichDM
DelaneyNF
DePristoMA
HartlDL
2006 Darwinian evolution can follow only very few mutational paths to fitter proteins. Science 312 111 114
44. LozovskyER
ChookajornT
BrownKM
ImwongM
ShawPJ
2009 Stepwise acquisition of pyrimethamine resistance in the malaria parasite. Proc Natl Acad Sci USA 106 12025 12030
45. HaqO
LevyRM
MorozovAV
AndrecM
2009 Pairwise and higher-order correlations among drug-resistance mutations in HIV-1 subtype B protease. BMC Bioinform 10 S10
46. TrindadeS
SousaA
XavierKB
DionisioF
FerreiraMG
2009 Positive epistasis drives the acquisition of multidrug resistance. PLoS Genet 5 e1000578 doi:10.1371/journal.pgen.1000578
47. CodoñerFM
FaresMA
2008 Why should we care about molecular coevolution? Evol Bioinform 4 29 38
48. KorberBTM
FarberRM
WolpertDH
LapedesAS
1993 Covariation of mutations in the V3 loop of human immunodeficiency virus type 1 envelope protein: An information theoretic analysis. Proc Natl Acad Sci USA 90 7176 7180
49. AtchleyWR
WollenbergKR
FitchWM
TerhalleW
DressAW
2000 Correlations among amino acid sites in bHLH protein domains: An information theoretic analysis. Mol Biol Evol 17 164 178
50. GloorGB
MartinLC
WahlLM
DunnSD
2005 Mutual information in protein multiple sequence alignments reveals two classes of coevolving positions. Biochemistry 44 7156 7165
51. LocklessSW
RanganathanR
1999 Evolutionarily conserved pathways of energetic connectivity in protein families. Science 286 295 299
52. WollenbergKR
AtchleyWR
2000 Separation of phylogenetic and functional associations in biological sequences by using the parametric bootstrap. Proc Natl Acad Sci USA 97 3288 3291
53. FaresMA
TraversSAA
2006 A novel method for detecting intramolecular coevolution: Adding a further dimension to selective constraints analyses. Genetics 173 9 23
54. WangQ
LeeC
2007 Distinguishing functional amino acid covariation from background linkage disequilibrium in HIV protease and reverse transcriptase. PLoS ONE 2 e814 doi:10.1371/journal.pone.0000814
55. CaporasoJG
SmitS
EastonBC
HunterL
HuttleyGA
2008 Detecting coevolution without phylogenetic trees? Tree-ignorant metrics of coevolution perform as well as tree-aware metrics. BMC Evol Biol 8 327
56. DunnSD
WahlLM
GloorGB
2008 Mutual information without the influence of phylogeny or entropy dramatically improves residue contact prediction. Bioinformatics 24 333 340
57. BusljeCM
SantosJ
DelfinoJM
NielsenM
2009 Correction for phylogeny, small number of observations and data redundancy improves the identification of coevolving amino acid pairs using mutual information. Bioinformatics 25 1125 1131
58. GovindarajanS
NessJE
KimS
MundorffEC
MinshullJ
2003 Systematic variation of amino acid substitutions for stringent assessment of pairwise covariation. J Mol Biol 328 1061 1069
59. PollockDD
TaylorWR
GoldmanN
1999 Coevolving protein residues: Maximum likelihood identification and relationship to structure. J Mol Biol 287 187 198
60. DutheilJ
PupkoT
Jean-MarieA
GaltierN
2005 A model-based approach for detecting coevolving positions in a molecule. Mol Biol Evol 22 1919 1928
61. Fukami-KobayashiK
SchreiberDR
BennerSA
2002 Detecting compensatory covariation signals in protein evolution using reconstructed ancestral sequences. J Mol Biol 319 729 743
62. DimmicMW
HubiszMJ
BustamanteCD
NielsenR
2005 Detecting coevolving amino acid sites using Bayesian mutational mapping. Bioinformatics 21 i126 i135
63. DutheilJ
GaltierN
2007 Detecting groups of coevolving positions in a molecule: a clustering approach. BMC Evol Biol 7 242
64. PoonAFY
LewisFI
Kosakovsky PondSL
FrostSDW
2007 An evolutionary-network model reveals stratified interactions in the V3 loop of the HIV-1 envelope. PLoS Comput Biol 3 e231 doi:10.1371/journal.pcbi.0030231
65. BaussandJ
CarboneA
2009 A combinatorial approach to detect coevolved amino acid networks in protein families of variable divergence. PLoS Comput Bio 5 e1000488 doi:10.1371/journal.pcbi.1000488
66. PoonAFY
SwensonLC
DongWWY
DengW
Kosakovsky PondSL
2010 Phylogenetic analysis of population-based and deep sequencing data to identify coevolving sites in the nef gene of HIV-1. Mol Biol Evol 27 819 832
67. BazykinGA
DushoffJ
LevinSA
KondrashovAS
2006 Bursts of nonsynonymous substitutions in HIV-1 evolution reveal instances of positive selection at conservative protein sites. Proc Natl Acad Sci USA 103 19396 19401
68. YangZ
BielawskiJP
2000 Statistical methods for detecting molecular adaptation. Trends Ecol Evol 15 496 503
69. RussellCA
JonesTC
BarrIG
CoxNJ
GartenRJ
2008 Influenza vaccine strain selection and recent studies on the global migration of seasonal influenza viruses. Vaccine 26S D31 34
70. AokiFY
BoivinG
RobertsN
2007 Influenza virus susceptibility and resistance to oseltamivir. Antiviral Therapy 12 603 616
71. CollinsP
HaireL
LinY
LiuJ
RussellR
2009 Structural basis for oseltamivir resistance of influenza viruses. Vaccine 27 6317 6323
72. Kosakovsky PondSL
FrostSDW
MuseSV
2005 HyPhy: hypothesis testing using phylogenies. Bioinformatics 21 676 679
73. FornasariMS
ParisiG
EchaveJ
2002 Site-specic amino acid replacement matrices from structurally constrained protein evolution simulations. Mol Biol Evol 19 352 356
74. RobinsonDM
JonesDT
KishinoH
GoldmanN
ThorneJL
2003 Protein evolution with dependence among codons due to tertiary structure. Mol Biol Evol 10 1692 1704
75. RodrigueN
LartillotN
BryantD
PhilippeH
2005 Site interdependence attributed to tertiary structure in amino acid sequence evolution. Gene 347 207 217
76. PlotkinJB
DushoffJ
LevinSA
2002 Hemagglutinin sequence clusters and the antigenic evolution of influenza A virus. Proc Natl Acad Sci USA 99 6263 6268
77. LevinSA
DushoffJ
PlotkinJB
2004 Evolution and persistance of influenza A and other viruses. Math Biosci 188 17 28
78. KryazhimskiyS
PlotkinJB
2008 The population genetics of dN/dS. PLoS Genet 4 e1000304 doi:10.1371/journal.pgen.1000304
79. ShortleD
LinB
1985 Genetic analysis of staphylococcal nuclease: identification of three intragenic “global” suppressors of nuclease-minus mutations. Genetics 110 539 555
80. PoteeteAR
RennellD
BouvierSE
HardyLW
1997 Alteration of T4 lysozyme structure by secondsite reversion of deleterious mutations. Prot Sci 6 2418 2425
81. HensleySE
DasSR
BaileyAL
SchmidtLM
HickmanHD
2009 Hemagglutinin receptor binding avidity drives influenza A virus antigenic drift. Science 326 734 736
82. WagnerA
2008 Neutralism and selectionism: a network-based reconciliation. Nat Rev Genet 9 965 974
83. DraghiJA
ParsonsTL
WagnerGP
PlotkinJB
2010 Mutational robustness can facilitate adaptation. Nature 463 353 355
84. KoelleK
CobeyS
GrenfellB
PascualM
2006 Epochal evolution shapes the phylodynamics of interpandemic influenza A (H3N2) in humans. Science 314 1898 1903
85. BaoY
BolotovP
DernovoyD
KiryutinB
ZaslavskyL
2008 The influenza virus resource at the National Center for Biotechnology Information. J Virol 82 596 601
86. ChennaR
SugawaraH
KoikeT
LopezR
GibsonTJ
2003 Multiple sequence alignment with the Clustal series of programs. Nucl Acids Res 31 3497 3500
87. SuyamaM
TorrentsD
BorkP
2006 PAL2NAL: robust conversion of protein sequence alignments into the corresponding codon alignments. Nucl Acids Res 34 W609 W612
88. GuindonS
GascuelO
2003 A simple, fast, and accurate algorithm to estimate large phylogenies by maximum likelihood. Syst Biol 52 696 704
89. SwoffordDL
2003 Phylogenetic Analysis Using Parsimony (*and Other Methods). Version 4. Sunderland, Massachusetts Sinauer Associates
90. ConnorEF
SimberloffD
1979 The assembly of species communities: chance or competition? Ecology 60 1132 1140
91. ManleyBFJ
1995 A note on the analysis of species co-occurrences. Ecology 76 1109 1115
92. SundaresanSR
FischhoffIR
DushoffJ
2009 Avoiding spurious findings of nonrandom social structure in association data. Anim Behav 77 1381 1385
93. SorićB
1989 “Discoveries” and effect-size estimation. J Am Stat Assoc 84 608 610
Štítky
Genetika Reprodukční medicínaČlánek vyšel v časopise
PLOS Genetics
2011 Číslo 2
Nejčtenější v tomto čísle
- Meta-Analysis of Genome-Wide Association Studies in Celiac Disease and Rheumatoid Arthritis Identifies Fourteen Non-HLA Shared Loci
- MiRNA Control of Vegetative Phase Change in Trees
- Risk Alleles for Systemic Lupus Erythematosus in a Large Case-Control Collection and Associations with Clinical Subphenotypes
- The Cardiac Transcription Network Modulated by Gata4, Mef2a, Nkx2.5, Srf, Histone Modifications, and MicroRNAs