
Risk Alleles for Systemic Lupus Erythematosus in a Large Case-Control Collection and Associations with Clinical Subphenotypes
Systemic lupus erythematosus (SLE) is a genetically complex disease with heterogeneous clinical manifestations. Recent studies have greatly expanded the number of established SLE risk alleles, but the distribution of multiple risk alleles in cases versus controls and their relationship to subphenotypes have not been studied. We studied 22 SLE susceptibility polymorphisms with previous genome-wide evidence of association (p<5×10⁻⁸) in 1919 SLE cases from 9 independent Caucasian SLE case series and 4813 independent controls. The mean number of risk alleles in cases was 15.1 (SD 3.1) while the mean in controls was 13.1 (SD 2.8), with trend p = 4×10−128. We defined a genetic risk score (GRS) for SLE as the number of risk alleles with each weighted by the SLE risk odds ratio (OR). The OR for high-low GRS tertiles, adjusted for intra-European ancestry, sex, and parent study, was 4.4 (95% CI 3.8–5.1). We studied associations of individual SNPs and the GRS with clinical manifestations for the cases: age at diagnosis, the 11 American College of Rheumatology classification criteria, and double-stranded DNA antibody (anti-dsDNA) production. Six subphenotypes were significantly associated with the GRS, most notably anti-dsDNA (ORhigh-low = 2.36, p = 9e−9), the immunologic criterion (ORhigh-low = 2.23, p = 3e−7), and age at diagnosis (ORhigh-low = 1.45, p = 0.0060). Finally, we developed a subphenotype-specific GRS (sub-GRS) for each phenotype with more power to detect cumulative genetic associations. The sub-GRS was more strongly associated than any single SNP effect for 5 subphenotypes (the above plus hematologic disorder and oral ulcers), while single loci are more significantly associated with renal disease (HLA-DRB1, OR = 1.37, 95% CI 1.14–1.64) and arthritis (ITGAM, OR = 0.72, 95% CI 0.59–0.88). We did not observe significant associations for other subphenotypes, for individual loci or the sub-GRS. Thus our analysis categorizes SLE subphenotypes into three groups: those having cumulative, single, and no known genetic association with respect to the currently established SLE risk loci.
Published in the journal:
. PLoS Genet 7(2): e32767. doi:10.1371/journal.pgen.1001311
Category:
Research Article
doi:
https://doi.org/10.1371/journal.pgen.1001311
Summary
Systemic lupus erythematosus (SLE) is a genetically complex disease with heterogeneous clinical manifestations. Recent studies have greatly expanded the number of established SLE risk alleles, but the distribution of multiple risk alleles in cases versus controls and their relationship to subphenotypes have not been studied. We studied 22 SLE susceptibility polymorphisms with previous genome-wide evidence of association (p<5×10⁻⁸) in 1919 SLE cases from 9 independent Caucasian SLE case series and 4813 independent controls. The mean number of risk alleles in cases was 15.1 (SD 3.1) while the mean in controls was 13.1 (SD 2.8), with trend p = 4×10−128. We defined a genetic risk score (GRS) for SLE as the number of risk alleles with each weighted by the SLE risk odds ratio (OR). The OR for high-low GRS tertiles, adjusted for intra-European ancestry, sex, and parent study, was 4.4 (95% CI 3.8–5.1). We studied associations of individual SNPs and the GRS with clinical manifestations for the cases: age at diagnosis, the 11 American College of Rheumatology classification criteria, and double-stranded DNA antibody (anti-dsDNA) production. Six subphenotypes were significantly associated with the GRS, most notably anti-dsDNA (ORhigh-low = 2.36, p = 9e−9), the immunologic criterion (ORhigh-low = 2.23, p = 3e−7), and age at diagnosis (ORhigh-low = 1.45, p = 0.0060). Finally, we developed a subphenotype-specific GRS (sub-GRS) for each phenotype with more power to detect cumulative genetic associations. The sub-GRS was more strongly associated than any single SNP effect for 5 subphenotypes (the above plus hematologic disorder and oral ulcers), while single loci are more significantly associated with renal disease (HLA-DRB1, OR = 1.37, 95% CI 1.14–1.64) and arthritis (ITGAM, OR = 0.72, 95% CI 0.59–0.88). We did not observe significant associations for other subphenotypes, for individual loci or the sub-GRS. Thus our analysis categorizes SLE subphenotypes into three groups: those having cumulative, single, and no known genetic association with respect to the currently established SLE risk loci.
Introduction
Systemic lupus erythematosus (SLE) is a debilitating autoimmune disease affecting multiple organ systems and characterized by the production of multiple autoantibodies. It is genetically complex, with an estimated sibling risk ratio s of 8–29 and heritability greater than 66% [1]. It is also an extremely heterogeneous disease, with patients meeting any 4 out of 11 American College of Rheumatology (ACR) criteria – which include such disparate manifestations as renal disease, arthritis, hematologic disorders, and skin manifestations – classified as having SLE. As these disparate manifestations have great impact on the disease course, understanding their specific genetic etiology is of prime importance.
Until 2008, only a handful of genetic loci affecting SLE susceptibility had been identified and reproduced (e.g. HLA-DRB1, FcγR2A, PTPN22, IRF5, STAT4) via candidate-gene studies [2]. The advent of genome-wide single nucleotide polymorphism (SNP) genotyping technology and subsequent recent genome-wide association studies (GWAS) have greatly expanded the number of established SLE risk alleles [3]–[7] to over twenty; most are located in immune-related pathways such as antigen presentation, B - and T-cell receptor signaling, and interferon signaling [2]. Furthermore, few relationships between SLE clinical manifestations and individual risk alleles have been reported, such as the STAT4 gene variant rs7574865 with production of antibodies to double-stranded DNA (anti-dsDNA) and age at diagnosis [8] and the association between anti-dsDNA production and the HLA-DRB1 *1501 (DR2) allele [9].
However, the distribution of multiple risk alleles in affected and unaffected individuals and the relationship of this distribution to clinical manifestations of SLE have not been studied. Recent studies have begun to characterize cumulative associations of multiple risk alleles for other diseases using a variety of techniques [10]–[12]. In this work, twenty-two genetic variants with p<5×10⁻⁸ in recent studies [6] were chosen for a composite genetic risk score (GRS) for SLE. We investigated the risk alleles and GRS with two goals: first to further characterize SLE susceptibility, and then to investigate relationships with SLE subphenotypes – namely the 11 American College of Rheumatology (ACR) classification criteria [13], [14], anti-dsDNA production (a subset of the ACR immunologic criterion), and age at diagnosis. Our access to a large SLE case collection with clinical and genetic data provided an opportunity to analyze the risk alleles and subphenotypes comprehensively, both as individual alleles and with the genetic risk scores.
Results
Case and control cohorts
A total of 1919 SLE cases and 4813 healthy controls obtained from two SLE GWAS (referred to as “parent studies”) were analyzed. Subjects by parent study and source are shown in Table S1. Parent study 1 contained 1295 cases and 3334 controls genotyped on the Illumina 550K panel as part of an SLE GWAS [3] including 1722 controls from iControlDB (Illumina, www.illumina.com). Parent study 2 contained 624 cases and an additional 337 non-overlapping controls genotyped on the Illumina 317K panel as part of a SLEGEN Consortium GWAS [4], with missing 550K SNPs imputed (see Methods). As many controls were removed from parent study 2 due to overlap with parent study 1, we added an additional 1142 healthy controls from the breast cancer study conducted by CGEMS (Cancer Genetics Markers of Susceptibility, cgems.cancer.gov) [15] genotyped on the Illumina 550K to the parent study 2 dataset.
Individual SLE risk alleles
Twenty-two established SLE risk SNPs with reported genome-wide levels of significance (p<5×10⁻⁸) in at least one study are shown in Table 1, along with their adjusted OR for the cohorts studied here. Associations ranged from OR = 1.94 (95% CI 1.75–2.16, p = 9×10⁻³⁴) for the HLA-DR3 tag SNP to OR = 0.92 (95% CI 0.84–1.00, p = 0.055) for BANK1. We also examined all possible 2×2 interactions of the 22 risk alleles in both SLE cases versus controls and in case-only analyses for each subphenotype. No combination was significant using a false discovery rate (FDR) [16] threshold of 5% to account for multiple testing of 222 combinations. For the case-control analysis, the most significant interactions were rs1801274-rs6445975 (FCγR2A -PXK, unadjusted p = 0.0022) and rs2187668-rs10488631 (HLA-DR3-IRF5, adjusted p = 0.0043). In subphenotype associations, the most significant interactions were rs2431099-rs2187668 (PTTG1-HLA-DR3, unadjusted p = 0.0015) for photosensitivity and rs2327832-rs2248932 (TNFAIP3-BLK, unadjusted p = 0.0029) for anti-dsDNA production.

Genetic risk score
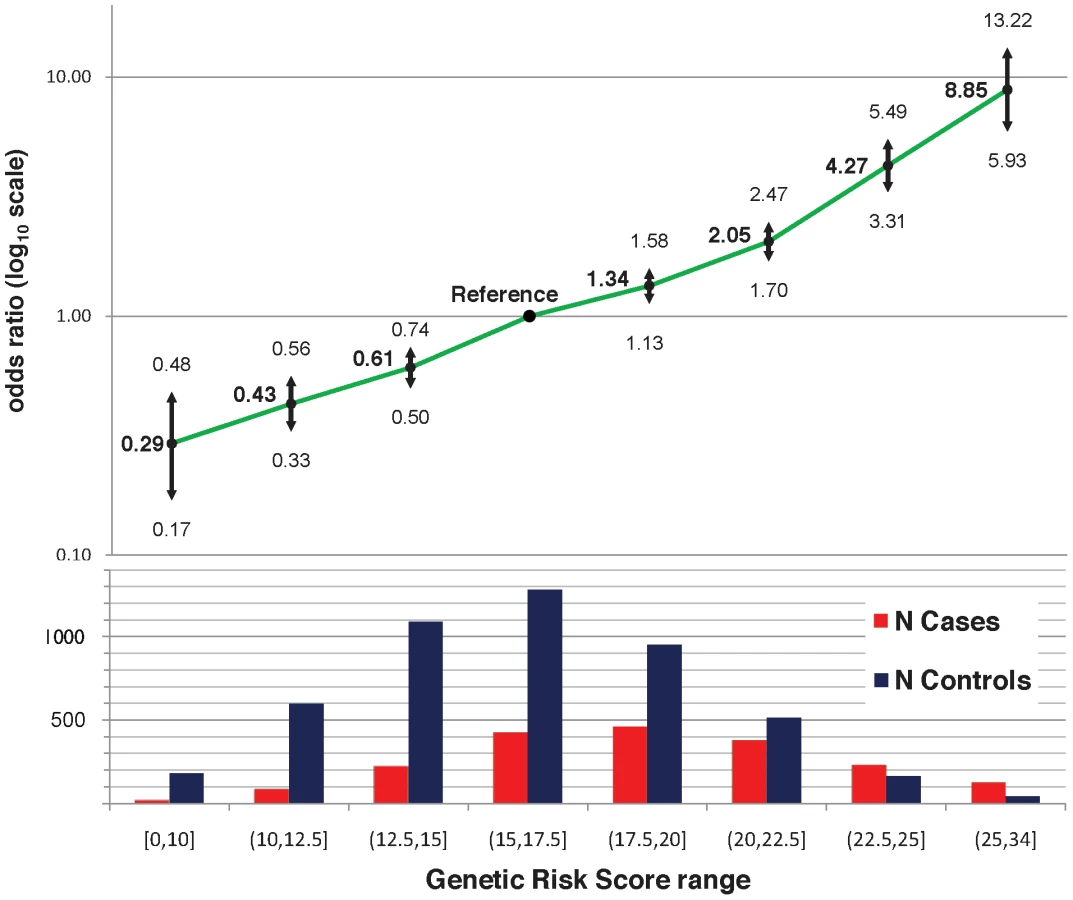
The twenty-two established risk variants were used for two genetic risk measures: a simple count of the number of risk alleles, and a composite genetic risk score (GRS), defined as the summation of SLE risk alleles with each weighted by its SLE odds ratio (OR). Figure 1A shows the distribution of the number of risk alleles in cases versus controls; the mean in cases was 15.1 (SD 3.1) while the mean in controls was 13.1 (SD 2.8), with a trend p = 4×10−128. Figure 1B shows the density of the continuous GRS score, with mean of 18.8 (SD 4.0) in cases and 16.2 (SD 3.6) in controls. The SLE OR, adjusted for intra-European ancestry, sex, and parent study, for high-low GRS tertiles was 4.4 (95% CI 3.8–5.1). Figure 2 shows adjusted ORs for intervals of the GRS compared to a GRS range of 15–17.5. For example, the OR for SLE having GRS>25 versus the reference group was 8.9 (95% CI 5.9–13.2), while the OR for SLE having GRS<10 was 0.29 (95% CI 0.17–0.48).

We used receiver operating characteristic (ROC) curves to compare the GRS versus the number of risk alleles as predictors of SLE. The GRS was a significantly better predictor: the area under the curve (AUC) for the GRS was 68.9% (95% CI 67.5%–70.3%) versus 67.9% (95% CI 66.4%–69.3%) for the number of risk alleles, p = 3×10⁻¹⁴.
Associations with subphenotypes
As expected, many SLE subphenotypes were significantly correlated, shown in Table S2. The strongest is between anti-dsDNA production and the immunologic disorder classification criterion (r = 0.62), as anti-dsDNA is one of many antibodies that fulfill the immunologic criterion. Correlation between anti-dsDNA production and renal disease (r = 0.26) and between malar rash and photosensitivity (r = 0.18) is also observed. Many of the classification criteria have an inverse association with age at diagnosis, with renal disease showing the strongest inverse correlation (r = −0.27).
Individually, several risk alleles were associated with SLE subphenotypes. Table 2 shows those that were significant at an FDR level of 5%. As reported previously [8], the STAT4 SNP rs7574865 was associated with anti-dsDNA antibody production and early age at diagnosis. We also observed associations between the HLA-DR3 tagging allele and anti-dsDNA production (OR = 1.37, 95% CI 1.14–1.65), as well as renal disorder (OR = 1.37, 95% CI 1.14–1.64). In addition, we observed significant associations for anti-dsDNA production with ITGAM (OR = 1.32, 95% CI 1.09–1.59) and UBE2L3 (OR = 1.31, 95% CI 1.09–1.56), arthritis with ITGAM (OR = 0.72, 95% CI 0.59–0.88), and immunologic disorder with KIAA1542 (OR = 0.79, 95% CI 0.68–0.92) and UHRF1BP1 (OR = 1.25, 1.08 = 1.44), with OR<1 indicating protective effects of the minor allele.

Next, we considered associations between subphenotypes and cumulative risk alleles. Six subphenotypes were associated with the number of risk alleles (not shown) and the GRS at p<0.05, as shown in Table 3 for the GRS as a continuous score and as a comparison between the highest and lowest tertiles. For all of these subphenotypes, the GRS was slightly more strongly associated than the number of risk alleles (not shown). The strongest associations were between the continuous GRS and anti-dsDNA production (p = 9×10⁻¹²), immunologic disorder (p = 4×10⁻⁹), and age at diagnosis (continuous, p = 9×10⁻⁷). Corresponding ORs for high-low GRS tertiles, respectively, were ORanti-dsDNA = 2.36 (95% CI 1.76–3.16, p = 9e−9), ORimmunologic = 2.23 (1.64–3.03, p = 3e−7), and ORage = −2.68 (−4.42–0.94, p = 0.0026). For the dichotomized age at diagnosis<34 years, ORage34 = 1.45 (1.11–1.90, p = 0.0060). Figure 1C and 1E shows the distribution of the number of risk alleles in anti-dsDNA positive versus negative SLE subjects and high versus low tertiles of age at diagnosis, respectively. Figure 1D and 1F shows the corresponding density curves for the GRS. We tested these associations both with observations dropped for missing disease duration and on the full dataset using multiple imputation (see Methods) with very similar results (Table S3).

However, since the SLE risk alleles include SNPs which may not be associated with subphenotypes, or may have different effect sizes than for SLE susceptibility, the number of risk alleles and the GRS may be under-powered to detect cumulative associations with subphenotypes. To more fully address the question of which subphenotypes have evidence of association with cumulative SLE risk alleles, we used a discovery-replication approach to develop a subphenotype-specific genetic risk score, sub-GRS, for each subphenotype (see Methods) containing a subset of the SLE risk alleles, weighted by the subphenotype odds ratio in parent study 1. The number of SNPs was chosen to optimize the association with the subphenotype, in contrast to the GRS which contains all SLE risk SNPs regardless of the subphenotype associations. Table 4 shows association results for those sub-GRS that have replication p< 0.1 in parent study 2 and ORs in the same direction. ORs are standardized for comparison since the differing number of SNPs and different weights cause each sub-GRS to be on a different scale. Note that all of these subphenotypes were also significantly associated with the SLE GRS, indicating that we did not miss any cumulative associations when testing the SLE GRS. Note that for renal disease, the sub-GRS contained only a single SNP, showing that the top SNP (tagging the HLA-DR3 allele) was more significant than cumulative effects with additional risk alleles. For arthritis, although ITGAM was associated with arthritis in the joint data (FDR p = 0.038 in Table 2) and the discovery set (unadjusted p = 0.00056), ITGAM and the sub-GRS had p>0.1 in the replication set.

Finally, we considered the predictive capability of the sub-GRS and GRS for associated subphenotypes. We compared ROC curves for four predictive models for each of the six subphenotypes as shown in Table 5. When adding the sub-GRS (model 4) to a model containing only (commonly-available clinical data) disease duration and sex (model 1), the area under the ROC curve was significantly improved (p<0.05) for all of these subphenotypes except renal disease. It was also significantly better than adding only the top single-locus association (model 2). When comparing model 4 to a model containing sex, disease duration, and the SLE GRS, it was only significantly better (p = 0.020) for anti-dsDNA production. Figure 3 shows the ROC curves for these four models for anti-dsDNA production.


Discussion
In a large collection of SLE cases and controls, we investigated the relationship between 22 risk alleles, considered individually and as cumulative genetic risk scores, with SLE susceptibility and specific SLE manifestations. It is important to understand the etiology of SLE subphenotypes, since different subphenotypes of SLE have differential morbidity and mortality, and appear likely to have different underlying etiologies as well. We believe that a more clear understanding of which, if any, genes affect each subphenotype may help lead to a better understanding of SLE disease mechanisms.
We defined a genetic risk score, the GRS, as a summation of SLE risk alleles with each allele unit multiplied by the SLE OR for that allele. This is similar to the weighted “wGRS” defined by Karlson et al [11] for rheumatoid arthritis, except that we use the OR directly rather than its logarithm to be on a scale more similar to the number of risk alleles; the use of 22 risk alleles in both is coincidental. While the number of risk alleles is more intuitive and easier to visualize, the GRS has a wider range and variance and a stronger correlation with SLE susceptibility and subphenotypes. When applied to subphenotypes, the GRS may lose power due to unassociated or improperly weighted SNPs. For this reason we also modeled subphenotype-specific genetic risk scores (sub-GRS) with subsets of SNPs determined using a discovery-replication approach. While the association of these scores in our overall dataset was likely to be inflated since a substantial subset of the data was used to determine the ranking and weighting of the composite SNPs, the odds ratios in our replication set were similar or slightly higher than for the SLE GRS.
It should be noted that many of the SLE risk alleles were discovered using subjects in our study; thus our odds ratios may be an overestimate of the actual odds ratios (“winner's curse”) resulting in over-weighting in the GRS for some SNPs. On the other hand, it is likely that many of these SNPs are not the causal variants but markers in LD. In that case, their effect sizes for SLE susceptibility and/or subphenotype associations would be underestimated, causing the GRS and/or sub-GRS scores to be underweighted and under-associated. Also, in some cases we were not able to use directly-genotyped SNPs at exactly the risk locus previously identified in the literature. Three SNPs were imputed in the SLEGEN dataset (Illumina 317K versus 550K, see Table S1), and for 6 SNPs we used a proxy. Use of proxy and/or imputed SNPs may have given us lower power to detect associations if those SNPs were not as accurate or highly associated; however we believe accuracy was assured by high thresholds for imputation inclusion (see Methods) and proxy SNP selection (r2≥0.8). Also, while multiple signals have been implicated in the TNFAIP3 region [5], [17], we were only able to include one locus with a suitable match in our data. Another potential limitation of the GRS is lack of modeling interactions between SNPs. We tested for all 2×2 interactions between the 22 SNPs in our data with no results being significant after multiple-testing correction; however we may have lacked the statistical power to detect such interactions given our sample size.
Our analyses used HLA-DRB1 tagging SNPs for the DRB1*0301 (DR3) and DRB1*1501 (DR2) alleles rather than direct HLA-DRB1 genotyping data. Our resulting ORs were lower than those in the literature and therefore may underestimate the GRS. We performed sensitivity analyses with a subset of our cases having 4-digit HLA-DRB1 typing (n = 716) and a subset of controls having mixed 2 - and 4-digit typing (n = 1414). Removing ambiguous 2-digit types, there was 98.9% agreement of the DR3 classification (as 0/1/2 alleles) and 98.2% agreement for DR2. We were not able to assess case-control ORs using this data due to the differential typing; however we tested our DR3 associations with anti-dsDNA production and renal subphenotypes, and observed nearly identical ORs and significance compared to the tag SNPs using the same subset of subjects (data not shown).
We have shown that a subset of SLE clinical manifestations – immunological disorder including anti-dsDNA production, renal disease, age at diagnosis, hematologic disorder, and oral ulcers – are strongly associated with the number of risk alleles and the GRS. For most of these, the GRS was much more highly associated than any single locus, with the exception of renal disease and the HLA-DRB1 *0301 (DR3) allele, which is stronger than the GRS signal (and equivalent to the sub-GRS as it had only a single allele). For arthritis, there was no association with the GRS, but there is evidence for a protective effect of the ITGAM locus. For other manifestations, such as malar rash and serositis, there were no significant associations with either the GRS, sub-GRS, or with single loci. This led to our categorization of SLE manifestations into those that are: a) influenced by cumulative effects of multiple known genes, b) influenced primarily by a single gene out of the currently-established risk loci, and c) thus far not appearing to be strongly influenced by genetics (Figure 4). Anti-nuclear antibody production was not included in this characterization as it was present in almost all SLE patients (95.9% of our subjects, Table S4); it is also possible that some associations were not evident due to lack of power for less-frequent manifestations, such as discoid rash and neurologic disorder.

Strengths of this study include the large sample size and availability of clinical data for the SLE cases. Although there are potential issues of differing clinical evaluation at different sites and comprehensive follow-up after DNA collection, we expect the standardized ACR criteria to be highly consistent; furthermore we expect that any misclassification would be random with respect to genotype and therefore bias our results towards the null. One related issue was the large number of cases lacking data for disease duration. In general, we took a conservative approach and did not include observations that did not have disease duration information when disease duration was found to be associated with subphenotypes; for a subset of analyses, we also utilized single and/or multiple imputation on the entire dataset and observed similar results.
A limitation of this and most other recent studies of SLE genetics is that it contains only subjects of European ancestry, and primarily northern European. The GRS was strongly associated with the first principal component of whole-genome SNPs, which reflects ancestry along the northwest-to-southeast European cline. This is likely to be at least somewhat if not largely due to the fact that these risk alleles have been discovered using mostly subjects of northern European ancestry, and additional risk alleles for other populations have yet to be discovered.
While the GRS was very highly associated with SLE susceptibility, the predictive capability was somewhat modest (AUC for ROC curve 68.9%). For subphenotypes associated with the GRS and sub-GRS, these scores significantly improve prediction over disease duration and gender, but the AUC for these subphenotypes is even more modest (56.0%–65.7%). For renal disease, the GRS did not improve prediction over clinical variables. It will be very interesting to see how such measures will be improved as we obtain additional information on SLE risk. In particular we anticipate that new susceptibility loci will be found as non-northern-Europeans are studied in greater detail. We also anticipate that the locations of current risk loci will be determined more precisely with regional fine mapping, re-sequencing, and functional studies.
Methods
Prior to merging, individual datasets were filtered for individuals with<90% genotyping and SNPs with<90% genotyping, minor allele frequency (MAF)<1%, or HWE p-value<0.00001. SNPs in the 550K but not the 317K platform were imputed in the parent study 2 (SLEGEN) dataset using IMPUTE [18], retaining SNPs with >90% confidence, >90% concordance in two test datasets (500 cases and 500 controls from parent study 1 with known genotypes removed), and >90% imputed genotype rate. In the final merged dataset of genotyped and imputed SNPs, SNPs were again filtered for >90% genotyping (using typed or imputed values). From this dataset, SLE risk SNPs or their proxies were obtained. Out of 22 loci selected for inclusion based on p<5×10⁻⁸ in a previous study [6], 16 were directly genotyped in all of our subjects. Three SNPs were imputed in the SLEGEN dataset, and a proxy SNP (r2>0.8) was found for 6 SNPs using the HapMap (http://www.hapmap.org) CEU population (with one overlap, a proxy SNP imputed in the SLEGEN dataset). Imputed and proxy SNPs are shown in Table S5.
Principal components analysis using EIGENSTRAT [19] was performed using the above merged dataset of directly genotyped SNPs, with SNPs having at least 90% genotyping (thus on both the 317K and 550K platforms). SNPs in regions of known high LD (chr 5 : 44–51.5 Mb, chr 6 : 25–33.5 Mb, chr 8 : 8–12 Mb, chr 11 : 45–57 Mb, and chr 17 : 40–43 Mb) were removed prior to analysis. Individuals with values more than 6 standard deviations away from the mean of any of the first 10 PCs (n = 21) were considered genetic outliers and were removed. Four PCs were used for ancestry adjustment, based on leveling off of the PCA scree plot and due to significant differences between cases and controls for the first 4 PCs.
The GRS was defined as the number of risk alleles at each locus multiplied by the OR for SLE susceptibility in our dataset. For example, two STAT4 risk alleles contribute 2*1.5 = 3 to the GRS. For a protective SNP, the risk alleles are the major alleles. Since not counting sporadic missing data would underestimate the number of risk alleles, the GRS, and the sub-GRS, we used best-guess imputed missing genotypes (using IMPUTE version 2) for these calculations. The GRS was analyzed both continuously and by comparing the highest and lowest tertiles to aid in interpretation, with comparison of tertiles being a compromise between more extreme tails of the distribution (having less power) and dichotomizing (having less differentiation).
Subphenotypes and covariates studied are shown in Table S4. In each study, subphenotype status was confirmed by chart review. Autoantibody status was determined by chart review and/or serologic testing; subjects were considered auto-antibody positive if there was any positive test indicated in the reviewed medical records or serologic tests. Negative status required that at least one negative test be documented and no positive tests. Positive anti-dsDNA status is a subset of the immunologic criteria; other qualifiers are anti-Sm antibodies or the presence of anti-phospholipid antibodies. Where appropriate, e.g. logistic regression and bar graphs, the age at diagnosis was dichotomized into high-low halves or split into tertiles. For regression, in addition to the ancestry principal components described above, additional covariates were sex, disease duration, and study (two parent studies or eight sources, see Table S1). All subphenotypes were heterogeneous by study source (data not shown).
We first looked at the adjusted association between each outcome and the continuous GRS (Table S3). As we have a high percentage of missing data for disease duration (18.5%, see Table S4), adjustment was done two ways: a) using only the subset of subjects having disease duration, and b) using multiple imputation of the missing disease duration values. Multiple imputation was performed using Stata ICE [20] with predictive matching. Covariates age at diagnosis, study source, and sex were used in the imputation. Differences in results using these methods were very slight for subphenotypes associated with the GRS. We used actual data without imputation in subsequent GRS analyses. For the sub-GRS computations (below), we used single imputation based on the same variables as above.
In subphenotype associations, the SLE GRS may have less power than a risk score which utilizes the SNPs and effect sizes appropriate for that subphenotype. Thus we also tested a subphenotype-specific sub-GRS for each subphenotype, defined via a discovery-replication approach. First, for each subphenotype we used the associations in parent study 1 (the “discovery” study for this analysis) to determine the rank and OR of each risk SNP association with the subphenotype. Then a series of 22 candidate sub-GRS(n) scores were computed incrementally adding in the OR weights by rank, where n is the number of SNPs included. (The first candidate sub-GRS(1) is equal to the top SNP weights, the second candidate sub-GRS(2) adds in the second SNP weights, and so on). The associations in the discovery set for the resulting sub-GRS(n) candidates are shown in Figure 5; p-values are for the likelihood ratio test of differences between models with the sub-GRS(n) plus covariates versus a model with only covariates. This method can accumulate random associations as well, as illustrated for comparison purposes by sample “null” subphenotypes with 50–50 random associations (highest and lowest associations out of ten samples are shown); hence the importance of a discovery-replication approach. Finally the peak association sub-GRS(n) candidate for the replication and discovery sets with the minimum number of SNPs was used as the final sub-GRS for each subphenotype; this assumes that post-peak SNPs in either set are likely to be false positive associations.

Stata 9.2 [21] was used for regressions and ROC curve analyses. Plink [22] was used for quality control filters, regressions and tests for 2×2 interactions. HelixTree SVS Version 7.2.3 (www.goldenhelix.com) was used for likelihood-ratio tests of logistic regressions of the sub-GRS(n) series. The R programming environment [23] Version 2.11.1 was used for GRS density curves.
Supporting Information
Zdroje
1. HarleyIT
KaufmanKM
LangefeldCD
HarleyJB
KellyJA
2009 Genetic susceptibility to SLE: new insights from fine mapping and genome-wide association studies. Nat Rev Genet 10 285 290
2. GrahamRR
HomG
OrtmannW
BehrensTW
2009 Review of recent genome-wide association scans in lupus. J Intern Med 265 680 688
3. HomG
GrahamRR
ModrekB
TaylorKE
OrtmannW
2008 Association of Systemic Lupus Erythematosus with C8orf13-BLK and ITGAM-ITGAX. N Engl J Med 358 900 909
4. HarleyJB
Alarcon-RiquelmeME
CriswellLA
JacobCO
KimberlyRP
2008 Genome-wide association scan in women with systemic lupus erythematosus identifies susceptibility variants in ITGAM, PXK, KIAA1542 and other loci. Nat Genet 40 204 210
5. GrahamRR
CotsapasC
DaviesL
HackettR
LessardCJ
2008 Genetic variants near TNFAIP3 on 6q23 are associated with systemic lupus erythematosus. Nat Genet 40 1059 1061
6. GatevaV
SandlingJK
HomG
TaylorKE
ChungSA
2009 A large-scale replication study identifies TNIP1, PRDM1, JAZF1, UHRF1BP1 and IL10 as risk loci for systemic lupus erythematosus. Nat Genet 41 1228 1233
7. KozyrevSV
AbelsonAK
WojcikJ
ZaghloolA
Linga ReddyMV
2008 Functional variants in the B-cell gene BANK1 are associated with systemic lupus erythematosus. Nat Genet 40 211 216
8. TaylorKE
RemmersEF
LeeAT
OrtmannWA
PlengeRM
2008 Specificity of the STAT4 genetic association for severe disease manifestations of systemic lupus erythematosus. PLoS Genet 4 e1000084 doi:10.1371/journal.pgen.1000084
9. PodrebaracTA
BoisertDM
GoldsteinR
1998 Clinical correlates, serum autoantibodies and the role of the major histocompatibility complex in French Canadian and non-French Canadian Caucasians with SLE. Lupus 7 183 191
10. ZhengSL
SunJ
WiklundF
SmithS
StattinP
2008 Cumulative association of five genetic variants with prostate cancer. N Engl J Med 358 910 919
11. KarlsonEW
ChibnikLB
KraftP
CuiJ
KeenanBT
2010 Cumulative association of 22 genetic variants with seropositive rheumatoid arthiritis risk. Ann Rheum Dis 69 1077 1085
12. PurcellSM
WrayNR
StoneJL
VisscherPM
O'DonovanMC
2009 Common polygenic variation contributes to risk of schizophrenia and bipolar disorder. Nature 460 748 752
13. TanEM
CohenAS
FriesJF
MasiAT
McShaneDJ
1982 The 1982 revised criteria for the classification of systemic lupus erythematosus. Arthritis Rheum 25 1271 1277
14. HochbergMC
1997 Updating the American College of Rheumatology revised criteria for the classification of systemic lupus erythematosus [letter]. Arthritis Rheum 40 1725
15. HunterDJ
KraftP
JacobsKB
CoxDG
YeagerM
2007 A genome-wide association study identifies alleles in FGFR2 associated with risk of sporadic postmenopausal breast cancer. Nat Genet 39 870 874
16. BenjaminiY
HochbergY
1995 Controlling the false discovery rate - a practical and powerful approach to multiple testing. J R Stat Soc Ser B 57 289 300
17. MusoneSL
TaylorKE
LuTT
NitithamJ
FerreiraRC
2008 Multiple polymorphisms in the TNFAIP3 region are independently associated with systemic lupus erythematosus. Nat Genet 40 1062 1064
18. MarchiniJ
HowieB
MyersS
McVeanG
DonnellyP
2007 A new multipoint method for genome-wide association studies by imputation of genotypes. Nat Genet 39 906 913
19. PriceAL
PattersonNJ
PlengeRM
WeinblattME
ShadickNA
2006 Principal components analysis corrects for stratification in genome-wide association studies. Nat Genet 38 904 909
20. RoystonP
2005 Multiple imputation of missing values: Update of ice. The Stata Journal 5 527 536
21. StataCorp
2006 Stata Statistical Software: Release 9.2. Stata Corporation. College Station, TX StataCorp LP
22. PurcellS
NealeB
Todd-BrownK
ThomasL
FerreiraMAR
2007 PLINK: a toolset for whole-genome association and population-based linkage analysis. American Journal of Human Genetics 81 559 575
23. IhakaR
GentlemanR
1996 R: A Language for Data Analysis and Graphics. Journal of Computational and Graphical Statistics 5 299 314
Štítky
Genetika Reprodukční medicínaČlánek vyšel v časopise
PLOS Genetics
2011 Číslo 2
Nejčtenější v tomto čísle
- Meta-Analysis of Genome-Wide Association Studies in Celiac Disease and Rheumatoid Arthritis Identifies Fourteen Non-HLA Shared Loci
- MiRNA Control of Vegetative Phase Change in Trees
- Risk Alleles for Systemic Lupus Erythematosus in a Large Case-Control Collection and Associations with Clinical Subphenotypes
- The Cardiac Transcription Network Modulated by Gata4, Mef2a, Nkx2.5, Srf, Histone Modifications, and MicroRNAs