
Meta-Analysis of Genome-Wide Association Studies in Celiac Disease and Rheumatoid Arthritis Identifies Fourteen Non-HLA Shared Loci
Epidemiology and candidate gene studies indicate a shared genetic basis for celiac disease (CD) and rheumatoid arthritis (RA), but the extent of this sharing has not been systematically explored. Previous studies demonstrate that 6 of the established non-HLA CD and RA risk loci (out of 26 loci for each disease) are shared between both diseases. We hypothesized that there are additional shared risk alleles and that combining genome-wide association study (GWAS) data from each disease would increase power to identify these shared risk alleles. We performed a meta-analysis of two published GWAS on CD (4,533 cases and 10,750 controls) and RA (5,539 cases and 17,231 controls). After genotyping the top associated SNPs in 2,169 CD cases and 2,255 controls, and 2,845 RA cases and 4,944 controls, 8 additional SNPs demonstrated P<5×10⁻⁸ in a combined analysis of all 50,266 samples, including four SNPs that have not been previously confirmed in either disease: rs10892279 near the DDX6 gene (Pcombined = 1.2×10⁻¹²), rs864537 near CD247 (Pcombined = 2.2×10⁻¹¹), rs2298428 near UBE2L3 (Pcombined = 2.5×10⁻¹⁰), and rs11203203 near UBASH3A (Pcombined = 1.1×10⁻⁸). We also confirmed that 4 gene loci previously established in either CD or RA are associated with the other autoimmune disease at combined P<5×10⁻⁸ (SH2B3, 8q24, STAT4, and TRAF1-C5). From the 14 shared gene loci, 7 SNPs showed a genome-wide significant effect on expression of one or more transcripts in the linkage disequilibrium (LD) block around the SNP. These associations implicate antigen presentation and T-cell activation as a shared mechanism of disease pathogenesis and underscore the utility of cross-disease meta-analysis for identification of genetic risk factors with pleiotropic effects between two clinically distinct diseases.
Published in the journal:
. PLoS Genet 7(2): e32767. doi:10.1371/journal.pgen.1002004
Category:
Research Article
doi:
https://doi.org/10.1371/journal.pgen.1002004
Summary
Epidemiology and candidate gene studies indicate a shared genetic basis for celiac disease (CD) and rheumatoid arthritis (RA), but the extent of this sharing has not been systematically explored. Previous studies demonstrate that 6 of the established non-HLA CD and RA risk loci (out of 26 loci for each disease) are shared between both diseases. We hypothesized that there are additional shared risk alleles and that combining genome-wide association study (GWAS) data from each disease would increase power to identify these shared risk alleles. We performed a meta-analysis of two published GWAS on CD (4,533 cases and 10,750 controls) and RA (5,539 cases and 17,231 controls). After genotyping the top associated SNPs in 2,169 CD cases and 2,255 controls, and 2,845 RA cases and 4,944 controls, 8 additional SNPs demonstrated P<5×10⁻⁸ in a combined analysis of all 50,266 samples, including four SNPs that have not been previously confirmed in either disease: rs10892279 near the DDX6 gene (Pcombined = 1.2×10⁻¹²), rs864537 near CD247 (Pcombined = 2.2×10⁻¹¹), rs2298428 near UBE2L3 (Pcombined = 2.5×10⁻¹⁰), and rs11203203 near UBASH3A (Pcombined = 1.1×10⁻⁸). We also confirmed that 4 gene loci previously established in either CD or RA are associated with the other autoimmune disease at combined P<5×10⁻⁸ (SH2B3, 8q24, STAT4, and TRAF1-C5). From the 14 shared gene loci, 7 SNPs showed a genome-wide significant effect on expression of one or more transcripts in the linkage disequilibrium (LD) block around the SNP. These associations implicate antigen presentation and T-cell activation as a shared mechanism of disease pathogenesis and underscore the utility of cross-disease meta-analysis for identification of genetic risk factors with pleiotropic effects between two clinically distinct diseases.
Introduction
Autoimmune disorders, including rheumatoid arthritis (RA) and celiac disease (CD), affect about 5% of the population and have a complex genetic background. Family-based epidemiology studies suggest that there is a shared genetic basis between the two autoimmune diseases [1]. Recent genome-wide association studies (GWAS) have confirmed HLA and identified at least 26 other non-HLA genetic loci with common alleles associated to each disease (Table S1 and S2) [2], [3]. The strongest genetic risk factor is the HLA locus [2], [3], where different alleles confer risk of the two diseases. Six other risk loci outside of the HLA locus are shared between CD and RA and include MMEL/TNFRSF14 [2], [4], REL [2], [5], [6], ICOS-CTLA4 [2], [3], [5], [7], IL2-IL21 [2], [3], [8], [9], [10], TNFAIP3 [2], [3], [6], [11], and TAGAP [2], [3], [8], (Chen et al, submitted) (Table 1 and Figure 1). These shared risk loci have emerged by simple cross-comparison across published studies, rather than a rigorous and systematic analysis of an integrated dataset. Because of the nature of these reports, it is unknown whether the other CD and RA risk alleles confer risk of both diseases. Moreover, it is unknown whether there are additional shared risk alleles that have not yet been discovered in any one disease.


A major challenge in identifying common alleles of modest effect is the sample size required to have sufficient power to obtain associations at a stringent level of statistical significance. Recent studies of height [12], lipids [13] and body mass index [14] have shown quite convincingly that very large sample sizes – more than 100,000 individuals – yield reproducible SNP associations for common alleles of modest effect size. For diseases such as CD and RA, which are relatively uncommon in the general population (prevalence ∼0.5–1% for each disease), similar sized cohorts are difficult to ascertain. One solution to this problem is to combine two phenotypes to search for pleiotropic risk alleles. So far this approach has only been done for closely related phenotypes, such as the Crohn's disease and ulcerative colitis (together known as inflammatory bowel disease (IBD)) [15], or for medical traits that are known risk factors for disease (e.g., lipids and coronary artery disease, obesity and type 2 diabetes) [13], [16].
Another challenge is how to interpret statistical significance of SNP associations in combined analysis of two clinically distinct phenotypes. In a GWAS of common variants for a single phenotype, most consider P<5×10⁻⁸ as statistically significant, as any SNP at random from the genome has the same probability of being associated with the phenotype and there are approximately 1 million uncorrelated common SNPs in the human genome [17]. However, this P-value threshold does not take into consideration that (a) many common SNPs, not just a single SNP, are associated with disease, and (b) the pleiotropy of risk alleles for related diseases should, in theory, increase the prior probability that an allele is a true-positive. In the case of autoimmunity, alleles often contribute to risk of more than one autoimmune disease [18]. Accordingly, a SNP with a confirmed association in one autoimmune disease has a higher prior probability of being associated with another autoimmune disease. This principle has been used to declare that SNPs are confirmed disease associations, if the SNP does not reach a stringent level of significance (e.g., P<5×10⁻⁸) in the other autoimmune disease [7], [19]. Nonetheless, there are no formal criteria for assigning increased prior probabilities for SNPs across autoimmune diseases.
In the current study, we hypothesized that there are additional alleles that influence risk of both CD and RA in a pleiotropic manner. To increase power to detect these alleles, we combined two previously published GWAS of each disease, followed by replication in both CD and RA. We use our GWAS data to arrive at an empirical threshold for declaring SNPs as shared risk alleles for the two diseases. In doing so, we identified fourteen shared CD-RA risk alleles, which point to T-cell receptor signaling as a key shared pathway of disease pathogenesis.
Results
Comparing known risk alleles across diseases
We first aimed to investigate the status of established CD and RA loci across these two diseases using genotype data from published GWAS datasets of CD (4,533 cases, 10,750 controls) [2] and RA (5,539 autoantibody positive RA cases and 17,231 controls) [3] (See Materials and Methods for description of both cohorts). We considered only those reported loci with at least one risk allele associated at P<5×10⁻⁸ with confirmation in independent samples. There are 26 non-HLA loci from each disease that satisfy this stringent criterion, representing 46 distinct risk loci (Tables S1 and S2). We investigated the association of the 26 non-HLA CD SNPs in RA, and the 26 non-HLA RA SNPs in CD. Figure 1A and 1B show the OR and 95% CI of the 52 SNPs and the association statistics within the two diseases. Of the 26 CD SNPs, 11 are associated with risk of RA at P<0.05 (Table S1). Similarly, from 26 RA SNPs, 9 are associated with risk of CD at P<0.05 (Table S2). After excluding the six loci established in both diseases, this distribution remains non-random (P<2×10⁻⁴, Fisher's test), indicating additional sharing of risk loci between the two diseases.
Comparing distribution of putative risk alleles across diseases
To provide additional evidence that there are shared risk alleles, we analyzed the distribution of moderately associated SNPs from the GWAS datasets (i.e., putative risk alleles) across the two autoimmune diseases. We investigated whether the subset of SNPs associated with CD at P<0.001 in the CD-GWAS are randomly distributed in the RA GWAS results, and vice-versa. After removing the established CD and RA risk loci, we performed association analysis on a set of independent SNPs for each disease. In CD, 70,520 SNPs remained after pruning SNPs in linkage disequilibrium (LD) (see Materials and Methods for details), of which 342 were associated with CD at P<0.001. In RA, 70,812 SNPs remained after LD-pruning, of which 282 were associated with RA at P<0.001. Using Fisher's test, we observed a non-random distribution of association with CD in the subset of P<0.001 RA GWAS SNPs, as well as a non-random distribution of association with RA in the subset of P<0.001 CD GWAS SNPs (P<5×10⁻⁵ for both diseases; see Figure 2 and Table S3A). Similar results were obtained when we used the Wilcoxon rank sum and Kolmogorov-Smirnov tests to analyze the distributions of SNP associations across diseases (Table S3B). From this analysis, we conclude that a SNP associated with risk of CD at P<0.001 has an increased prior probability of being associated with RA, and a SNP associated with risk of RA at P<0.001 has an increased prior probability of being associated with CD.

GWAS and replication—same allele, same direction
While the analyses described above indicate that additional shared risk alleles remain to be discovered, these analyses do not identify which specific SNPs influence risk of both disease. To identify new shared risk alleles, we performed an inverse variance weighted meta-analysis [20] in which we assumed that the same allele confers risk of both diseases. A total of 472,854 SNPs outside the HLA (Chr6 : 20–40 MB) overlapped between the two GWAS datasets and were included in the meta-analysis. We did not exclude the established CD and RA loci outside of the HLA region from the meta-analysis, as we considered the possibility that there may be novel risk alleles within these loci. The Q-Q plot of CD+RA meta-anlaysis P-values (Pcombined) shows an enrichment of non-HLA associated SNPs in the tail of the distribution (Figure 3A), with no evidence for systematic bias across all SNPs (λGC = 1.011). A similar result was obtained after excluding known associated loci for both diseases (Figure 3A). The Manhattan plot indicates loci where significance increased in the combined cohort (Figure S1).

Sixty-five SNPs from 21 distinct genomic regions were associated with both CD and RA in the combined analysis with Pcombined<1×10⁻⁵, and with disease-specific P<0.01 (Tables S4 and S5). Of these 21 loci, five are established in both diseases (TNFAIP3, CTLA4/ICOS, IL2/IL21, REL and MMEL1/TNFRSF14); five are established CD loci (SH2B3, PTPN2, 8q24.2, SOCS1, ICOSLG); and four are established RA loci (ANKRD55, STAT4, TRAF1/C5 and PRKCQ). The remaining 7 have not been previously confirmed in either disease (Table 2, Table S5).
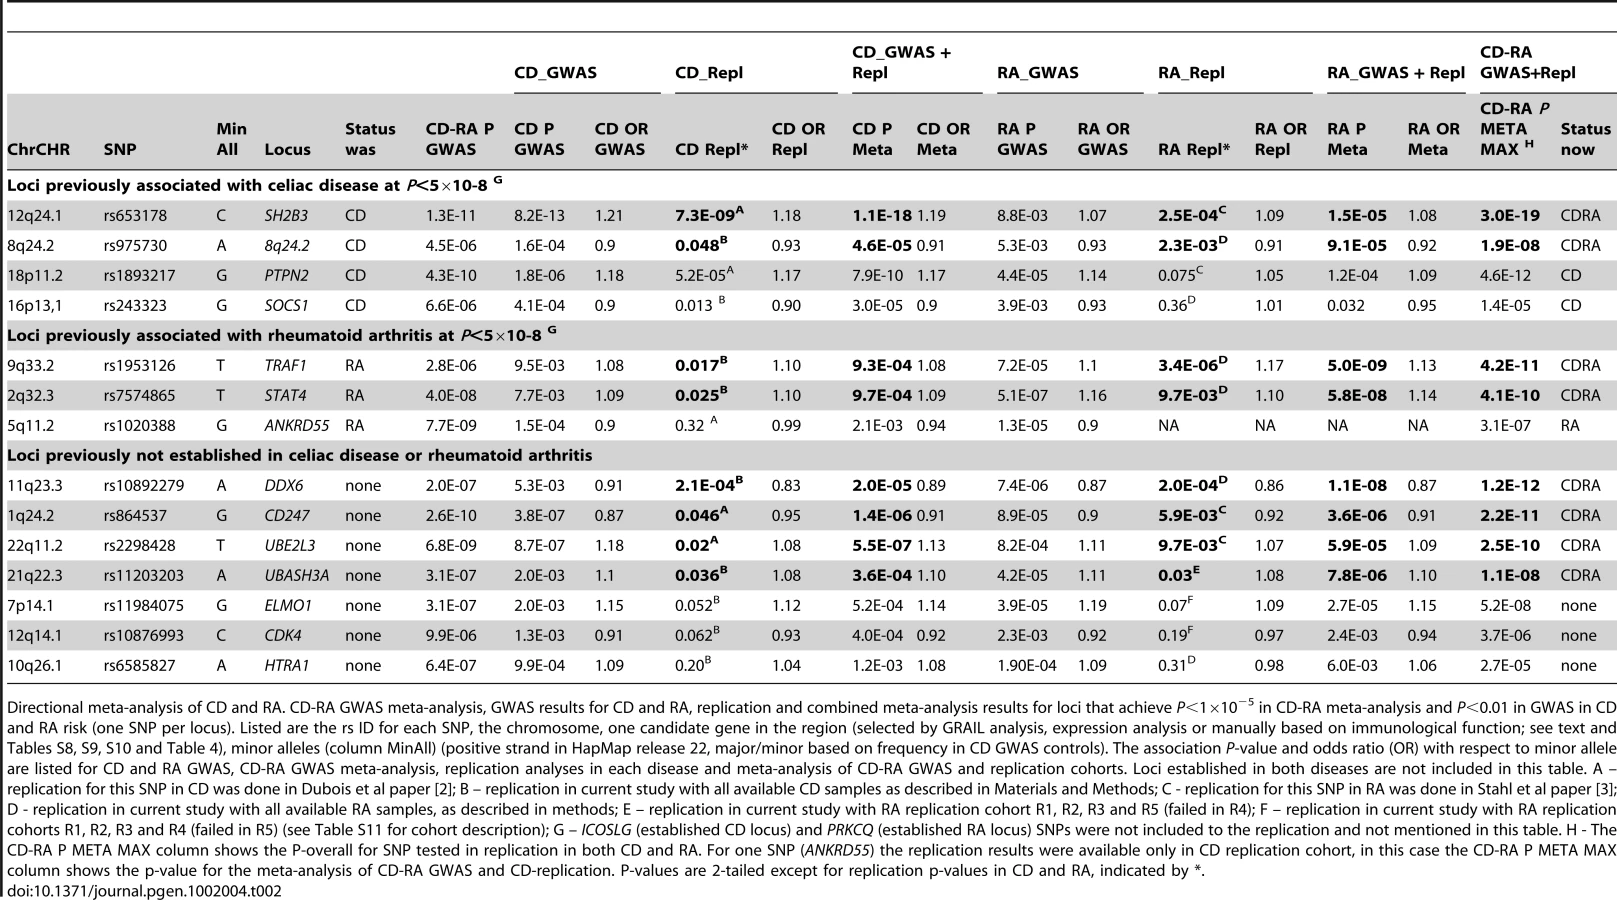
To determine which of these loci are associated with both diseases – particularly those 7 loci not previously implicated in either disease and 9 loci established as risk alleles in either CD or RA alone – we selected from each of these 16 loci one most associated SNP for replication in additional 2,169 CD cases and 2,255 controls, and 2,845 autoantibody positive RA cases and 4,944 controls (see Materials and Methods for sample information). Five out of 16 SNPs were previously genotyped in samples that overlapped with our replication samples [2], [3], and are included here for completeness. Two SNPs – rs7283760 in the CD-established ICOSLG locus and rs2181622 in the RA-established PRKCQ locus – were not genotyped in the replication samples for technical reasons. We did not attempt replication of SNPs from the five established loci associated with risk of both CD and RA. We conducted association tests of the 14 SNPs in the replication and combined cohorts with inverse variance weighted meta-analysis, where we analyzed CD-only samples [replication (PCD-repl) and GWAS+replication (PCD)], RA-only samples [replication (PRA-repl) and GWAS+replication (PRA)], and RA+CD samples [all GWAS+replication samples together (Poverall)].
As shown in Table 2, of the 4 established CD risk SNPs, two replicated in the RA samples with PRA-repl<0.05 and obtained PRA<0.001 in all available RA case-control samples (SH2B3 (12q24.1) and an intergenic region on 8q24.2, PRA = 1.5×10⁻⁵ and 9.1×10⁻⁵ respectively). Similarly, of the 3 established RA risk SNPs tested in our study, two replicated in the CD samples with PCD-rep<0.05 and obtained PCD<0.001 in all available CD case-control samples (STAT4 (2q32.3) and TRAF1-C5 (9q33.2), PCD = 9.7×10⁻⁴ and 9.3×10⁻⁴ respectively). All four of these SNPs have Poverall<5×10⁻⁸ in analysis of all 50,266 CD and RA samples.
Of the 7 SNPs not previously established as genome-wide significant in either CD or RA, four were significantly replicated in both diseases at PCD-repl<0.05 and PRA-repl<0.05, were associated to each disease with PCD<0.001 and PRA<0.001 and achieved Poverall<5×10⁻⁸ in the combined CD-RA cohort (CD247 (1q24.2), UBE2L3 (22q11.2), DDX6 (11q23.3) and UBASH3A (21q22.3); see Table 2). The strongest signal in the combined analysis was observed from the DDX6 locus (rs10892279, Poverall = 1.2×10⁻¹²). This SNP achieved genome-wide significance PRA = 1.1×10⁻⁸ in the RA cohort alone, and PCD = 2.0×10⁻⁵ in the CD cohort. SNPs near CD247 and UBE2L3 were previously suggestively associated in both CD and RA [2], [3]. The replication data presented here, together with the combined analysis of Poverall<5×10⁻⁸, demonstrate that these SNPs are indeed true positive associations for CD and RA. Of note, SNPs in the UBE2L3 are also associated with risk of systemic lupus erythematosus [21] and Crohn's disease [22], and the CD247 locus is associated with systemic sclerosis [23].
GWAS and replication—same allele, opposite direction
There is increasing evidence that alleles conferring risk of one autoimmune disease confer protection to another autoimmune disease [3], [7], [8], [24], [25], [26]. We therefore performed an analysis of alleles that conferred risk in either CD or RA, but protection in the other disease (Figure 3B), followed by independent testing in our replication cohort. Nine loci were identified using the same criteria as above (Pcombined<1×10⁻⁵, and disease-specific P<0.01; see Tables S6 and S7). The strongest shared signal from this analysis was at the TAGAP locus (6q25.3, rs212388 Pcombined = 5.4×10⁻¹²), an established risk locus in both CD and RA [2], [3], [8] (Chen, et al, submitted). Another locus that had an apparent opposite allelic effect was REL (2p16.1), although it shows a more complex pattern of association. From the three SNPs in the REL locus that were associated to both diseases with Pcombined<1×10⁻⁵, and disease-specific P<0.01, two SNPs showed similar direction of association with CD and RA, whereas one SNP showed opposite directionality of association (Tables S4 and Table S6). Of the remaining SNPs, no single SNP replicated in both diseases at P<0.05 and achieved P<5×10⁻⁸ in an overall analysis of all data. We observed a trend of an association at the chromosome 2p23.1 (near the LBH gene) locus (rs7579944, PCD = 9.7×10⁻⁶ and PRA = 2.3×10⁻⁴ in the CD and RA cohorts, respectively; Poverall = 1.1×10⁻⁸ in the combined analysis, but no formal replication in RA cohort (PRA-repl = 0.13)) (Table 3). Although these data strongly suggest that chromosome 2p23.1 is a shared CD-RA risk locus, additional replication will be required.

Selecting most likely causal gene near associated SNP
We used two methods to identify the most likely causal gene in the region of the 14 shared non-HLA risk loci. First, we used a computational algorithm, GRAIL, which systematically searches for gene relationships across risk loci using PubMed abstracts [27]. In total, 14 shared loci contain 51 genes; 16 of these scored P<0.1 by GRAIL (Table S8). Second, we analyzed each shared SNP for evidence of cis-acting gene expression in peripheral blood cells derived from 1,469 individuals (Fehrmann et al, submitted). From 14 shared SNPs, 7 showed a significant (genome-wide FDR corrected <0.05) effect on expression of one or more transcripts in the LD block around the SNP (Table S9, Figure S2A-S2P). It is interesting to note that of the four novel SNP associations identified from this study, three show convincing effects on the expression of nearby genes, in particular rs864537-CD247 (P = 3.5×10⁻¹¹), rs2298428-UBE2L3 (P = 2.0×10−99) and rs11203203-UBASH3A (P = 8.7×10⁻¹⁰) (Table S9, Figure S2). Based on these two methods, 23 genes located in the 14 shared loci were selected as plausible candidates for shared CD-RA pathogenesis (Table 4 and Table S10).

Discussion
In this study we demonstrate that there are 14 loci that contribute to risk of both RA and CD: 6 previously established risk loci and 8 loci identified in our study. Of the 8 new loci, 4 had not been associated previously with either disease at genome-wide significance (CD247, UBE2L3, DDX6, and UBASH3A) and 4 had been established in one but not the other autoimmune disease (SH2B3, 8q24.2, STAT4, and TRAF1-C5). Our study represents the first systematic effort to compare the genetic basis of CD and RA in a very large sample set – more than 50,000 combined case-control samples – to identify risk alleles with pleiotropic effects on two clinically distinct autoimmune diseases.
To identify the shared risk loci, we performed two types of analyses. First, we compared the distribution of established and putative risk alleles across both autoimmune diseases. Both distributions were non-random, providing empirical evidence that the genetic basis of the two autoimmune diseases overlaps. Second, we combined GWAS data and performed independent replication to search for specific SNPs associated with both diseases. We performed the GWAS meta-analysis under a genetic model in which the same allele conferred risk of both autoimmune diseases, as well as a model in which the same allele conferred risk to one disease and protection from the other disease. Of the newly identified 8 shared risk alleles, all 8 confer same risk direction on both CD and RA.
Our study represents one of the first GWAS meta-analysis of clinically distinct but epidemiologically related diseases. This approach has appeal for diseases in which there is thought to be a shared genetic basis, as it adds power to detect alleles of modest effect size. A GWAS meta-analysis has been conducted on early onset inflammatory bowel disease (IBD), which include Crohn's disease (CrD) and ulcerative colitis (UC) [15]. CrD and UC are clinically similar diseases both affecting bowel, and often can not be distinguished between each other (presented as undifferentiated IBD), especially in children. In contrast to the IBD study, our GWAS meta-analysis combined phenotypes with different clinical presentations (enteropathy and inflammatory arthritis).
In combining GWAS data across clinically distinct phenotypes, an important question is how to interpret statistical significance and therefore how to declare a SNP as a confirmed association for each disease. In our study, we empirically demonstrated that SNPs associated with risk of either CD or RA have a higher probability of being associated with the other autoimmune – even if the SNP is not yet a confirmed association in either disease (Figure 2). We observed that a SNP associated with risk of CD at P<0.001 has an increased prior probability of being associated with RA, and a SNP associated with risk of RA at P<0.001 has an increased prior probability of being associated with CD. Based upon these analyses, we propose objective criteria for declaring a SNP as a shared CD – RA risk SNP in our study: it must achieve Poverall<5×10⁻⁸ in combined analysis of CD&RA, with the additional requirement of P<0.05 in an independent replication dataset and P<0.001 for each disease. Applying these criteria to our meta-analysis results we conclude that there are 14 non-HLA shared CD and RA risk loci (Table 1 and Table 2).
We applied two methods to select the most likely causal gene in the region of the 14 shared non-HLA risk loci, and in doing so gain insight into shared RA-CD pathogenesis: (1) a computational algorithm, GRAIL, which systematically searches for gene relationships across risk loci using PubMed abstracts [27] and (2) a dataset of cis-acting gene expression in peripheral blood cells derived from 1,469 individuals [27] (Fehrmann et al, submitted). Using these methods we prioritized 23 genes located in the 14 shared loci as plausible functional candidates. Interestingly, two out of four novel loci function in T-cell activation/signalling: CD247, which encodes for the zeta chain of the T-cell receptor-CD3 complex, and UBASH3A, which is a suppressor of T-cell receptor signaling, underscoring antigen presentation to T-cells as a critical shared mechanism of disease pathogenesis [28], [29]. This observation is consistent with the known functions of several of the other shared RA-CD risk loci which were highlighted in GRAIL and expression analysis (CTLA4, ICOS, TAGAP, SH2B3, and STAT4). These genes are known to modulate T-cell activation and/or differentiation: CTLA4 is a negative regulator of T-cell activation [30], ICOS is a T-cell co-stimulator molecule [31], TAGAP is up-regulated upon T-cell activation[32], SH2B3 (LNK) is an adaptor protein involved in T-cell activation [33], and STAT4 is transcription factor important in differentiation of T helper cells [34].
How might these 14 loci influence risk of two clinically distinct autoimmune diseases? MHC class II alleles, the strongest risk factor in both diseases, are notably different between the two diseases: HLA-DQ*A1 and *B1 alleles in CD and HLA-DRB1 “shared epitope” alleles in RA. Under a model in which MHC class II molecules confer risk by preferentially presenting disease-specific antigens (gluten in CD, most likely citrullinated antigens in RA) to autoreactive T-cells, then disease specificity is determined in large part by the inheritance of specific HLA alleles and exposure to disease-specific antigens. Our genetic data extends this model to implicate downstream signaling events common to both diseases that may lead to altered T-cell activation and differentiation. Whether abnormal T-cell signaling occurs in the thymus (where autoreactive T-cells undergo negative selection), in the peripheral circulation (where autoreactive T-cells exert their effects), or in another manner remains to be determined.
There are several limitations of our study. First, we did not search for loci in which an allele contributes to risk of one autoimmune disease and an independent allele contributes to risk of the other autoimmune disease. The REL locus provides an example in which the risk alleles for the two autoimmune diseases appear distinct [2], [5], [6]. Second, our study is underpowered to detect shared risk alleles of more modest effect size, despite a combined sample size of >50,000 case-control samples. As more samples and SNPs are genotyped between these diseases, additional risk alleles will be discovered. Third, we did not attempt to fine-map the 26 established risk loci for both autoimmune diseases to determine if a single allele is responsible for risk in both autoimmune diseases. And fourth, we made no attempt to search for low-frequency or rare variants that are shared between RA and CD. Implementation of newer sequencing technologies will be required to search for rare risk variants.
In summary, our study adds four novel loci to established RA and CD risk loci (CD247, UBE2L3, DDX6, and UBASH3A). It also adds four loci previously established in one or the other disease to the list of shared CD-RA risk loci (SH2B3, 8q24.2, STAT4, and TRAF1-C5). With six previously established CD-RA risk loci, there are now 14 shared CD-RA risk loci, out of 50 established loci for either of the two autoimmune diseases. We emphasize that these are conservative estimates of shared risk loci between the two diseases, as our study may be underpowered to detect common alleles of modest effect size, and we have not considered genetic models in which different alleles within one locus contribute to risk of the two diseases. In addition to the HLA associations, these shared risk loci clearly point to the critical role of antigen presentation via MHC class II molecules to the T-cell receptor, and subsequent activation and differentiation of T-cells in shared disease pathogenesis.
Materials and Methods
Ethics statement
Institutional review boards at each collection site approved the study, and all individuals gave their informed consent.
Sample collection
CD GWAS dataset
CD case-control GWA study included 15,283 individuals (4533 cases, 10750 controls) from 5 populations: Finnish (FIN) (674 cases, 647 controls), Italian (IT) (541 cases, 497 controls), Dutch (NL, 876 cases, 803 controls), and two collections from UK population, UK1 (737 cases, 2596 controls) and UK3 (1922 cases, 1849 controls) (described in details in[2]).The genotyping of all cohorts except UK1 cases was done on Illumina platforms including 550K SNPs (either Illumina Hap550, or Illumina 610 or 670 Quad, or Illumina 1.2 M). The genotyping of UK1 cases (n = 737) was done on Illumina 317K arrays. The subset of SNPs successfully genotyped on Illumina 550 and Quadr platforms, but not on Hap300 platform (n = 196860) was further imputed in the UK1 dataset, using Plink and HapMap Phase 2 European CEU founders as a reference panel [35].
RA GWAS dataset
The RA meta-analysis includes 5,539 autoantibody positive RA cases and 17,231 controls of European ancestry as described previously [3]. This study comprises six GWAS case-control collections, genotyped on various platforms. The imputation was conducted on GWAS genotype data for each GWAS collection separately, using the IMPUTE software [36] and haplotype-phased HapMap Phase 2 European CEU founders as a reference panel. In total, 2.56 million SNPs were imputed. Identity by state (IBS) analysis was run on controls from both CD and RA GWAS datasets. The overlapping controls genotyped in both CD and RA datasets were excluded from the RA analysis.
Replication cohorts
The replication cohorts included 2,169 CD cases and 2,255 controls, and 2,845 antibody-positive RA cases and 4,944 controls. The CD replication cohorts included three case-control collections from Ireland, Italy and Poland; all collections were geographically matched and are described previously [2]. The five RA replication collections included (1) CCP or RF positive Dutch cases from Groningen and Nijmegen, together with geographically matched controls (Replication cohort 1, R1); (2) CCP positive white individuals from North America (Replication cohort 2, R2; this collection is called i2b2); (3) North American RF positive cases and controls matched on gender, age, and grandparental country of origin from the Genomics Collaborative Initiative (GCI, Replication cohort 3, R3); (4) CCP or RF positive Dutch cases and controls from Leiden University Medical Center (LUMC; Replication cohort 4, R4); and (5) CCP positive cases drawn from North American clinics and controls from the New York Cancer Project (together this collection is called NARAC-II), matched on ancestry informative markers data (Replication cohort 5, R5). All cohorts except i2b2 were described in detail in [3], whereas i2b2 is described in [37]. Summary information on these samples is presented in Table S11.
Genotyping
Replication analysis of 15 SNPs was performed on the Sequenom iPlex platform in three centers – (1) Broad institute (all CD cases and controls, and RA replication cohorts R1 and R2); (2) Celera Diagnostics (Alameda California, USA; RA replication cohort R3 and R4); and (3) National Institute of Arthritis and Musculoskeletal and Skin Diseases (NIAMS, RA replication cohort R5). (See Table S11 for details). If the SNPs could not be designed into the iPLEX pool, then a proxy SNP was included. Information on the iPLEX design, proxies and cohorts genotyped in different centers is presented in Tables S11 and S12. We excluded SNPs in each replication collection if they were missing >10% genotype data, <1% MAF and PHWE<10−3. For 5 out of the 20 SNPs that satisfied the replication criteria in either the directional or opposite allelic effect analysis, replication results were already available for CD and RA samples from the studies Dubois et al [2] and Stahl et al[3], respectively. For these 5 SNPs, we included genotype data from all replication samples available in these studies.
Data analysis
GWAS meta-analysis
The meta-analysis of CD and RA datasets was performed using an inverse variance-weighted method. Analysis was performed in R package as described previously. [20], [38] To detect associations of the same and opposite directions, two tests were performed. First, the directional meta-analysis was done; second, the direction of association was flipped in RA dataset and an opposite-allelic effect analysis was performed. In total, 477,662 SNPs either directly genotyped on the Illumina Hap550 platform, or genotyped on Hap300 and imputed in UK1 cases were included in the analysis; all SNPs overlapped with genotype or imputed SNPs from the RA dataset. In both diseases the genomic control corrected results were used for the meta-analysis.
Replication analysis
Replication and combined analyses were done with an inverse variance-weighted method. Combined (GWAS + replication) analysis within one disease (CD or RA) was done with a directional method. Replication association tests were one-tailed, for the same allele being risk or protective as in the GWAS meta-analysis. Combined analysis of all CD and RA samples was done for the same (directional or opposite) allelic effect as was estimated in GWAS meta-analysis.
Distribution of risk alleles in GWAS
For the analysis of distribution of risk alleles, we excluded SNPs located within 1 MB around each of the most associated SNPs (26 in each disease); for the MHC and PTPN22 loci, we excluded 20 Mb and 2 Mb, respectively (chr. 6 : 20–40 Mb and chr. 1 : 113–115 Mb). The pruning of SNPs in linkage disequilibrium (LD) was done by selecting SNPs to retain and then removing all SNPs with r2>0.1 in the HapMap2 reference panel. Pairwise LD tables were generated from the HapMap2 release 24 phased haplotype data distributed with the IMPUTE software; r2 values were calculated for all SNPs within 1 Mb of each other. For a given analysis, the most strongly associated SNPs (after removing 1 Mb around known associated SNPs) in one disease were retained. We also filtered for SNPs with P<0.001. The resulting LD-pruned SNP sets were then tested for non-random distributions of association in the other disease. Fisher's rule for combining P-values () (−2 ∑ln(P) ∼χ22n) was used to test the null hypothesis of a uniform distribution of P-values for association with a given disease. Kolmogorov-Smirnov and Wilcoxon rank sum tests were performed to test for overall difference and difference in location, respectively, of the distributions of P-values in a given disease, for SNPs with P<0.001 versus P≥0.001 in the other disease. One-sided tests were conducted, with the alternative hypothesis that SNPs associated with one disease would also show evidence of association with the other.
Gene expression
The analysis of gene expression was done on PBMC of 1,469 individuals, as previously described [2]. In this dataset, we included SNPs with genotyping call-rate ≥95%, Hardy-Weinberg P-value ≥0.001, and MAF ≥5%. Expression data was quantile normalized, centered to the mean and scaled such that all probes had a standard deviation of 1. Principal component analysis was performed over the sample correlation matrix, in order to capture non-genetic variation. The variation described within the first 50 principal components was subsequently subtracted from the expression data as described by Fehrmann et al (Fehrmann et al, submitted). Effects were deemed cis-effects, when the mid-probe to SNP distance was ≤250 kb. False discovery rate was controlled at 5%, by comparing observed p-values with p-values obtained after permuting sample labels 100 times. The Fehrmann et al manuscript specifically investigated whether SNPs in the Illumina probe sets might explain the eQTL results: eQTL associated SNPs were checked for LD with SNPs from 1000 genomes pilot data located within probe sequences. Specifically for our study, we verified that none of the eQTL associated SNPs was in high LD (r2>0.1) with any of the 1000 genome SNPs located within Illumina probe sequences.
Supporting Information
Zdroje
1. HemminkiKLiXSundquistKSundquistJ 2009 Shared familial aggregation of susceptibility to autoimmune diseases. Arthritis Rheum 60 2845 2847
2. DuboisPCTrynkaGFrankeLHuntKARomanosJ Multiple common variants for celiac disease influencing immune gene expression. Nat Genet 42 295 302
3. StahlEARaychaudhuriSRemmersEFXieGEyreS Genome-wide association study meta-analysis identifies seven new rheumatoid arthritis risk loci. Nat Genet 42 508 514
4. RaychaudhuriSThomsonBPRemmersEFEyreSHinksA 2009 Genetic variants at CD28, PRDM1 and CD2/CD58 are associated with rheumatoid arthritis risk. Nat Genet 41 1313 1318
5. GregersenPKAmosCILeeATLuYRemmersEF 2009 REL, encoding a member of the NF-kappaB family of transcription factors, is a newly defined risk locus for rheumatoid arthritis. Nat Genet 41 820 823
6. TrynkaGZhernakovaARomanosJFrankeLHuntK 2009 Coeliac disease associated risk variants in TNFAIP3 and REL implicate altered NF-{kappa}B signalling. Gut
7. SmythDJPlagnolVWalkerNMCooperJDDownesK 2008 Shared and distinct genetic variants in type 1 diabetes and celiac disease. N Engl J Med 359 2767 2777
8. HuntKAZhernakovaATurnerGHeapGAFrankeL 2008 Newly identified genetic risk variants for celiac disease related to the immune response. Nat Genet 40 395 402
9. van HeelDAFrankeLHuntKAGwilliamRZhernakovaA 2007 A genome-wide association study for celiac disease identifies risk variants in the region harboring IL2 and IL21. Nat Genet 39 827 829
10. ZhernakovaAAlizadehBZBevovaMvan LeeuwenMACoenenMJ 2007 Novel association in chromosome 4q27 region with rheumatoid arthritis and confirmation of type 1 diabetes point to a general risk locus for autoimmune diseases. Am J Hum Genet 81 1284 1288
11. PlengeRMCotsapasCDaviesLPriceALde BakkerPI 2007 Two independent alleles at 6q23 associated with risk of rheumatoid arthritis. Nat Genet 39 1477 1482
12. Lango AllenHEstradaKLettreGBerndtSIWeedonMN 2010 Hundreds of variants clustered in genomic loci and biological pathways affect human height. Nature 467 832 838
13. TeslovichTMMusunuruKSmithAVEdmondsonACStylianouIM 2010 Biological, clinical and population relevance of 95 loci for blood lipids. Nature 466 707 713
14. SpeliotesEKWillerCJBerndtSIMondaKLThorleifssonG 2010 Association analyses of 249,796 individuals reveal 18 new loci associated with body mass index. Nat Genet
15. ImielinskiMBaldassanoRNGriffithsARussellRKAnneseV 2009 Common variants at five new loci associated with early-onset inflammatory bowel disease. Nat Genet 41 1335 1340
16. 2007 Genome-wide association study of 14,000 cases of seven common diseases and 3,000 shared controls. Nature 447 661 678
17. PearsonTAManolioTA 2008 How to interpret a genome-wide association study. JAMA 299 1335 1344
18. ZhernakovaAvan DiemenCCWijmengaC 2009 Detecting shared pathogenesis from the shared genetics of immune-related diseases. Nat Rev Genet 10 43 55
19. CoenenMJTrynkaGHeskampSFrankeBvan DiemenCC 2009 Common and different genetic background for rheumatoid arthritis and coeliac disease. Hum Mol Genet 18 4195 4203
20. de BakkerPIFerreiraMAJiaXNealeBMRaychaudhuriS 2008 Practical aspects of imputation-driven meta-analysis of genome-wide association studies. Hum Mol Genet 17 R122 128
21. HanJWZhengHFCuiYSunLDYeDQ 2009 Genome-wide association study in a Chinese Han population identifies nine new susceptibility loci for systemic lupus erythematosus. Nat Genet 41 1234 1237
22. FransenKVisschedijkMCvan SommerenSFuJYFrankeL 2010 Analysis of SNPs with an effect on gene expression identifies UBE2L3 and BCL3 as potential new risk genes for Crohn's disease. Hum Mol Genet 19 3482 3488
23. RadstakeTRGorlovaORuedaBMartinJEAlizadehBZ 2010 Genome-wide association study of systemic sclerosis identifies CD247 as a new susceptibility locus. Nat Genet 42 426 429
24. BarrettJCHansoulSNicolaeDLChoJHDuerrRH 2008 Genome-wide association defines more than 30 distinct susceptibility loci for Crohn's disease. Nat Genet 40 955 962
25. BegovichABCarltonVEHonigbergLASchrodiSJChokkalingamAP 2004 A missense single-nucleotide polymorphism in a gene encoding a protein tyrosine phosphatase (PTPN22) is associated with rheumatoid arthritis. Am J Hum Genet 75 330 337
26. BottiniNMusumeciLAlonsoARahmouniSNikaK 2004 A functional variant of lymphoid tyrosine phosphatase is associated with type I diabetes. Nat Genet 36 337 338
27. RaychaudhuriSPlengeRMRossinEJNgACPurcellSM 2009 Identifying relationships among genomic disease regions: predicting genes at pathogenic SNP associations and rare deletions. PLoS Genet 5 e1000534 doi:10.1371/journal.pgen.1000534
28. CallMEWucherpfennigKW 2004 Molecular mechanisms for the assembly of the T cell receptor-CD3 complex. Mol Immunol 40 1295 1305
29. TsygankovAY 2008 Multidomain STS/TULA proteins are novel cellular regulators. IUBMB Life 60 224 231
30. EgenJGKuhnsMSAllisonJP 2002 CTLA-4: new insights into its biological function and use in tumor immunotherapy. Nat Immunol 3 611 618
31. HutloffADittrichAMBeierKCEljaschewitschBKraftR 1999 ICOS is an inducible T-cell co-stimulator structurally and functionally related to CD28. Nature 397 263 266
32. MaoMBieryMCKobayashiSVWardTSchimmackG 2004 T lymphocyte activation gene identification by coregulated expression on DNA microarrays. Genomics 83 989 999
33. LiYHeXSchembri-KingJJakesSHayashiJ 2000 Cloning and characterization of human Lnk, an adaptor protein with pleckstrin homology and Src homology 2 domains that can inhibit T cell activation. J Immunol 164 5199 5206
34. YaoBBNiuPSurowyCSFaltynekCR 1999 Direct interaction of STAT4 with the IL-12 receptor. Arch Biochem Biophys 368 147 155
35. PurcellSNealeBTodd-BrownKThomasLFerreiraMA 2007 PLINK: a tool set for whole-genome association and population-based linkage analyses. Am J Hum Genet 81 559 575
36. MarchiniJHowieBMyersSMcVeanGDonnellyP 2007 A new multipoint method for genome-wide association studies by imputation of genotypes. Nat Genet 39 906 913
37. EyreSHinksABowesJFlynnEMartinP 2010 Overlapping genetic susceptibility variants between three autoimmune disorders: rheumatoid arthritis, type 1 diabetes and coeliac disease. Arthritis Res Ther 12 R175
38. AulchenkoYSRipkeSIsaacsAvan DuijnCM 2007 GenABEL: an R library for genome-wide association analysis. Bioinformatics 23 1294 1296
39. BartonAThomsonWKeXEyreSHinksA 2008 Rheumatoid arthritis susceptibility loci at chromosomes 10p15, 12q13 and 22q13. Nat Genet 40 1156 1159
40. PlengeRMSeielstadMPadyukovLLeeATRemmersEF 2007 TRAF1-C5 as a risk locus for rheumatoid arthritis–a genomewide study. N Engl J Med 357 1199 1209
41. RaychaudhuriSRemmersEFLeeATHackettRGuiducciC 2008 Common variants at CD40 and other loci confer risk of rheumatoid arthritis. Nat Genet 40 1216 1223
42. RemmersEFPlengeRMLeeATGrahamRRHomG 2007 STAT4 and the risk of rheumatoid arthritis and systemic lupus erythematosus. N Engl J Med 357 977 986
43. PlantDFlynnEMbarekHDieudePCornelisF 2010 Investigation of potential non-HLA rheumatoid arthritis susceptibility loci in a European cohort increases the evidence for nine markers. Ann Rheum Dis 69 1548 1553
Štítky
Genetika Reprodukční medicínaČlánek vyšel v časopise
PLOS Genetics
2011 Číslo 2
Nejčtenější v tomto čísle
- Meta-Analysis of Genome-Wide Association Studies in Celiac Disease and Rheumatoid Arthritis Identifies Fourteen Non-HLA Shared Loci
- MiRNA Control of Vegetative Phase Change in Trees
- Risk Alleles for Systemic Lupus Erythematosus in a Large Case-Control Collection and Associations with Clinical Subphenotypes
- The Cardiac Transcription Network Modulated by Gata4, Mef2a, Nkx2.5, Srf, Histone Modifications, and MicroRNAs