
and Genes Modulate the Switch between Attraction and Repulsion during Behavioral Phase Change in the Migratory Locust
Behavioral plasticity is the most striking trait in locust phase transition. However, the genetic basis for behavioral plasticity in locusts is largely unknown. To unravel the molecular mechanisms underlying the behavioral phase change in the migratory locust Locusta migratoria, the gene expression patterns over the time courses of solitarization and gregarization were compared by oligonucleotide microarray analysis. Data analysis revealed that several gene categories relevant to peripheral olfactory perception are strongly regulated in a total of 1,444 differentially expressed genes during both time courses. Among these candidate genes, several CSP (chemosensory protein) genes and one takeout gene, LmigTO1, showed higher expression in gregarious and solitarious locusts, respectively, and displayed opposite expression trends during solitarization and gregarization. qRT-PCR experiments revealed that most CSP members and LmigTO1 exhibited antenna-rich expressions. RNA interference combined with olfactory behavioral experiments confirmed that the CSP gene family and one takeout gene, LmigTO1, are involved in the shift from repulsion to attraction between individuals during gregarization and in the reverse transition during solitarization. These findings suggest that the response to locust-emitted olfactory cues regulated by CSP and takeout genes is involved in the behavioral phase change in the migratory locust and provide a previously undescribed molecular mechanism linked to the formation of locust aggregations.
Published in the journal:
. PLoS Genet 7(2): e32767. doi:10.1371/journal.pgen.1001291
Category:
Research Article
doi:
https://doi.org/10.1371/journal.pgen.1001291
Summary
Behavioral plasticity is the most striking trait in locust phase transition. However, the genetic basis for behavioral plasticity in locusts is largely unknown. To unravel the molecular mechanisms underlying the behavioral phase change in the migratory locust Locusta migratoria, the gene expression patterns over the time courses of solitarization and gregarization were compared by oligonucleotide microarray analysis. Data analysis revealed that several gene categories relevant to peripheral olfactory perception are strongly regulated in a total of 1,444 differentially expressed genes during both time courses. Among these candidate genes, several CSP (chemosensory protein) genes and one takeout gene, LmigTO1, showed higher expression in gregarious and solitarious locusts, respectively, and displayed opposite expression trends during solitarization and gregarization. qRT-PCR experiments revealed that most CSP members and LmigTO1 exhibited antenna-rich expressions. RNA interference combined with olfactory behavioral experiments confirmed that the CSP gene family and one takeout gene, LmigTO1, are involved in the shift from repulsion to attraction between individuals during gregarization and in the reverse transition during solitarization. These findings suggest that the response to locust-emitted olfactory cues regulated by CSP and takeout genes is involved in the behavioral phase change in the migratory locust and provide a previously undescribed molecular mechanism linked to the formation of locust aggregations.
Introduction
Aggregation of animals is a common phenomenon that can be found in herds, shoals, flocks, schools and swarms of various species [1]. During aggregating, many species exhibit behavioral plasticity as an adaptive response to environmental changes [2]. Recently, several genes associated with behavioral plasticity have been identified, such as Cyp6a20 gene in fruit flies [3], foraging gene in honey bees [4], and Zenk gene in zebra finches [5], but the temporal dynamics of the interactions between genetic and environmental factors on behavioral plasticity are still largely unknown.
The migratory locust, Locusta migratoria, is a worldwide agricultural pest, which exhibits severe plagues during which they migrate in marching juvenile bands and adult migratory swarms [6]. In response to the population density changes, they exhibit extreme phenotypic plasticity between the quiet, cryptically colored “solitarious” phase and the swarm-forming, conspicuously colored “gregarious” phase. Of all phase-related characteristics, behavioral changes are the most significant traits involved in the swarm formation in all locust species, particularly the changes in activity levels and in responses to other individuals [7]. Although the phase transition theory was originally established in the migratory locust by Uvarov [8], the best characterized model is the desert locust, Schistocerca gregaria. It is revealed that the behavioral gregarization in the desert locust can be triggered by a combination of sensory inputs from head (visual and olfactory) or by the mechanosensory stimulation of hind legs [9], [10]. These cues, which are stimulated by social environmental factors, are integrated by the nervous system to initiate behavioral phase change [11].
Recent genomic approaches have significantly improved our understanding in the phenotypic plasticity of the migratory locust. The application of large-scale expressed sequence tags (ESTs) revealed that 532 genes show different expression levels between the two phases of the migratory locust [12], [13]. Several hsp genes display higher expression levels in gregarious locusts and are regulated during phase change [14]. The two extreme phases exhibit different transcriptomic profiles of small RNAs, among which longer small RNAs, possibly piRNAs, are more abundant in the solitarious phase of the migratory locust [15]. As important sources of small RNA, transposable elements also show different expression patterns between the two phases, especially in central nervous and peripheral olfactory tissues [16]. However, to further understand the molecular mechanism of phase change, it is required to address the relationship between gene expression and behavioral changes, especially the time window when sensory cues and crowding trigger the behavioral transition.
In this study, we developed a large-scale oligonucleotide microarray in the migratory locust and investigated the genome-wide expression profiles in heads of fourth-instar nymphs during the time courses of behavioral solitarization and gregarization. A binary logistic regression model was used to quantify the state of behavioral phase and the time course of behavioral phase change [17]. Furthermore, we used RNAi approach to explore the roles of candidate genes in phase-related behavior. The data from genome-wide expression profiling, the knockdown of olfactory-related genes and behavioral assays revealed the importance of olfactory-related genes, several CSPs and one takeout, in the fundamental phase-related behaviors of the migratory locust.
Results
The time course of behavioral phase change
Based on the data collected from 86 gregarious and 69 solitarious fourth-instar migratory locust nymphs, we built a binary logistic model that can accurately categorize 87.2% of gregarious nymphs and 87.0% of solitarious nymphs, to summarize the behavioral phase state as a single probabilistic metric of gregariousness—Pgreg. The model retained three variables: attraction index, total distance moved and total duration of movement (Table 1). Using this model, we investigated the behavioral phase changes of fourth-instar nymphs during the time courses of solitarization (Isolation of gregarious locusts, IG) and gregarization (Crowding of solitarious locusts, CS). Gregarious nymphs showed significant behavioral solitarization after IG for only 1 h, which was in strong contrast to gregarious controls (Mann-Whitney U = 240, p = 0.001. Figure 1A). Full behavioral solitarization was acquired after IG for 16 h, exhibiting no significant difference with solitarious controls (Mann-Whitney U = 366.5, p = 0.110). However, solitarious nymphs did not display significant behavioral changes in gregarization until CS for 32 h as compared with solitarious controls (Mann-Whitney U = 261, p = 0.002. Figure 1B). Full behavioral gregarization was not acquired even after CS for 64 h as compared with gregarious controls (Mann-Whitney U = 115, p = 0.000).


In addition, we also examined the time course of three behavioral variables that were significant predictors of phase-related behavior as revealed by logistic regression analysis. During the IG process, attraction index declined rapidly in 1 h to a stable level, but not to the level of solitarious controls even after IG for 64 h (Mann-Whitney U = 336, p = 0.037. Figure S1A). However, total distance moved and total duration of movement decreased to the level of solitarious controls in 4 h (Mann-Whitney U = 446, 375, p = 0.632, 0.092. Figure S1B and S1C). During the CS process, these three behavioral variables did not increase until 32 h (Mann-Whitney U = 318, 249, 292, p = 0.021, 0.001, 0.004. Figure S1D, S1E, S1F), but were far below the level of gregarious controls (Mann-Whitney U = 319, 220, 239, p = 0.035, 0.0004, 0.001, respectively). After CS for 64 h, only attraction index increased to the level of gregarious controls (Mann-Whitney U = 387.5, p = 0.359. Figure S1D).
Gene expression profiling during the time course of phase change
To investigate the global gene expression patterns related to behavioral phase change, we performed comparative gene expression profiling in heads of gregarious and solitarious nymphs that underwent population density changes. During the time courses of IG and CS, 794 and 1103 genes, respectively, were differentially regulated (Table S1, Dataset S1), and they fell into a diversity of ontological categories (Figure S2) and pathways (Table S2). The number of differentially expressed genes exhibited a wave-like pattern during the IG process, with the highest level at 16 h. The number of differentially expressed genes increased along with the time course of CS, with the highest level at 32 h (Figure 2A). Further hierarchical cluster analysis for all differentially expressed genes revealed fluctuating patterns for most genes during the IG process, but a relatively stable trend during the CS process (Figure S3).

Enrichment analysis of differentially expressed genes showed that insect cuticle proteins, insect pheromone-binding family A10/OS-D, odorant binding proteins and arthropod hemocyanin/insect LSPs were the top four enriched InterPro categories in both time courses (Table 2). The BLAST and phylogenetic analysis revealed that insect pheromone-binding proteins and odorant binding proteins represented two gene families, chemosensory proteins (CSPs) and takeout proteins, respectively (Figures S4, S5, S6, Table S3). We further clustered 453 mutually differentially expressed genes during IG and CS processes into eight categories from A to H (Figure 2B, Dataset S1). Of these categories, A and H clusters showed consistent gene expression patterns during the time course of treatments while negative correlation of expression trends (Pearson correlation, r = −0.896, p<0.0001). In these two categories, CSP and takeout genes represented the largest numbers—25% of the 40 annotated genes. Microarray results of 12 selected genes, including CSP and takeout, were validated by qRT-PCR (Table S4). Therefore, we hypothesized that CSP and takeout genes play important roles in behavioral phase changes.

Tissue-specific and time course expression of CSP and takeout genes
To reveal the potential involvement of CSP and takeout genes in the locust behaviors, in both gregarious and solitarious nymphs, we investigated the tissue-specific expression of representative CSP and takeout genes (Figure 3A, Figure S7) that showed consistent expression patterns in qRT-PCR and microarray analysis, including LmigCSP1, LmigCSP2, LmigCSP3, LmigCSP4 and LmigTO1 (Table S4). As shown by Figure 3A, CSP and takeout genes were highly expressed in peripheral tissues (antenna, labial palp, wing and hind leg) with abundant sensilla, but not in internal tissues (brain and fat body). Among all these tissues, the highest RNA expression levels of CSP and takeout genes were detected in antennal tissues, except for LmigCSP1 that exhibited the highest expression in wing and hind leg tissues. Only LmigCSP3 and LmigTO1 showed significantly different expression levels in antennal tissues between gregarious and solitarious nymphs. Relative expression level of LmigCSP3 RNA was higher in gregarious nymphs (Student's t-test, t = 8.893, p = 0.001. Figure 3A Left), while LmigTO1 exhibited higher expression levels in solitarious nymphs (Student's t-test, t = 3.670, p = 0.021. Figure 3A Right). Between gregarious and solitarious nymphs, LmigCSP3 and LmigTO1 were also differentially expressed in hind leg (Student's t-test, t = 5.479, p = 0.003) and labial palp (Student's t-test, t = 5.812, p = 0.004), respectively; however, the RNA relative expression levels in these tissues were relatively low. Significantly different expression levels of three other CSP family members were mainly detected in wing and hind leg (Figure S7).
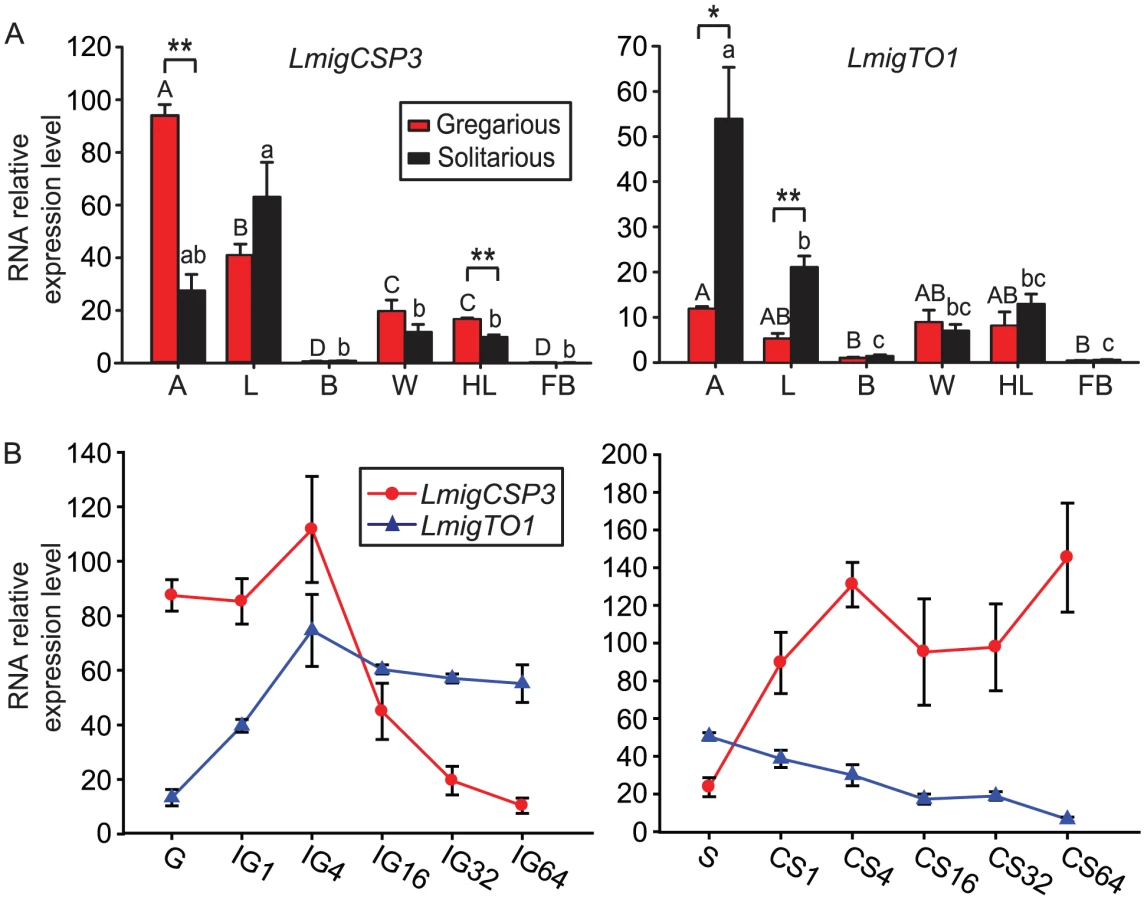
We further investigated the expression patterns of these five genes in antennal tissues during the time courses of IG and CS (Figure 3B, Figure S8). As shown by Figure 3B, the overall expression of LmigCSP3 and LmigTO1 exhibited an opposite pattern in the two time courses. During the IG process, RNA relative expression levels of LmigCSP3 increased slightly at 4 h, and then rapidly decreased until 64 h (ANOVA, F5,18 = 15.266, p<0.0001). RNA relative expression levels of LmigTO1 increased significantly from 1 h to 4 h, and then stayed at a stable level (ANOVA, F5,18 = 11.154, p<0.0001). During the CS process, RNA relative expression levels of LmigCSP3 increased significantly at 4 h (ANOVA, F5,18 = 4.151, p = 0.020). In contrast, RNA relative expression levels of LmigTO1 decreased until 64 h (ANOVA, F5,18 = 22.091, p<0.0001). Three other CSP gene family members showed similar expression patterns as LmigCSP3 (Figure S8).
Functional investigation of LmigCSP3 and LmigTO1
To explore the physiological significance of CSP and takeout genes, RNAi and behavioral analysis were performed to identify their in vivo functions. RNAi experiments focused on LmigCSP3 and LmigTO1, which exhibited antenna-rich expression and substantial expression difference between gregarious and solitarious nymphs. In comparison with non-injected controls (non-inj), RNA relative expression levels of LmigCSP3 and LmigTO1 decreased significantly after injection of double-stranded LmigCSP3 (dsLmigCSP3), LmigTO1 (dsLmigTO1) and LmigCSP3&LmigTO1 (simultaneous injection of dsLmigCSP3 and dsLmigTO1), but no change was detected in double-stranded GFP-injected controls (Figure 4A and 4B). This silencing effect of dsLmigCSP3 and dsLmigTO1 was also observed in several other tissues, such as antenna, labial palp and hind leg (Figure S9). The expression of five other CSP genes, LmigCSP1, LmigCSP2, LmigCSP4, LmigCSP5 and LmigCSP6, were significantly suppressed by dsLmigCSP3 injection (Figure 4C) due to the high sequence similarity among CSP family members (Figure S10). However, the RNA relative expression levels of another two takeout family members, LmigTO2 and LmigTO3, were barely affected by dsLmigTO1 injection (Figure S11). Interactions of silencing effects between LmigCSP3 and LmigTO1 were not detected (Figure S12).

Behavioral assay revealed that attraction/repulsion behaviors of fourth-instar nymphs were influenced by dsLmigCSP3 or dsLmigTO1 injection (Figure 5). In comparison to the non-injected controls, the attraction index significantly decreased when gregarious nymphs were injected with dsLmigCSP3 (Mann-Whitney U = 545, p<0.0001) and dsLmigCSP3&TO1 (Mann-Whitney U = 387.5, p<0.0001), but no behavioral changes were detected upon dsGFP or dsLmigTO1 injection (Mann-Whitney U = 1442.5, 1177.5, p = 0.926, 0.915, respectively. Figure 5A). The change extent of attraction index induced by the dsLmigCSP3&TO1 injection was less than that induced by the injection of dsLmigCSP3 in gregarious locusts (Mann-Whitney U = 587, p = 0.013). Solitarious nymphs injected with dsLmigTO1 and dsLmigCSP3&TO1 exhibited a significant increase in the attraction index as compared with non-injected controls (Mann-Whitney U = 985.5, 567.5, p = 0.001, 0.019, respectively), but no behavioral changes were observed upon dsGFP or dsLmigCSP3 injection (Mann-Whitney U = 1519.5, 770.5, p = 0.900, 0.895, respectively. Figure 5D). The dsLmigTO1-injected solitarious nymphs spent significantly less time in the opposite end of test arena (away from the stimulus group) and tended to stay in the middle area of arena compared to non-injected and dsGFP-injected nymphs. However, we did not detect the influence of dsLmigCSP3, dsLmigTO1 or dsLmigCSP3&TO1 injection on the total distance moved (Figure 5B and 5E) and total duration of movement (Figure 5C and 5F) in nymphs of both phases.

To investigate whether the behavioral effects of LmigCSP3 and LmigTO1 RNAi were correlated with olfactory perception, a Y-tube olfactometer was used to examine the behavioral response to either volatiles of gregarious nymphs or a clean air control (Figure S14B). More gregarious nymphs chose the volatile arm (Chi square = 10.373, p = 0.001. Figure 6A) and more solitarious nymphs chose the air control arm (Chi square = 12.500, p<0.0001. Figure 6B). After dsLmigCSP3 injection, gregarious nymphs tended to choose the air control arm (Chi square = 6.480, p = 0.011) and significantly decreased their preference to volatiles as compared with non-injected controls (Mann-Whitney U = 758, p = 0.000), but no behavioral changes were detected upon dsGFP or dsLmigTO1 injection (Mann-Whitney U = 1282, 1175.5, p = 0.712, 0.831, respectively. Figure 6A). After dsLmigTO1 injection, solitarious nymphs randomly chose the volatile or air control arm (Chi square = 0.032, p = 0.857), and significantly decreased their behavioral aversion to volatiles as compared with non-injected controls (Mann-Whitney U = 333, p = 0.007); no behavioral changes were detected upon dsGFP or dsLmigCSP3 injection (Mann-Whitney U = 502, 445, p = 0.458, 0.342, respectively. Figure 6B).

Discussion
We have demonstrated here that the migratory locust, Locusta migratoria, can alter the phase-related behaviors in response to population density changes, particularly the activity levels and the attraction/repulsion responses to other individuals. Dramatically different gene expression was also detected during the time courses of solitarization and gregarization. Bioinformatics analysis of microarray data and behavioral assays indicated that several CSP genes and one takeout gene, affect the attraction/repulsion response to other individuals by regulating peripheral olfactory sensitivity. This is the first evidence to establish the relationship between olfactory-related genes and phase-related behaviors in the migratory locust.
Although a logistic regression model has been built for the migratory locust in previous study [18], an integrated time course analysis of behavioral phase change was not conducted. Our results showed that the behavioral gregarization of fourth-instar solitarious nymphs occurred slowly, but the solitarization of gregarious nymphs was much faster (Figure 1). However, not all of the three key behavioral variables (attraction index, total distance moved and total duration of movement) comprising the linear predictor of phase state—Pgreg, displayed parallel patterns with Pgreg during the time courses (Figure S1). For example, although the Pgreg values from the logistic regression model only modestly shifted, the attraction index of solitarious locusts increased significantly during 64 h crowding. The total distance moved and total duration of movement of solitarious locusts showed remarkable change only at 32 h time point. This indicates that the full behavioral change (as defined by the behavior of the gregarious control group used to build the logistic regression model) did not occur by 64 h, but the various behaviors reached the final gregarious condition at different rates, with attraction index shifting the most rapid one.
Fourth-instar nymphs of the migratory locust exhibited rapid and complicated transcriptomic changes (15.8% of total genes) in response to altered population density. Previous reports in several other insect species, such as fruit fly [3] and honeybee [19], suggest that social stimuli, like other environmental factors, can induce a high level of transcriptional regulation. The overall gene expression pattern showed that the transcriptional response of gregarious nymphs to solitarization is weak and dynamic while that of solitarious nymphs to gregarization is relatively intensive and stable (Figure 2A). Clearly, the trends of overall gene expression are not completely consistent with the rate of behavioral change. One possible explanation is that the acquisition or loss of phase-related behavior in the migratory locust may involve different genes and pathways. Alternatively, some differentially expressed genes do not regulate behavioral change, but they could be involved in other phase-related traits, such as colour, immunity and nutrition.
The present results highlighted several gene categories whose expressions were highly and robustly correlated with time course processes in response to population density change, for example, cuticle proteins, pheromone-binding proteins and hexamerins. In these categories, odorant/pheromone binding protein genes, which are suggested to be involved in olfactory perception [20]–[22], were differentially regulated and more abundant (Figure 2, Table 2). Similar results were observed by our previous studies on the comparison of EST data between two extreme phases of the migratory locust [13]. These findings imply that the change of olfactory pathways may occur rapidly when the locusts experience population density changes. A role of olfactory pathways in triggering behavioral changes and mediating social interactions has been proposed in the desert locust [10], [23], [24]. Further functional analysis is required to elucidate whether these genes are involved in one or both of the two processes, i.e., triggering behavioral changes and mediating social interactions, in the migratory locust.
Analyses of two highly regulated gene categories, CSPs and one takeout, indicated an opposite expression pattern to modulate the shift of attraction/repulsion behavior in response to conspecifics. Most CSP genes and one takeout gene exhibit antenna-rich expression in fourth-instar nymphs and markedly different expression levels between gregarious and solitarious locusts (Figure 3A). In addition, these genes displayed altered expression levels during the time course of IG or CS (Figure 3B). More importantly, knockdown of LmigCSP3 in gregarious locusts led to a shift towards solitarious-phase-like behavior (i.e., being repelled by conspecific volatiles) (Figure 5A, Figure 6A). Similarly, knockdown of LmigTO1 in solitarious locusts suppressed the solitarious behavior (Figure 5D, Figure 6B). However, in both cases, we failed to detect any effect on other phase-related variables (total distance moved and total duration of movement—both associated with activity levels rather than position relative to the stimulus group), suggesting that various phase-related behavioral traits may be regulated by different genes.
It is evident that the overall tendency of CSPs expression during solitarization is similar to behavioral changes, but with a several hour delay. This time delay might be due to the changes of the ratio of the expression levels of CSP and takeout genes. Our results from the single gene knockdown or the double gene knockdown experiments have suggested that the levels of attraction/repulsion may be dependent on the relative expression of CSP and takeout genes (Figure 4, Figure 5). Thus, although expression levels of CSP genes are not significantly decline during 4 h solitarization, the immediate increase in takeout expression could be sufficient for the behavioral change towards repulsion.
Previous studies suggested that both CSP and takeout proteins are large families of soluble binding proteins secreted into the lymph fluid in various insect species [20], [25]. They were proposed to have important roles in olfactory reception [26], development [27], feeding [28], courtship [29] and aging [30]. For instance, in the fire ant Solenopsis invicta, allele variation of an OBP Gp-9 gene can cause differences in workers' abilities to recognize queens and to regulate their numbers [31]. It is proposed that CSP genes also have a role in chemoreception [32]–[34] and locust phase change [35]. The first member of takeout family was discovered in Drosophila melanogaster as a clock-regulated gene that modulates feeding and mating behaviors [28], [36]. Following that, more takeout genes were found to be specifically expressed in chemosensory organs, such as antenna and labellum, in many insect species, suggesting their functions in olfactory perception [21], [37]. Here, we provided direct evidence for the first time that CSP and takeout genes are involved in locust social interactions.
Our results suggested that the differential expressions of CSP and takeout genes led to opposite behavioral responses of gregarious and solitarious nymphs to the odour from gregarious locusts by regulating the peripheral olfactory sensitivity to pheromones. Consistent with this hypothesis, studies in adult desert locusts showed that the regulation of aggregation behavior involves pheromonal communication and that a key compound produced by mature gregarious males, phenylacetonitrile, appears to have a concentration threshold beyond which the pheromone arrest becomes repulsion [38], [39]. Previous studies also suggested that gregarious and solitarious nymphs displayed different neural sensitivity in antennal sensilla basiconica to aggregation pheromone in the desert locust [40]. It is found that CSPs are present at the tips of sensilla in the migratory locust [41] and takeout is selectively localized around the auxiliary cell membranes at the base of sensilla in the blowfly [21]. The changes in CSP and takeout expression may together influence the pheromone sensitivity threshold beyond which attraction becomes repulsion. Alternatively, CSP and takeout genes may determine the sensitivity of different olfactory receptor cells (ORCs) that specifically drive attraction or repulsion, or that produces different firing patterns across olfactory neurons to regulate these two opposing behaviors [40]. Clearly, many neurotransmitters and hormones are involved in the regulation of olfactory sensitivity [42], [43]. Serotonin has recently been revealed to be a key neurochemical mediator of behavioral phase change in the desert locust [11] and has been suggested to be not only involved in the establishment of short-term effects, but also activate second messenger cascades and synthesis of proteins that result in long-term effects [7]. Thus, the differential olfactory sensitivity between gregarious and solitarious locusts regulated by CSP and takeout genes may be modulated by the serotonin and other neurotransmitters. Further investigation of the link between CSPs/takeout expression and some neurotransmitters may lead to a more comprehensive understanding of behavioral phase change.
Behavioral change is the first phase trait in response to crowding and it is crucial for swarm formation and migration in locusts [7]. Our study suggested that the migratory locust displays a different time course of behavioral phase change as compared with the desert locust, Schistocerca gregaria [44], and the Australian plague locust, Chortoicetes terminifera [45]. We identified several candidate gene categories involved in the fundamental phase-defining behavioral differences in locusts, and characterized the functions of CSP and takeout genes, which mediate the rapid switch of attraction/repulsion behaviors. This molecular mechanism is particularly significant for understanding locust aggregation and potentially provides new targets to manipulate locust behavior as novel management strategies.
Materials and Methods
Insects
Gregarious and solitarious locusts used in experiments were from the same stock at the Institute of Zoology, CAS, China. The gregarious cultures were reared in large, well ventilated, cages (25 cm×25 cm×25 cm) at densities of 200–300 insects per cage. The solitarious cultures were reared in isolation for more than 10 generations which remain the phase-traits for reversible phase transition (Figure S13) in physical, visual and olfactory isolation, achieved by ventilating each cage (10 cm×10 cm×25 cm) with charcoal-filtered compressed air. Both colonies were reared under a 14∶10 light/dark photo regime at 30±2°C and on a diet of fresh greenhouse-grown wheat seedlings and wheat bran.
Experimental samples
Isolation of gregarious locusts
The fourth-instar gregarious nymphs were separately reared in the solitarious rearing cages supplied with food. After 0, 1, 4, 16, 32 or 64 h of treatments, their behavioral state was measured, or their heads (including antennae) or antennae were dissected and immediately put into liquid nitrogen for microarray and qRT-PCR experiments. All the insects were sampled at the same time point (9 : 00 am) for 4–5 biological replicates (4 replicates in CS and 5 replicates in IG), and equal numbers of male and female insects (six insects in total) were sampled in each biological replicate (the same applies for the tissue sampling below). Each biological replicate was individually hybridized to the array; separate replicates were used for qRT-PCR validation.
Crowding of solitarious locusts
Two solitarious fourth-instar locusts were introduced into the solitarious rearing cage, which contained 20 gregarious nymphs of the same developmental stage supplied with food. After staying with the stimulus group for 0, 1, 4, 16, 32 or 64 h, locusts were taken for behavioral assays, or their heads (including antennae) or antennae were dissected and immediately put into liquid nitrogen for microarray and qRT-PCR experiments.
Tissue sampling
Six tissues, including antenna, labial palp, brain, wing, hind leg and fat body, from gregarious and solitarious fourth-instar nymphs were dissected and put into liquid nitrogen.
Behavioral assay
The arena assay experiment was performed in a rectangular perspex arena (40 cm length×30 cm width×10 cm height) with opaque walls and a clear top (Figure S14A) according to previous study [17]. One of the separated chambers (7.5 cm length×30 cm width×10 cm height) contained 15 fourth-instar gregarious locusts as a stimulus group, and the other chamber was left empty. Before measurement, the locusts were restricted in a Perspex cylinder for 2 min. Then, locusts were released into the arena and monitored for 300 s. EthoVision video tracking system (Netherlands, Noldus Information Technology) was used to automatically record individual behavior. Eleven behavioral variables were acquired: entry frequency in stimulus area (stimulus area was defined as 25% of the arena closest to the stimulus group, 14A in red), latency of first occurrence in stimulus area, total duration in area close to the wall, entry frequency in area close to the wall, entry frequency in the region opposite to stimulus area (opposite of stimulus area was defined as the 25% of the arena at the opposite end to the stimulus group, Figure S14A in blue), latency of first occurrence in the opposite of stimulus area, mean distance to the stimulus group, attraction index (total duration in stimulus area, total duration in the opposite of stimulus area and total duration in middle area were weighted by 1, −1 and 0, respectively. Attraction index = 1×total duration in stimulus area+(−1)×total duration in the opposite of stimulus area+0×total duration in middle area), total distance moved, total duration of movement, and frequency of movement. Based on the data from 86 gregarious and 69 solitarious fourth-instar nymphs, a forward stepwise approach was performed to construct the binary logistic regression model: Pgreg = eη/ (1+eη), where η = β0+β1·X1+β2·X2+…+βk·Xk. Pgreg indicates the probability of a locust being considered as the gregarious. Pgreg = 1 means fully gregarious behavior and Pgreg = 0 means fully solitarious behavior. This model shared similar features with previous logistic model [11], [17] as the retained variables indicated: total distance moved and total duration of movement represent the activity levels, and attraction index represent the attraction or repulsion to the stimulus group.
A Y-tube olfactometer was used to analyze the behavioral responses of individual locust to volatiles (including volatiles from body and feces) from 30 fourth-instar gregarious locusts in the absence of any visual cues (Figure S14B). Individual locust was recorded as “first choice” for volatile or air (whenever the locust moved more than 5 cm into either arm) or “no choice” (N.C) in 5 min.
Oligonucleotide microarray design and construction
All sequences for probe design were derived from 9,154 locust unigenes [13]. The 60-mer oligonucleotide probes were designed and synthesized by Beijing Genomics Institute, CAS. The probes were dissolved in 3×SSC solution at 40 µM and finally spotted on poly-L-lysine coated slides using a SpotArray Enterprise microarrayer (PerkinElmer Life Sciences Inc.). Each slide contained 48 blocks, with 20 columns and 20 rows in each block. Every probe had duplicate spots. The probes of three house-keeping genes (beta-actin, GAPDH and 18S RNA) and two rice genes were spotted on each block as positive and negative controls, respectively.
RNA preparation, cDNA labeling, and microarray hybridization
Total RNA was extracted using RNeasy Mini Kit (QIAGEN) according to the manufacturer's protocol. cDNA integrated with aminoallyl-dUTP (Sigma) was prepared from total RNA by reverse transcription (Invitrogen). The purified probes were labeled covalently with Cy3 and Cy5 (Amersham Pharmacia Biotech). Subsequently, mixed probes were hybridized to the microarray slide for 16–18 hours at 42°C under darkness. A combined loop hybridization design was adopted in the microarray hybridization experiments (Figure S15). For dye bias control, dye-swap strategy was used for microarray hybridization.
Microarray data processing
Microarray slides were scanned by a GenePix 4000B scanner and raw data was acquired with GenePix 5.0 software (Axon Instrument). After background correction and data normalization, significance analysis was performed using a fix model in MAANOVA (1.4.1) software package [46] in R 2.6.0 platform. All data were transformed by Bayesian methods [47] to compare with references (gregarious locusts in IG and solitarious locusts in CS). Genes with significance levels of p<0.005 and fold change >1.5 were considered as differentially expressed. Unsupervised hierarchical clustering [48] was performed with cluster 3.0 software using uncentered Pearson correlation and complete linkage, and presented by Java Treeview software [49]. Significant pathways were analyzed by KEGG Orthology-Based Annotation System (KOBAS, http://kobas.cbi.pku.edu.cn). InterPro categories were enriched for supplied gene list based on the algorithm presented by GOstat [50]. For each InterPro term, the difference between tested and reference gene groups was represented by a p value, which is estimated by chi square test. Fisher exact test was used when any expected value of count is <5. The p values of multitest were corrected by FDR [51]. Categories were considered as significantly enriched at p<0.05.
Quantitative RT-PCR (qRT-PCR)
cDNA was reverse-transcribed from 2 µg total RNA using MMLV reverse transcriptase (Promega). The standard curve method [52] was used to measure the mRNA relative expression levels, which were normalized by beta-actin [16], [42]. We adjusted all values of relative expression levels of these genes for all qRT-PCR experiments based on the starting concentration of plasmids initially used to dilute a series of standard curves in tissue-specific experiments. PCR amplification was conducted using Mx3000P spectrofluorometric thermal cycler (Stratagene) and RealMasterMix (SYBR Green) kit (Tiangen), initiated with a 2-min incubation at 95°C, followed by 40 cycles of 95°C, 20 s; 58°C, 20 s; 68°C, 20 s. Melting curve analysis was performed to confirm the specificity of amplification.
RNA interference (RNAi)
Double-stranded RNA (dsRNA) of green fluorescent protein (GFP), LmigCSP3 or LmigTO1 were prepared using T7 RiboMAX Express RNAi system (Promega) following the manufacturer's instructions. For both gregarious and solitarious locusts, fourth-instar locusts remained uninjected or were injected with 18 µg (6 µg/µl) of dsGFP, dsLmigCSP3, dsLmigTO1 or mixed dsLmigCSP3 and dsLmigTO1 (dsLmigCSP3&TO1) in the second ventral segment of the abdomen. Then, the injected gregarious locusts were marked and put back into gregarious-rearing cages, and the injected solitarious locusts were put back into solitarious-rearing cages. Three days later, the effects of RNAi on mRNA relative expression levels were investigated by qRT-PCR and the behavior was examined as described above.
Statistical analysis
Differences between treatments were compared either by Student's t-test or by one-way analysis of variance (ANOVA) followed by a Tukey's test for multiple comparisons. Behavior-related data were analyzed by Mann-Whitney U test because of its non-normal distribution characteristics. Chi square test was used for significance test between numbers of locusts in each arm in Y-tube assay. Differences were considered significant at p<0.05. Values were reported as mean ± SEM. Data were analyzed using SPSS 15.0 software (SPSS Inc., Chicago, IL).
Supporting Information
Zdroje
1. ParrishJK
HamnerWM
1997 Animal groups in three dimensions Cambridge Cambridge University Press 378
2. KrauseJ
RuxtonGD
2002 Living in groups Oxford Oxford University Press 210
3. WangL
DankertH
PeronaP
AndersonDJ
2008 A common genetic target for environmental and heritable influences on aggressiveness in Drosophila. Proc Natl Acad Sci USA 105 5657 5663
4. Ben-ShaharY
RobichonA
SokolowskiMB
RobinsonGE
2002 Influence of gene action across different time scales on behavior. Science 296 741 744
5. DongS
ClaytonDF
2008 Partial dissociation of molecular and behavioral measures of song habituation in adult zebra finches. Genes Brain Behav 7 802 809
6. UvarovBP
1977 Grasshoppers and locusts Vol. 2 Cambridge Cambridge University Press 613
7. PenerMP
SimpsonSJ
2009 Locust phase polyphenism: an update. Adv Insect Physiol 36 1 272
8. UvarovBP
1921 A revision of the genus Locusta with a new theory as to the periodicity and migrations of locusts. Bull Entomol Res 12 135 163
9. SimpsonSJ
DesplandE
HageleBF
DodgsonT
2001 Gregarious behavior in desert locusts is evoked by touching their back legs. Proc Natl Acad Sci USA 98 3895 3897
10. RoessinghP
BouaïchiA
SimpsonSJ
1998 Effects of sensory stimuli on the behavioural phase state of the desert locust, Schistocerca gregaria. J Insect Physiol 44 883 893
11. AnsteyML
RogersSM
OttSR
BurrowsM
SimpsonSJ
2009 Serotonin mediates behavioral gregarization underlying swarm formation in desert locusts. Science 323 627 630
12. MaZ
YuJ
KangL
2006 LocustDB: A relational database for the transcriptome and biology of the migratory locust (Locusta migratoria). BMC genomics 7 11
13. KangL
ChenXY
ZhouY
LiuBW
ZhengW
2004 The analysis of large-scale gene expression correlated to the phase changes of the migratory locust. Proc Natl Acad Sci USA 101 17611 17615
14. WangHS
WangXH
ZhouCS
HuangLH
ZhangSF
2007 cDNA cloning of heat shock proteins and their expression in the two phases of the migratory locust. Insect Mol Biol 16 207 219
15. WeiY
ChenS
YangP
MaZ
KangL
2009 Characterization and comparative profiling of the small RNA transcriptomes in two phases of locust. Genome Biol 10 R6
16. GuoW
WangXH
ZhaoDJ
YangPC
KangL
2010 Molecular cloning and temporal-spatial expression of I element in gregarious and solitary locusts. J Insect Physiol 56 943 948
17. RoessinghP
SimpsonSJ
JamesS
1993 Analysis of phase-related changes in behaviour of desert locust nymphs. Proc R Soc B-Biol Sci 252 43 49
18. HosteB
SimpsonSJ
TanakaS
De LoofA
BreuerM
2002 A comparison of phase-related shifts in behavior and morphometrics of an albino strain, deficient in [His7]-corazonin, and a normally colored Locusta migratoria strain. J Insect Physiol 48 791 801
19. WhitfieldCW
Ben-ShaharY
BrilletC
LeonciniI
CrauserD
2006 Genomic dissection of behavioral maturation in the honey bee. Proc Natl Acad Sci USA 103 16068 16075
20. PelosiP
ZhouJJ
BanLP
CalvelloM
2006 Soluble proteins in insect chemical communication. Cell Mol Life Sci 63 1658 1676
21. FujikawaK
SenoK
OzakiM
2006 A novel Takeout-like protein expressed in the taste and olfactory organs of the blowfly, Phormia regina. FEBS J 273 4311 4321
22. BohbotJ
VogtRG
2005 Antennal expressed genes of the yellow fever mosquito (Aedes aegypti L.); characterization of odorant-binding protein 10 and takeout. Insect Biochem Mol Biol 35 961 979
23. DesplandE
2001 Role of olfactory and visual cues in the attraction/repulsion responses to conspecifics by gregarious and solitarious desert locusts. J Insect Behav 14 35 46
24. HeifetzY
VoetH
ApplebaumS
1996 Factors affecting behavioral phase transition in the desert locust,Schistocerca gregaria (Forskål) (Orthoptera: Acrididae). J Chem Ecol 22 1717 1734
25. HagaiT
CohenM
BlochG
2007 Genes encoding putative Takeout/juvenile hormone binding proteins in the honeybee (Apis mellifera) and modulation by age and juvenile hormone of the takeout-like gene GB19811. Insect Biochem Mol Biol 37 689 701
26. LaughlinJD
HaTS
JonesDNM
SmithDP
2008 Activation of pheromone-sensitive neurons is mediated by conformational activation of pheromone-binding protein. Cell 133 1255 1265
27. MaleszkaJ
ForêtS
SaintR
MaleszkaR
2007 RNAi-induced phenotypes suggest a novel role for a chemosensory protein CSP5 in the development of embryonic integument in the honeybee (Apis mellifera). Dev Genes Evol 217 189 196
28. Sarov-BlatL
SoWV
LiuL
RosbashM
2000 The Drosophila takeout gene is a novel molecular link between circadian rhythms and feeding behavior. Cell 101 647 656
29. DauwalderB
TsujimotoS
MossJ
MattoxW
2002 The Drosophila takeout gene is regulated by the somatic sex-determination pathway and affects male courtship behavior. Genes Dev 16 2879 2892
30. BauerJ
AntoshM
ChangC
SchorlC
KolliS
2010 Comparative transcriptional profiling identifies takeout as a gene that regulates life span. Aging 2 298 310
31. KriegerMJB
RossKG
2002 Identification of a major gene regulating complex social behavior. Science 295 328 332
32. ForêtS
WannerKW
MaleszkaR
2007 Chemosensory proteins in the honey bee: Insights from the annotated genome, comparative analyses and expressional profiling. Insect Biochem Mol Biol 37 19 28
33. WannerK
WillisL
TheilmannD
IsmanM
FengQ
2004 Analysis of the insect OS-D-like gene family. J Chem Ecol 30 889 911
34. LartigueA
CampanacciV
RousselA
LarssonAM
JonesTA
2002 X-ray structure and ligand binding study of a moth chemosensory protein. J Biol Chem 277 32094 32098
35. AngeliS
CeronF
ScaloniA
MontiM
MontefortiG
1999 Purification, structural characterization, cloning and immunocytochemical localization of chemoreception proteins from Schistocerca gregaria. Eur J Biochem 262 745 754
36. SoWV
Sarov-BlatL
KotarskiCK
McDonaldMJ
AlladaR
2000 takeout, a novel Drosophila gene under circadian clock transcriptional regulation. Mol Cell Biol 20 6935 6944
37. JordanMD
StanleyD
MarshallSDG
De SilvaD
CrowhurstRN
2008 Expressed sequence tags and proteomics of antennae from the tortricid moth, Epiphyas postvittana. Insect Mol Biol 17 361 373
38. RonoE
NjagiPGN
BashirMO
HassanaliA
2008 Concentration-dependent parsimonious releaser roles of gregarious male pheromone of the desert locust, Schistocerca gregaria. J Insect Physiol 54 162 168
39. Obeng-OforiD
TortoB
HassanaliA
1993 Evidence for mediation of two releaser pheromones in the aggregation behavior of the gregarious desert locust, Schistocerca gregaria (forskal) (Orthoptera: Acrididae). J Chem Ecol 19 1665 1676
40. OchiengSA
HanssonBS
1999 Responses of olfactory receptor neurones to behaviourally important odours in gregarious and solitarious desert locust, Schistocerca gregaria. Physiol Entomol 24 28 36
41. JinX
BrandazzaA
NavarriniA
BanL
ZhangS
2005 Expression and immunolocalisation of odorant-binding and chemosensory proteins in locusts. Cell Mol Life Sci 62 1156 1166
42. BlenauW
BaumannA
2001 Molecular and pharmacological properties of insect biogenic amine receptors: lessons from Drosophila melanogaster and Apis mellifera. Arch Insect Biochem Physiol 48 13 38
43. AntonS
GadenneC
1999 Effect of juvenile hormone on the central nervous processing of sex pheromone in an insect. Proc Natl Acad Sci USA 96 5764 5767
44. RoessinghP
SimpsonSJ
1994 The time course of behavioural phase change in nymphs of the desert locust, Schistocerca gregaria. Physiol Entomol 19 191 197
45. GrayLJ
SwordGA
AnsteyML
ClissoldFJ
SimpsonSJ
2009 Behavioural phase polyphenism in the Australian plague locust (Chortoicetes terminifera). Biol Lett 5 306 309
46. WuH
KerrM
CuiX
ChurchillG
2003 MAANOVA: A software package for the analysis of spotted cDNA microarray experiments.
ParmigianiG
GarrettES
IrizarryRA
ZegerSL
The Analysis of Gene Expression Data London Springer 313 341
47. TownsendJ
HartlD
2002 Bayesian analysis of gene expression levels: statistical quantification of relative mRNA level across multiple strains or treatments. Genome Biol 3 research0071.1 research0071.16
48. EisenMB
SpellmanPT
BrownPO
BotsteinD
1998 Cluster analysis and display of genome-wide expression patterns. Proc Natl Acad Sci USA 95 14863 14868
49. SaldanhaAJ
2004 Java Treeview–extensible visualization of microarray data. Bioinformatics 20 3246 3248
50. BeissbarthT
SpeedTP
2004 GOstat: find statistically overrepresented Gene Ontologies within a group of genes. Bioinformatics 20 1464 1465
51. BenjaminiY
HochbergY
1995 Controlling the false discovery rate: a practical and powerful approach to multiple testing. J R Stat Soc Ser B: Stat Methodol 57 289 300
52. WangHS
ZhouCS
GuoW
KangL
2006 Thermoperiodic acclimations enhance cold hardiness of the eggs of the migratory locust. Cryobiology 53 206 217
Štítky
Genetika Reprodukční medicínaČlánek vyšel v časopise
PLOS Genetics
2011 Číslo 2
Nejčtenější v tomto čísle
- Meta-Analysis of Genome-Wide Association Studies in Celiac Disease and Rheumatoid Arthritis Identifies Fourteen Non-HLA Shared Loci
- MiRNA Control of Vegetative Phase Change in Trees
- Risk Alleles for Systemic Lupus Erythematosus in a Large Case-Control Collection and Associations with Clinical Subphenotypes
- The Cardiac Transcription Network Modulated by Gata4, Mef2a, Nkx2.5, Srf, Histone Modifications, and MicroRNAs